Correlation, Concepts, Meaning, Definitions, Significance, Uses and Types/Classification

Correlation is a statistical concept that measures the degree of relationship between two or more variables. The main idea is to understand how one variable changes when another variable changes. For example, in business, understanding the relationship between advertising expenditure and sales revenue can help managers make informed decisions. Correlation focuses on association, not causation. This means that even if two variables move together, it does not imply that one causes the other; they may simply be related.

Meaning of Correlation

Correlation refers to a statistical measure that expresses the extent to which two variables are related. It is used to study the interdependence between variables. In a business context, correlation helps in analyzing patterns, forecasting trends, and making decisions based on observed relationships.

For instance:

  • If sales increase with higher advertising expenditure, there is a positive correlation.

  • If employee absenteeism increases while productivity decreases, there is a negative correlation.

Definitions of Correlation

  • Karl Pearson (1896) “Correlation is the degree to which one variable is linearly related to another variable.”

  • Gosset (Student) “Correlation is a statistical measure that shows the tendency of variables to vary together.”

  • Croxton and Cowden “Correlation is the degree of correspondence between two or more variables. It measures the extent to which changes in one variable are associated with changes in another.”

Significance of Correlation

  • Identifies Relationships Between Variables

Correlation helps identify whether and how two variables are related. For instance, it can reveal if there is a relationship between factors like advertising spend and sales revenue. This insight helps businesses and researchers understand the dynamics at play, providing a foundation for further investigation.

  • Predictive Power

Once a correlation between two variables is established, it can be used to predict the behavior of one variable based on the other. For example, if a strong positive correlation is found between temperature and ice cream sales, higher temperatures can predict increased sales. This predictive ability is especially valuable in decision-making processes in business, economics, and health.

  • Guides Decision-Making

In business and economics, understanding correlations enables better decision-making. For example, a company can analyze the correlation between marketing activities and customer acquisition, allowing for better resource allocation and strategy formulation. Similarly, policymakers can examine correlations between economic indicators (e.g., unemployment rates and inflation) to make informed policy choices.

  • Quantifies the Strength of Relationships

The correlation coefficient quantifies the strength of the relationship between variables. A higher correlation coefficient (close to +1 or -1) signifies a stronger relationship, while a coefficient closer to 0 indicates a weak relationship. This quantification helps in understanding how closely variables move together, which is crucial in areas like finance or research.

  • Helps in Risk Management

In finance, correlation is used to assess the relationship between different investment assets. Investors use this information to diversify their portfolios effectively by selecting assets that are less correlated, thereby reducing risk. For example, stocks and bonds may have a negative correlation, meaning when stock prices fall, bond prices may rise, offering a balancing effect.

  • Basis for Further Analysis

Correlation often serves as the first step in more complex analyses, such as regression analysis or causality testing. It helps researchers and analysts identify potential variables that should be explored further. By understanding the initial relationships between variables, more detailed models can be constructed to investigate causal links and deeper insights.

  • Helps in Hypothesis Testing

In research, correlation is a key tool for hypothesis testing. Researchers can use correlation coefficients to test their hypotheses about the relationships between variables. For example, a researcher studying the link between education and income can use correlation to confirm whether higher education levels are associated with higher income.

Uses of Correlation in Business Decisions

  • Sales Forecasting

Correlation helps businesses understand the relationship between sales and factors like advertising expenditure, price changes, or seasonal demand. By analyzing how sales vary with these variables, managers can predict future sales more accurately. For example, if historical data shows a strong positive correlation between advertising spend and revenue, the company can plan marketing budgets to optimize sales. This predictive ability enhances strategic decision-making and reduces uncertainties in business planning.

  • Risk Assessment in Finance

Financial analysts use correlation to assess the relationship between different investment assets, such as stocks, bonds, or commodities. A strong positive or negative correlation between assets can help in portfolio diversification. By investing in negatively correlated assets, risks can be minimized. Correlation provides insight into how changes in one financial variable, like market index movements, affect another, assisting managers in making informed decisions to balance potential returns with acceptable risk levels.

  • Pricing Decisions

Businesses use correlation to determine the impact of price changes on demand. If historical data shows a negative correlation between price and sales, lowering prices may increase sales volume. Conversely, understanding weak correlations helps avoid unnecessary price reductions. This analysis enables managers to set optimal prices that maximize revenue and profit. Correlation thus supports data-driven pricing strategies, ensuring that pricing decisions align with consumer behavior, market trends, and overall business objectives.

  • Inventory Management

Correlation assists in managing inventory by studying the relationship between stock levels and demand patterns. For example, if demand for a product is positively correlated with seasonal factors, businesses can adjust inventory accordingly to prevent overstocking or stockouts. By using correlation analysis, companies can forecast demand accurately, optimize warehouse space, reduce holding costs, and ensure timely product availability. This improves operational efficiency and supports customer satisfaction by maintaining consistent supply levels.

  • Marketing Strategy Evaluation

Businesses analyze correlation between marketing campaigns and customer response to evaluate effectiveness. A strong positive correlation between advertising efforts and sales growth indicates successful campaigns, while weak correlation may signal a need for adjustment. Correlation also helps in identifying which media channels, promotional offers, or messaging strategies generate better results. This analytical approach enables marketers to allocate resources efficiently, improve targeting, and enhance overall return on investment for marketing initiatives.

  • Human Resource Planning

Correlation can be used to understand relationships between employee-related factors such as training, absenteeism, and performance. For instance, a positive correlation between training hours and productivity helps HR managers design effective training programs. Similarly, analyzing the correlation between absenteeism and performance can guide policies to improve workforce efficiency. By quantifying these relationships, organizations make informed HR decisions, boost employee productivity, and align human resource planning with strategic business goals.

  • Product Development and Innovation

Correlation analysis aids in product development by studying the relationship between customer preferences, features, and product success. For example, a positive correlation between product usability and customer satisfaction indicates which features drive acceptance. This information helps businesses focus resources on high-impact areas, innovate effectively, and design products that meet market needs. By relying on data-driven insights from correlation, companies reduce the risk of product failure and enhance customer-centric decision-making.

  • Economic and Market Analysis

Businesses use correlation to analyze relationships between economic variables, such as inflation, interest rates, and consumer spending. Understanding these correlations helps in anticipating market trends, making investment decisions, and adjusting strategies according to economic conditions. For instance, a negative correlation between interest rates and investment levels can guide financial planning. Correlation thus enables firms to respond proactively to changes in the economic environment, reducing uncertainty and improving long-term strategic decisions.

Types / Classification of Correlation

Correlation can be classified in different ways depending on the direction, degree, number of variables involved, and nature of relationship. These classifications help in better understanding and applying correlation in business and economic analysis.

1. Classification Based on Direction

  • Positive Correlation

Positive correlation exists when two variables move in the same direction. An increase in one variable leads to an increase in the other, and a decrease in one results in a decrease in the other. For example, income and consumption generally show positive correlation. A positive correlation coefficient ranges between 0 and +1, indicating the strength of the relationship.

  • Negative Correlation

Negative correlation occurs when two variables move in opposite directions. An increase in one variable leads to a decrease in the other and vice versa. For instance, price and demand usually have a negative correlation. The coefficient of negative correlation lies between 0 and –1, showing the extent of inverse relationship.

  • Zero Correlation

Zero correlation indicates no relationship between the variables. Changes in one variable do not bring any systematic change in the other. For example, shoe size and intelligence have no correlation. In this case, the correlation coefficient is 0, showing complete independence.

2. Classification Based on Degree

  • Perfect Correlation

Perfect correlation exists when the variables move in exact proportion to each other. A correlation coefficient of +1 indicates perfect positive correlation, while –1 indicates perfect negative correlation. Such relationships are rare in real-world business situations.

  • High Degree of Correlation

When the correlation coefficient is close to +1 or –1 but not exactly equal, the variables are said to have a high degree of correlation. This indicates a strong relationship, commonly found in economic and business data such as income and savings.

  • Moderate Degree of Correlation

Moderate correlation exists when the correlation coefficient lies at a mid-range value, neither too high nor too low. It indicates that variables are related but not strongly. Many practical business relationships fall under this category.

  • Low Degree of Correlation

Low correlation exists when the coefficient is close to zero. It indicates a weak relationship between variables. Changes in one variable result in small or inconsistent changes in the other.

3. Classification Based on Number of Variables

  • Simple Correlation

Simple correlation studies the relationship between two variables only. For example, price and demand or income and expenditure. It is the most commonly used type of correlation in business analysis.

  • Multiple Correlation

Multiple correlation studies the relationship between one variable and two or more other variables simultaneously. For example, sales may depend on price, advertising, and income levels. This type of correlation helps in complex business decision-making.

  • Partial Correlation

Partial correlation measures the relationship between two variables while keeping the influence of other variables constant. It helps in identifying the true relationship between selected variables in the presence of multiple influencing factors.

4. Classification Based on Nature of Relationship

  • Linear Correlation

Linear correlation exists when the change in one variable results in a constant rate of change in another variable. The relationship can be represented by a straight line on a graph. Most statistical methods assume linear correlation.

  • Non-Linear (Curvilinear) Correlation

Non-linear correlation exists when the rate of change between variables is not constant. The relationship is represented by a curve rather than a straight line. For example, advertising expenditure and sales may show diminishing returns after a certain point.

Data and Information

Data and Information are fundamental concepts in Business Analytics and decision-making. Organizations collect vast amounts of data from customers, employees, operations, finance, and markets. However, raw data alone has little value unless it is processed and transformed into meaningful information. Data serves as the basic input, while information is the useful output obtained after processing and analyzing data. Both are essential resources that help businesses understand their environment, solve problems, improve performance, and make strategic decisions. Understanding the distinction between data and information is important for effective business analysis and management.

Data

Data refers to raw facts, figures, observations, measurements, or symbols collected from various sources. It is unprocessed and does not provide meaningful insights on its own. Data can be numerical, textual, visual, or audio-based and serves as the foundation for analysis and decision-making. Businesses collect data through transactions, surveys, websites, social media, sensors, and operational activities.

Data is often scattered and unorganized until it is processed. Without analysis, it may not help managers understand business situations. Therefore, organizations use analytical tools and technologies to transform raw data into useful information.

Examples of Data

    • Sales figures: 500, 650, 700.
    • Customer names.
    • Employee attendance records.
    • Product codes.
    • Website visitor counts.
    • Customer survey responses.

Characteristics of Data

  • Raw Facts and Figures

Data consists of raw facts and figures collected from various sources before any processing or analysis takes place. These facts may be numerical, textual, graphical, or symbolic in nature. Raw data by itself does not provide meaningful insights or conclusions. It serves as the basic input for information systems and analytical processes. Organizations collect raw data from transactions, surveys, observations, and digital platforms. Once processed and organized, these facts become useful information that supports decision-making and business operations.

  • Unprocessed Nature

One of the primary characteristics of data is that it remains unprocessed in its original form. It has not been analyzed, interpreted, or organized into a meaningful structure. Because of its unprocessed nature, data alone cannot directly support decision-making. Businesses need to classify, sort, and analyze data before extracting valuable insights. The transformation of unprocessed data into meaningful information is a fundamental process in Business Analytics and management information systems.

  • Collected from Multiple Sources

Data can be gathered from a wide variety of internal and external sources. Internal sources include sales records, employee databases, production reports, and financial statements. External sources include customers, suppliers, government reports, social media, and market research studies. Collecting data from multiple sources provides organizations with a comprehensive view of business operations and market conditions. This diversity improves analytical accuracy and supports more informed decision-making across various business functions.

  • Quantitative and Qualitative

Data can be classified into quantitative and qualitative forms. Quantitative data consists of numerical values such as sales revenue, production volume, and employee salaries. Qualitative data includes descriptive information such as customer opinions, feedback, and product reviews. Both forms of data are important in Business Analytics because they provide different perspectives on business performance. Quantitative data supports statistical analysis, while qualitative data helps understand behaviors, perceptions, and experiences that influence business outcomes.

  • Foundation of Information

Data serves as the foundation from which information is generated. Without data, organizations cannot produce meaningful reports, analyses, or business insights. Information is created when raw data is processed, organized, and interpreted. The quality of information depends heavily on the quality of the underlying data. Accurate and complete data leads to reliable information, while poor-quality data results in misleading conclusions. Therefore, data is considered the building block of effective decision-making and business intelligence.

  • Can Be Structured or Unstructured

Data exists in both structured and unstructured forms. Structured data follows a predefined format and is stored in databases and spreadsheets. Unstructured data includes emails, videos, social media posts, images, and documents that do not follow a specific format. Modern organizations generate large amounts of both types. Structured data is easier to analyze using traditional tools, while unstructured data often requires advanced analytical technologies. Together, they provide a complete understanding of business activities and customer behavior.

  • Large in Volume

Organizations generate and collect enormous volumes of data every day through business transactions, online activities, sensors, and digital interactions. The growth of technology has significantly increased the amount of available data. Large data volumes provide more opportunities for analysis and insight generation. However, managing such vast amounts of information requires advanced storage systems and analytical tools. The ability to handle large datasets effectively has become a key aspect of Business Analytics and competitive business operations.

  • Requires Processing

Data becomes useful only after it is processed and transformed into information. Processing involves organizing, classifying, validating, analyzing, and interpreting data. Without processing, data remains a collection of isolated facts with limited value. Organizations use various analytical tools and technologies to process data efficiently. Effective data processing helps businesses identify trends, monitor performance, solve problems, and support decision-making. This characteristic highlights the importance of analytics in converting raw data into actionable insights.

Information

Information refers to processed, organized, and meaningful data that helps individuals and organizations understand situations, solve problems, and make informed decisions. While data consists of raw facts and figures, information is obtained when that data is analyzed, classified, interpreted, and presented in a useful form. Information provides context and meaning, making it valuable for business operations and management activities.

In organizations, information is generated from various sources such as sales records, customer databases, financial reports, market research, and operational systems. It helps managers evaluate performance, identify trends, forecast future outcomes, and develop effective strategies. High-quality information should be accurate, relevant, timely, complete, reliable, and easy to understand. These qualities ensure that decision-makers can depend on the information for planning and control.

Information plays a crucial role in Business Analytics because it transforms large amounts of data into actionable insights. It supports strategic, tactical, and operational decisions across different business functions. Without meaningful information, organizations would struggle to understand market conditions, customer needs, and business performance.

Example

  • Data: Monthly sales figures of ₹50,000, ₹60,000, and ₹75,000.
  • Information: Sales increased by 50% over three months, indicating strong business growth.

Thus, information is a valuable organizational resource that improves decision-making, reduces uncertainty, enhances efficiency, and contributes to overall business success.

Characteristics of Information

  • Meaningful and Purposeful

Information is meaningful data that has been processed and organized to serve a specific purpose. Unlike raw data, information provides context and significance, making it useful for users. It helps managers understand situations, identify opportunities, and solve problems effectively. Meaningful information enables organizations to focus on relevant facts rather than large amounts of unorganized data. The value of information lies in its ability to support decision-making and improve business performance. Therefore, information must be clear, understandable, and directly related to the needs of users.

  • Processed and Organized

Information is created after data has been processed, classified, summarized, and organized into a useful format. Processing removes errors, eliminates duplication, and arranges data logically. Organized information is easier to understand and interpret compared to raw data. Businesses use reports, charts, dashboards, and summaries to present information effectively. Proper organization ensures that users can quickly access relevant insights and make informed decisions. This characteristic distinguishes information from raw data, which lacks structure and meaning.

  • Relevant

Information must be relevant to the purpose for which it is being used. Relevant information directly addresses a problem, decision, or business objective. Irrelevant information may create confusion and reduce decision-making effectiveness. Organizations need information that aligns with their goals, strategies, and operational requirements. Relevance ensures that managers focus on important factors and avoid wasting time on unnecessary details. In Business Analytics, relevant information improves the quality of decisions and enhances organizational performance.

  • Accurate

Accuracy is one of the most important characteristics of information. Accurate information is free from errors, omissions, and distortions. Decisions based on inaccurate information can lead to financial losses, operational inefficiencies, and poor strategic choices. Organizations must ensure data quality and validation before generating information. Accurate information increases confidence in decision-making and improves business outcomes. Maintaining accuracy requires proper data collection, processing, and verification procedures throughout the information management process.

  • Timely

Information must be available at the right time to be useful. Timely information enables managers to respond quickly to opportunities, threats, and changing business conditions. Delayed information may lose its value and become irrelevant for decision-making. In dynamic business environments, organizations require real-time or near real-time information to remain competitive. Timeliness supports proactive management and helps businesses take corrective actions before problems become serious. Therefore, speed and accessibility are essential aspects of effective information.

  • Complete

Complete information contains all the necessary details required for understanding a situation and making decisions. Incomplete information may result in incorrect conclusions and poor business outcomes. Organizations need comprehensive information that covers all relevant aspects of a problem or opportunity. Completeness ensures that managers have a full picture before taking action. However, information should be complete without becoming excessively detailed or overwhelming. A balance between completeness and simplicity is important for effective communication and analysis.

  • Reliable

Reliable information can be trusted by users because it comes from credible sources and is generated through consistent processes. Reliability ensures that information accurately represents reality and produces dependable results. Organizations depend on reliable information for planning, forecasting, and strategic decision-making. Information derived from verified data sources and proper analytical methods is more trustworthy. Reliability increases user confidence and reduces uncertainty in business operations and management activities.

  • Understandable

Information should be presented in a clear and understandable manner so that users can interpret it easily. Complex or confusing information may reduce its usefulness and lead to misinterpretation. Organizations often use charts, graphs, dashboards, and summaries to improve understanding. Information should be tailored to the needs and knowledge levels of its users. Easy-to-understand information facilitates communication, enhances decision-making, and improves organizational effectiveness. Simplicity and clarity are essential characteristics of high-quality information.

Differences Between Data and Information

Aspect Data Information
Definition Raw, unorganized facts Processed, organized data
Purpose Collected for future use Created for immediate insights
Context Lacks meaning Has specific meaning and relevance
Form Numbers, symbols, text Reports, summaries, visualizations
Examples “100,” “200,” “300” “The average score is 200”

Relationship Between Data and Information

Data and information are interdependent. Data serves as the input, and when processed through analysis, it becomes information. This information is then used for decision-making or problem-solving.

  • Raw Data: Monthly sales figures: 100, 150, 200.
  • Processing: Calculate the total sales for the quarter.
  • Information: Quarterly sales are 450 units.

This cycle continues as new data is collected, processed, and turned into updated information.

Importance of Data and Information

  • Supports Decision-Making

Data and information provide a strong foundation for decision-making in organizations. Managers rely on accurate and relevant information to evaluate alternatives, assess risks, and choose the most appropriate course of action. Decisions based on facts and analysis are generally more reliable than those based on assumptions or intuition. Effective use of data and information helps organizations make informed decisions at strategic, tactical, and operational levels.

  • Improves Planning

Data and information play a crucial role in business planning. They help organizations understand current conditions, identify trends, and forecast future events. By analyzing available information, businesses can develop realistic goals, allocate resources effectively, and prepare strategies for future growth. Proper planning reduces uncertainty and enhances the likelihood of achieving organizational objectives.

  • Enhances Operational Efficiency

Organizations use data and information to monitor and improve business processes. Information helps identify inefficiencies, delays, and areas requiring improvement. Managers can optimize workflows, improve resource utilization, and increase productivity through effective analysis. Better operational efficiency leads to reduced costs and improved organizational performance.

  • Facilitates Problem-Solving

Data and information help organizations identify problems, analyze causes, and evaluate possible solutions. Accurate information enables managers to understand complex situations and make logical decisions to resolve issues. A systematic approach to problem-solving improves organizational effectiveness and minimizes the impact of business challenges.

  • Supports Performance Evaluation

Data and information enable organizations to measure and evaluate performance against established goals and standards. Managers can monitor progress, assess achievements, and identify areas where corrective actions are needed. Performance evaluation helps ensure that organizational activities remain aligned with business objectives and strategic plans.

  • Reduces Uncertainty and Risk

Business environments are often characterized by uncertainty and changing conditions. Data and information provide valuable insights that help organizations understand potential risks and opportunities. Reliable information reduces uncertainty by providing a factual basis for decisions. This enables businesses to anticipate challenges and develop appropriate risk management strategies.

  • Improves Customer Understanding

Data and information help organizations gain a deeper understanding of customer needs, preferences, expectations, and behavior. This understanding enables businesses to improve products, services, and customer experiences. Better knowledge of customers contributes to stronger relationships, increased satisfaction, and long-term business success.

  • Supports Strategic Management

Strategic management depends heavily on accurate and timely information. Organizations use data to analyze market conditions, evaluate competitors, identify opportunities, and assess organizational performance. Information supports the development and implementation of long-term strategies that help businesses achieve sustainable growth and competitive advantage.

  • Enhances Communication

Data and information facilitate effective communication within an organization. Information sharing ensures that employees, managers, and stakeholders have access to the knowledge required for their responsibilities. Clear communication improves coordination, collaboration, and decision-making across different departments and levels of management.

  • Creates Competitive Advantage

Organizations that effectively collect, manage, and analyze data can respond more quickly to market changes and business opportunities. Information helps businesses understand industry trends, improve efficiency, and develop innovative strategies. The ability to use data effectively provides a significant competitive advantage and contributes to long-term organizational success.

Challenges in Managing Data and Information

  • Poor Data Quality

Poor data quality is one of the most significant challenges in managing data and information. Data may contain errors, duplicate entries, missing values, inconsistencies, or outdated records. When poor-quality data is used for analysis, it produces inaccurate information and misleading conclusions. This can negatively affect business decisions and operational performance. Organizations must establish data validation, cleansing, and quality-control procedures to maintain reliable data. Ensuring high-quality data is essential because accurate information forms the foundation of effective Business Analytics and decision-making.

  • Large Volume of Data

Modern organizations generate enormous amounts of data from transactions, social media, websites, sensors, and business operations. Managing such large volumes of data can be difficult because it requires significant storage capacity, processing power, and analytical capabilities. As data grows continuously, organizations face challenges in organizing, accessing, and analyzing it efficiently. Without proper management systems, valuable information may become difficult to locate and use. Businesses must invest in advanced technologies and data management practices to handle large datasets effectively.

  • Data Security and Privacy Risks

Data and information often contain sensitive details related to customers, employees, finances, and business operations. Unauthorized access, cyberattacks, data breaches, and privacy violations can result in financial losses and reputational damage. Organizations must implement strong security measures, encryption techniques, and access controls to protect valuable information. Compliance with data protection regulations is also essential. Managing security and privacy risks has become increasingly important as businesses rely more on digital systems and cloud technologies.

  • Data Integration Issues

Organizations collect data from multiple internal and external sources, including ERP systems, CRM systems, websites, suppliers, and social media platforms. Integrating these diverse data sources into a single system can be challenging due to differences in formats, structures, and standards. Poor integration may result in fragmented information and inconsistent analysis. Effective data integration is necessary to create a unified view of business operations and improve decision-making.

  • Data Storage Challenges

As data volumes increase, organizations face difficulties in storing information efficiently and securely. Traditional storage systems may become insufficient for handling massive datasets. Businesses must invest in modern storage solutions such as cloud computing, data warehouses, and data lakes. Proper storage management ensures data availability, accessibility, and protection. Failure to manage storage effectively can result in increased costs and reduced operational efficiency.

  • Maintaining Data Accuracy

Data accuracy is essential for generating reliable information. However, maintaining accuracy can be difficult because data is constantly updated, transferred, and modified. Human errors during data entry, system failures, and outdated records can reduce accuracy. Organizations need regular audits, validation processes, and quality checks to ensure that data remains correct and current. Accurate data improves trust in information and supports better decision-making.

  • Rapid Data Growth

The amount of data generated worldwide is growing at an unprecedented rate. Businesses must continuously adapt their infrastructure, technologies, and processes to manage this growth. Rapid data expansion increases storage, processing, and maintenance requirements. Organizations that fail to scale their systems effectively may experience performance issues and reduced analytical capabilities. Managing rapidly growing datasets requires strategic planning and investment in scalable technologies.

  • Difficulty in Retrieving Information

Collecting and storing data is not enough; organizations must also retrieve information quickly and efficiently when needed. Poor organization, lack of indexing, and inadequate search capabilities can make information retrieval difficult. Delays in accessing information may affect decision-making and operational performance. Effective information management systems help users locate relevant information accurately and promptly.

  • Technological Complexity

Modern data management involves advanced technologies such as Big Data platforms, cloud computing, Artificial Intelligence, Machine Learning, and Business Intelligence tools. Managing these technologies requires technical expertise and continuous updates. Organizations may face difficulties implementing, maintaining, and integrating complex systems. Lack of technical knowledge can reduce the effectiveness of data and information management initiatives.

Data Summarization, Need

Data Summarization is the process of condensing a large dataset into a simpler, more understandable form, highlighting key information. It involves organizing and presenting data through descriptive measures such as mean, median, mode, range, and standard deviation, as well as graphical representations like charts, tables, and graphs. Data summarization provides insights into central tendency, dispersion, and data distribution patterns. Techniques like frequency distributions and cross-tabulations help identify relationships and trends within data. This concept is crucial for effective decision-making in business, enabling managers to interpret data quickly, draw conclusions, and make informed decisions without delving into raw datasets.

Need of Data Summarization:

  • Simplification of Large Datasets

In today’s data-driven world, businesses and organizations deal with massive amounts of data. Raw data is often overwhelming and challenging to analyze. Summarization condenses this complexity into manageable information, enabling users to focus on significant trends and patterns.

  • Facilitates Quick Decision-Making

Managers and decision-makers require timely insights to make informed choices. Summarized data provides a snapshot of key information, enabling faster evaluation of situations and reducing the time needed for data interpretation.

  • Identifying Trends and Patterns

Through summarization techniques such as graphical representations and descriptive statistics, businesses can identify trends and correlations. For instance, sales data can reveal seasonal trends or consumer preferences, aiding in strategic planning.

  • Improves Communication and Reporting

Effective communication of data insights to stakeholders, including team members, investors, and clients, is critical. Summarized data presented in charts, tables, or dashboards makes complex information accessible and comprehensible to a non-technical audience.

  • Supports Decision Accuracy

Summarized data reduces the risk of errors in interpretation by providing clear and focused insights. This accuracy is vital for making evidence-based decisions, minimizing the chances of bias or misjudgment.

  • Enhances Data Comparability

Data summarization facilitates comparisons between different datasets, time periods, or groups. For example, comparing summarized financial performance metrics across quarters allows organizations to assess growth and address underperformance.

  • Reduces Storage and Processing Costs

Storing and processing raw data can be resource-intensive. Summarized data requires less storage space and computational power, making it a cost-effective approach for data management, especially in large-scale systems.

  • Aids in Forecasting and Predictive Analysis

Summarized data serves as the foundation for predictive models and forecasting. By analyzing summarized historical data, organizations can anticipate future outcomes, such as demand trends, market fluctuations, or financial projections.

P2 Business Statistics BBA NEP 2024-25 1st Semester Notes

Unit 1
Data Summarization VIEW
Significance of Statistics in Business Decision Making VIEW
Data and Information VIEW
Classification of Data VIEW
Tabulation of Data VIEW
Frequency Distribution VIEW
Measures of Central Tendency: VIEW
Mean VIEW
Median VIEW
Mode VIEW
Measures of Dispersion: VIEW
Range VIEW
Mean Deviation and Standard Deviation VIEW
Unit 2
Correlation, Significance of Correlation, Types of Correlation VIEW
Scatter Diagram Method VIEW
Karl Pearson Coefficient of Correlation and Spearman Rank Correlation Coefficient VIEW
Regression Introduction VIEW
Regression Lines and Equations and Regression Coefficients VIEW
Unit 3
Probability: Concepts in Probability, Laws of Probability, Sample Space, Independent Events, Mutually Exclusive Events VIEW
Conditional Probability VIEW
Bayes’ Theorem VIEW
Theoretical Probability Distributions:
Binominal Distribution VIEW
Poisson Distribution VIEW
Normal Distribution VIEW
Unit 4
Sampling Distributions and Significance VIEW
Hypothesis Testing, Concept and Formulation, Types VIEW
Hypothesis Testing Process VIEW
Z-Test, T-Test VIEW
Simple Hypothesis Testing Problems
Type-I and Type-II Errors VIEW

Non-Parametric Tests, Importance, Types, Formulation

Non-parametric tests, also known as distribution-free tests, are statistical techniques that do not assume a specific underlying probability distribution (such as normal distribution) for the population from which the sample is drawn. They are primarily used when data is ordinal, nominal, or violates the assumptions of parametric tests like normality and homogeneity of variance. These tests rely on ranks, signs, or frequencies rather than actual numerical values. Common examples include Chi-Square, Mann-Whitney U, Wilcoxon Signed-Rank, and Kruskal-Wallis tests. They are particularly valuable in business research when dealing with small sample sizes, skewed data, or subjective attitudinal measurements that lack interval properties.

Importance of Non-Parametric Tests:

1. Suitable for Non-Normal Data

Non-parametric tests are important because they can be used when data do not follow a normal distribution. Many statistical tests require assumptions about the distribution of data, but real world business and social science data may be skewed or irregular. Non parametric methods provide an alternative when these assumptions are not satisfied. For example, customer satisfaction scores or income data may not be normally distributed. Tests such as the Mann Whitney U test and Kruskal Wallis test can be used in such situations. Therefore, non parametric tests provide flexibility when the normality assumption required by parametric tests is not met.

2. Useful for Ordinal Data

Non-parametric tests are particularly useful when research data are measured using ordinal scales. Ordinal data provide information about ranking or order but do not necessarily have equal differences between categories. Examples include satisfaction levels, preference rankings and levels of agreement. Tests such as the Mann Whitney U test, Wilcoxon signed rank test and Kruskal Wallis test can analyse such data. This makes non parametric methods highly relevant in business and social science research, where Likert type and ranking data are commonly collected. Thus, they allow researchers to analyse ordered information without requiring strong assumptions about numerical distances.

3. Useful for Small Samples

Non-parametric tests can be useful when the sample size is relatively small. With small samples, it may be difficult to reliably determine whether data satisfy assumptions such as normality. Non parametric methods generally require fewer distributional assumptions and can therefore provide practical alternatives. For example, a researcher studying customer satisfaction among a small group of specialised customers may use an appropriate non parametric test to compare responses. However, the suitability of a test still depends on the research design and data characteristics. Thus, non parametric tests provide researchers with useful analytical options when collecting data from smaller samples.

4. Fewer Statistical Assumptions

A major importance of non parametric tests is that they generally require fewer assumptions than many parametric tests. Parametric tests often require assumptions concerning normality, variance and measurement levels. Non parametric methods are generally less dependent on these distributional assumptions. This makes them suitable for situations where the characteristics of the data do not meet the requirements of parametric techniques. For example, when the data are highly skewed or measured on an ordinal scale, a non parametric test may be more appropriate. Therefore, fewer assumptions make non parametric tests flexible tools for analysing diverse research data.

5. Suitable for Ranked Data

Non-parametric tests can analyse data that are expressed in ranks rather than exact numerical measurements. Ranking is common in business research when respondents are asked to rank products, brands, preferences or alternatives. For example, customers may rank five brands according to their preference. Tests such as Spearman’s rank correlation can examine relationships between ranked variables. Since the actual numerical distance between ranks is not necessarily equal, parametric methods may not always be appropriate. Non parametric techniques work effectively with such information. Therefore, they are important for research involving preferences, rankings and other ordered observations.

6. Useful for Categorical and Qualitative Information

Non-parametric methods are useful when research involves categorical information that cannot be appropriately analysed using conventional parametric procedures. For example, researchers may study relationships between gender and product preference or employment status and training participation. The Chi Square test is commonly used to examine associations between categorical variables. These methods allow researchers to analyse frequency based information and determine whether observed patterns are statistically significant. This is particularly valuable in social science and business research, where many variables are collected in categories. Therefore, non parametric tests provide suitable statistical methods for analysing categorical research data.

7. Useful in Social Science Research

Non-parametric tests are widely useful in social science and business research because data often involve attitudes, opinions, preferences, rankings and categories. Such data may not satisfy the assumptions required for parametric tests. Researchers can use tests such as Chi Square, Mann Whitney U, Wilcoxon signed rank, Kruskal Wallis and Spearman’s rank correlation according to the research situation. For example, customer satisfaction responses may be analysed using an appropriate non parametric technique. These methods allow researchers to examine relationships and differences without requiring strict distributional assumptions. Thus, they provide practical statistical tools for analysing real world social and business data.

8. Provides Alternative to Parametric Tests

Non-parametric tests provide alternatives when parametric tests cannot be appropriately applied. If data violate assumptions such as normality or involve ordinal measurements, researchers can select suitable non parametric methods. For example, the Mann Whitney U test can serve as an alternative to the independent samples t test under appropriate conditions, while the Kruskal Wallis test can be used as an alternative to one way ANOVA in suitable situations. The choice should depend on the research design and characteristics of the data. Therefore, non parametric tests expand the range of statistical methods available to researchers.

9. Less Affected by Extreme Values

Non-parametric tests often rely on ranks rather than directly using the actual numerical values of observations. As a result, they may be less influenced by extreme values or outliers than some parametric methods. For example, income data can contain a small number of extremely high observations that may strongly affect averages. A rank based non parametric method can reduce the influence of such extreme observations. However, researchers should still identify and understand outliers rather than automatically ignoring them. Thus, non parametric tests can provide more robust analysis when research data contain unusual or highly extreme observations.

10. Easy to Apply in Practical Research

Non-parametric tests are useful in practical research because many real world datasets do not perfectly satisfy the assumptions of parametric methods. Researchers can select appropriate tests based on the type of data, research objective and study design. Many non parametric procedures are straightforward to perform using statistical software. For example, Chi Square can examine associations between categorical variables, while Mann Whitney U can compare two independent groups using ranked information. Their flexibility makes them useful for students, researchers and business professionals. Therefore, non parametric tests provide practical and accessible methods for analysing a wide variety of research data.

Types of Non-Parametric Tests:

Non parametric tests are statistical techniques that do not require the data to follow a specific probability distribution such as the normal distribution. They are particularly useful for ordinal, nominal, ranked, skewed or small sample data. In business and social science research, these tests are commonly used to examine differences, relationships and associations between variables. The major non parametric tests include Chi Square Test, Mann Whitney U Test, Wilcoxon Signed Rank Test, Kruskal Wallis Test, Friedman Test and Spearman Rank Correlation.

1. Chi-Square Test

The Chi Square Test is a non parametric statistical test used mainly to examine relationships or associations between categorical variables. It compares the observed frequencies with the frequencies that would be expected if there were no relationship between the variables. For example, a researcher may examine whether gender is associated with preference for a particular product. The test is commonly used for nominal data and frequency based information. It can also be used to test goodness of fit in appropriate situations. The researcher interprets the calculated test statistic and p value to determine statistical significance. Thus, Chi Square is widely used for analysing categorical data.

2. Mann Whitney U-Test

The Mann Whitney U Test is a non parametric test used to compare two independent groups when the data are ordinal, ranked or do not satisfy the assumptions required for an independent samples t test. It examines whether the distributions or rankings of two groups differ significantly. For example, a researcher may compare customer satisfaction ratings between customers of two different brands. The test converts observations into ranks and compares the groups based on these ranks. It is particularly useful for small samples and non normal data. Therefore, the Mann Whitney U-Test provides a useful alternative for comparing two independent groups.

3. Wilcoxon Signed Rank Test

The Wilcoxon Signed Rank Test is a non parametric test used to compare two related or paired sets of observations. It is commonly applied when the same participants are measured before and after an intervention or when observations are naturally matched. For example, a researcher may compare employee performance scores before and after a training programme. The test considers the direction and magnitude of differences between paired observations using ranks. It is commonly used when the assumptions of the paired samples t test are not satisfied or when data are ordinal. Thus, the Wilcoxon Signed Rank Test is useful for analysing changes in related observations.

4. Kruskal Wallis Test

The Kruskal Wallis Test is a non parametric test used to compare three or more independent groups. It is generally considered an alternative to one way ANOVA when data are ordinal, non normal or do not satisfy the assumptions of parametric analysis. The test ranks all observations and determines whether the groups differ significantly in their distributions or central tendency. For example, a researcher may compare customer satisfaction among customers using three different brands. If the test indicates a significant difference, further analysis may be required to identify which groups differ. Therefore, the Kruskal Wallis Test is useful for comparing multiple independent groups.

5. Friedman Test

The Friedman Test is a non parametric test used to compare three or more related or matched groups. It is commonly used when the same respondents provide ratings for several conditions, products or time periods. For example, customers may be asked to rate three different brands on satisfaction, and the researcher wants to determine whether their ratings differ significantly. The test ranks observations within each respondent and compares the resulting rankings across conditions. It is considered a non parametric alternative to repeated measures ANOVA when appropriate assumptions are not satisfied. Thus, the Friedman Test is useful for analysing related samples involving ordinal or ranked data.

6. Spearman Rank Correlation

Spearman Rank Correlation is a non parametric method used to measure the strength and direction of the relationship between two variables based on their ranks. It is suitable for ordinal data or numerical data that do not meet the assumptions required for Pearson correlation. The coefficient generally ranges from −1 to +1. A positive value indicates that the variables tend to increase together, while a negative value indicates an opposite relationship. For example, a researcher may examine the relationship between employee motivation ranking and job performance ranking. Therefore, Spearman Rank Correlation is useful for studying associations between ranked or non normally distributed variables.

Formulation of Null and Alternative Hypotheses:

Hypothesis formulation is the process of developing a clear and testable statement about the expected relationship, difference or effect between variables. In research, two major hypotheses are generally formulated: the Null Hypothesis (H₀) and the Alternative Hypothesis (H₁ or Hₐ). The null hypothesis assumes that there is no significant relationship, difference or effect, while the alternative hypothesis suggests that a significant relationship, difference or effect exists. Hypotheses are developed from the research problem, objectives, theories and previous studies. Proper formulation helps researchers conduct statistical tests and make objective decisions based on collected data.

1. Null Hypothesis (H₀)

The null hypothesis states that there is no significant relationship, difference or effect between the variables being studied. It represents the position that any observed difference or relationship in the sample may have occurred due to chance. For example, H₀: There is no significant relationship between employee training and employee performance. Statistical testing is generally conducted by examining whether sufficient evidence exists to reject the null hypothesis. If the evidence is insufficient, the researcher fails to reject H₀. The null hypothesis provides an objective basis for statistical testing and helps researchers avoid drawing conclusions merely from observed differences in sample data.

2. Alternative Hypothesis (H₁)

The alternative hypothesis states that a significant relationship, difference or effect exists between the variables under investigation. It represents the researcher’s expectation or the possibility that the null hypothesis is not true. For example, H₁: There is a significant relationship between employee training and employee performance. The alternative hypothesis may be directional or non directional. A directional hypothesis specifies the expected direction, such as a positive or negative relationship. A non directional hypothesis only states that a relationship or difference exists. Therefore, the alternative hypothesis provides a testable statement about the expected outcome of the research study.

3. Directional Hypothesis

A directional hypothesis specifies not only that a relationship or difference exists but also indicates its expected direction. It predicts whether one variable will increase or decrease in relation to another variable. For example, H₁: Employee training has a positive effect on employee performance. Another example is, H₁: Higher advertising expenditure increases sales. Directional hypotheses are generally developed when previous research or theory provides sufficient evidence about the expected direction of the relationship. They help researchers conduct focused statistical testing. Therefore, a directional hypothesis provides more specific information than a general statement about the existence of a relationship.

4. Non-Directional Hypothesis

A non directional hypothesis states that a significant relationship or difference exists between variables but does not specify its direction. It does not predict whether the relationship will be positive or negative. For example, H₁: There is a significant relationship between employee motivation and job performance. The actual relationship may be positive or negative, but the hypothesis only predicts that some relationship exists. Non directional hypotheses are useful when previous research does not provide sufficient evidence to predict the direction of the relationship. Therefore, they provide flexibility while still allowing the researcher to statistically test whether a significant relationship or difference exists.

Normal Distribution: Importance, Central Limit Theorem

Normal distribution, or the Gaussian distribution, is a fundamental probability distribution that describes how data values are distributed symmetrically around a mean. Its graph forms a bell-shaped curve, with most data points clustering near the mean and fewer occurring as they deviate further. The curve is defined by two parameters: the mean (μ) and the standard deviation (σ), which determine its center and spread. Normal distribution is widely used in statistics, natural sciences, and social sciences for analysis and inference.

The general form of its probability density function is:

The parameter μ is the mean or expectation of the distribution (and also its median and mode), while the parameter σ is its standard deviation. The variance of the distribution is σ^2. A random variable with a Gaussian distribution is said to be normally distributed, and is called a normal deviate.

Normal distributions are important in statistics and are often used in the natural and social sciences to represent real-valued random variables whose distributions are not known. Their importance is partly due to the central limit theorem. It states that, under some conditions, the average of many samples (observations) of a random variable with finite mean and variance is itself a random variable whose distribution converges to a normal distribution as the number of samples increases. Therefore, physical quantities that are expected to be the sum of many independent processes, such as measurement errors, often have distributions that are nearly normal.

A normal distribution is sometimes informally called a bell curve. However, many other distributions are bell-shaped (such as the Cauchy, Student’s t, and logistic distributions).

Importance of Normal Distribution:

  1. Foundation of Statistical Inference

The normal distribution is central to statistical inference. Many parametric tests, such as t-tests and ANOVA, are based on the assumption that the data follows a normal distribution. This simplifies hypothesis testing, confidence interval estimation, and other analytical procedures.

  1. Real-Life Data Approximation

Many natural phenomena and datasets, such as heights, weights, IQ scores, and measurement errors, tend to follow a normal distribution. This makes it a practical and realistic model for analyzing real-world data, simplifying interpretation and analysis.

  1. Basis for Central Limit Theorem (CLT)

The normal distribution is critical in understanding the Central Limit Theorem, which states that the sampling distribution of the sample mean approaches a normal distribution as the sample size increases, regardless of the population’s actual distribution. This enables statisticians to make predictions and draw conclusions from sample data.

  1. Application in Quality Control

In industries, normal distribution is widely used in quality control and process optimization. Control charts and Six Sigma methodologies assume normality to monitor processes and identify deviations or defects effectively.

  1. Probability Calculations

The normal distribution allows for the easy calculation of probabilities for different scenarios. Its standardized form, the z-score, simplifies these calculations, making it easier to determine how data points relate to the overall distribution.

  1. Modeling Financial and Economic Data

In finance and economics, normal distribution is used to model returns, risks, and forecasts. Although real-world data often exhibit deviations, normal distribution serves as a baseline for constructing more complex models.

Central limit theorem

In probability theory, the central limit theorem (CLT) establishes that, in many situations, when independent random variables are added, their properly normalized sum tends toward a normal distribution (informally a bell curve) even if the original variables themselves are not normally distributed. The theorem is a key concept in probability theory because it implies that probabilistic and statistical methods that work for normal distributions can be applicable to many problems involving other types of distributions. This theorem has seen many changes during the formal development of probability theory. Previous versions of the theorem date back to 1810, but in its modern general form, this fundamental result in probability theory was precisely stated as late as 1920, thereby serving as a bridge between classical and modern probability theory.

Characteristics Fitting a Normal Distribution

Poisson Distribution: Importance Conditions Constants, Fitting of Poisson Distribution

Poisson distribution is a probability distribution used to model the number of events occurring within a fixed interval of time, space, or other dimensions, given that these events occur independently and at a constant average rate.

Importance

  1. Modeling Rare Events: Used to model the probability of rare events, such as accidents, machine failures, or phone call arrivals.
  2. Applications in Various Fields: Applicable in business, biology, telecommunications, and reliability engineering.
  3. Simplifies Complex Processes: Helps analyze situations with numerous trials and low probability of success per trial.
  4. Foundation for Queuing Theory: Forms the basis for queuing models used in service and manufacturing industries.
  5. Approximation of Binomial Distribution: When the number of trials is large, and the probability of success is small, Poisson distribution approximates the binomial distribution.

Conditions for Poisson Distribution

  1. Independence: Events must occur independently of each other.
  2. Constant Rate: The average rate (λ) of occurrence is constant over time or space.
  3. Non-Simultaneous Events: Two events cannot occur simultaneously within the defined interval.
  4. Fixed Interval: The observation is within a fixed time, space, or other defined intervals.

Constants

  1. Mean (λ): Represents the expected number of events in the interval.
  2. Variance (λ): Equal to the mean, reflecting the distribution’s spread.
  3. Skewness: The distribution is skewed to the right when λ is small and becomes symmetric as λ increases.
  4. Probability Mass Function (PMF): P(X = k) = [e^−λ*λ^k] / k!, Where is the number of occurrences, is the base of the natural logarithm, and λ is the mean.

Fitting of Poisson Distribution

When a Poisson distribution is to be fitted to an observed data the following procedure is adopted:

Binomial Distribution: Importance Conditions, Constants

The binomial distribution is a probability distribution that summarizes the likelihood that a value will take one of two independent values under a given set of parameters or assumptions. The underlying assumptions of the binomial distribution are that there is only one outcome for each trial, that each trial has the same probability of success, and that each trial is mutually exclusive, or independent of each other.

In probability theory and statistics, the binomial distribution with parameters n and p is the discrete probability distribution of the number of successes in a sequence of n independent experiments, each asking a yes, no question, and each with its own Boolean-valued outcome: success (with probability p) or failure (with probability q = 1 − p). A single success/failure experiment is also called a Bernoulli trial or Bernoulli experiment, and a sequence of outcomes is called a Bernoulli process; for a single trial, i.e., n = 1, the binomial distribution is a Bernoulli distribution. The binomial distribution is the basis for the popular binomial test of statistical significance.

The binomial distribution is frequently used to model the number of successes in a sample of size n drawn with replacement from a population of size N. If the sampling is carried out without replacement, the draws are not independent and so the resulting distribution is a hypergeometric distribution, not a binomial one. However, for N much larger than n, the binomial distribution remains a good approximation, and is widely used

The binomial distribution is a common discrete distribution used in statistics, as opposed to a continuous distribution, such as the normal distribution. This is because the binomial distribution only counts two states, typically represented as 1 (for a success) or 0 (for a failure) given a number of trials in the data. The binomial distribution, therefore, represents the probability for x successes in n trials, given a success probability p for each trial.

Binomial distribution summarizes the number of trials, or observations when each trial has the same probability of attaining one particular value. The binomial distribution determines the probability of observing a specified number of successful outcomes in a specified number of trials.

The binomial distribution is often used in social science statistics as a building block for models for dichotomous outcome variables, like whether a Republican or Democrat will win an upcoming election or whether an individual will die within a specified period of time, etc.

Importance

For example, adults with allergies might report relief with medication or not, children with a bacterial infection might respond to antibiotic therapy or not, adults who suffer a myocardial infarction might survive the heart attack or not, a medical device such as a coronary stent might be successfully implanted or not. These are just a few examples of applications or processes in which the outcome of interest has two possible values (i.e., it is dichotomous). The two outcomes are often labeled “success” and “failure” with success indicating the presence of the outcome of interest. Note, however, that for many medical and public health questions the outcome or event of interest is the occurrence of disease, which is obviously not really a success. Nevertheless, this terminology is typically used when discussing the binomial distribution model. As a result, whenever using the binomial distribution, we must clearly specify which outcome is the “success” and which is the “failure”.

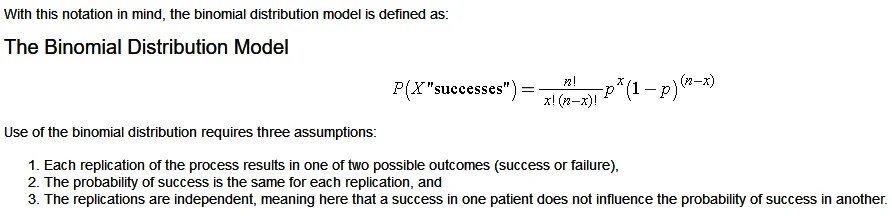
The binomial distribution model allows us to compute the probability of observing a specified number of “successes” when the process is repeated a specific number of times (e.g., in a set of patients) and the outcome for a given patient is either a success or a failure. We must first introduce some notation which is necessary for the binomial distribution model.

First, we let “n” denote the number of observations or the number of times the process is repeated, and “x” denotes the number of “successes” or events of interest occurring during “n” observations. The probability of “success” or occurrence of the outcome of interest is indicated by “p”.

The binomial equation also uses factorials. In mathematics, the factorial of a non-negative integer k is denoted by k!, which is the product of all positive integers less than or equal to k. For example,

  • 4! = 4 x 3 x 2 x 1 = 24,
  • 2! = 2 x 1 = 2,
  • 1!=1.
  • There is one special case, 0! = 1.

Conditions

  • The number of observations n is fixed.
  • Each observation is independent.
  • Each observation represents one of two outcomes (“success” or “failure”).
  • The probability of “success” p is the same for each outcome

Constants

Fitting of Binomial Distribution

Fitting of probability distribution to a series of observed data helps to predict the probability or to forecast the frequency of occurrence of the required variable in a certain desired interval.

To fit any theoretical distribution, one should know its parameters and probability distribution. Parameters of Binomial distribution are n and p. Once p and n are known, binomial probabilities for different random events and the corresponding expected frequencies can be computed. From the given data we can get n by inspection. For binomial distribution, we know that mean is equal to np hence we can estimate p as = mean/n. Thus, with these n and p one can fit the binomial distribution.

There are many probability distributions of which some can be fitted more closely to the observed frequency of the data than others, depending on the characteristics of the variables. Therefore, one needs to select a distribution that suits the data well.

Constructing Index Numbers

An index number is a statistical tool used to measure changes in the value of money. It indicates the average price level of a selected group of commodities at a specific point in time compared to the average price level of the same group at another time.

It represents the average of various items expressed in different units. Additionally, an index number reflects the overall increase or decrease in the average prices of the group being studied. For example, if the Consumer Price Index rises from 100 in 1980 to 150 in 1982, it indicates a 50 percent rise in the prices of the commodities included. Furthermore, an index number shows the degree of change in the value of money (or the price level) over time, based on a chosen base year. If the base year is 1970, we can evaluate the change in the average price level for both earlier and later years.

Construction of Index Number:

1. Define the Objective and Scope

The first step in constructing an index number is to define its purpose clearly. The objective may be to measure changes in prices, quantities, or values over time or between regions. This determines whether a price index, quantity index, or value index is required. Additionally, the scope must be outlined—whether it’s for a particular sector (like retail or wholesale prices) or a specific group (such as urban consumers). Defining the objective ensures relevance, appropriate selection of items, and accurate interpretation of the index in practical use.

2. Selection of the Base Year

The base year is the reference year against which changes are compared. It is assigned a value of 100, and all subsequent values are calculated in relation to it. The base year should be a “normal” year—free from major economic disruptions like inflation, war, or natural disasters. A poorly chosen base year may distort the index. Additionally, it should be recent enough to reflect current trends but stable enough to serve as a benchmark. Periodic updating of the base year is essential for long-term accuracy.

3. Selection of Commodities

Next, a representative basket of goods and services must be selected. These commodities should reflect the consumption habits or production patterns of the population or sector under study. Items should be commonly used, available throughout the period, and consistent in quality. Too many items can complicate calculations, while too few may result in an unrepresentative index. For example, the Consumer Price Index includes food, clothing, fuel, and transportation. Proper selection ensures the index accurately reflects real economic conditions and consumer behavior.

4. Collection of Price Data

Prices for the selected commodities must be collected for both the base year and the current year. This data should be gathered from reliable sources such as retail shops, wholesale markets, or government reports. Consistency in quality, unit, and location is crucial to ensure accuracy. Prices may vary by region, seller, or time, so care must be taken to eliminate anomalies. Regular and systematic price collection—monthly or quarterly—is often used in official indices. Errors or inconsistencies in this stage can significantly affect the results.

5. Assigning Weights

Weights represent the relative importance of each commodity in the index. Heavier weights are given to items with a larger share in total expenditure or production. For instance, in a household index, food items may carry more weight than luxury goods. Assigning correct weights helps the index reflect real economic behavior. Weights can be based on surveys, national accounts, or expenditure studies. There are unweighted indices (equal importance to all items) and weighted indices (varying importance), with weighted indices offering greater precision and realism.

6. Selection of the Index Formula

Different formulas are used to calculate the index number. The most common are:

  • Laspeyres’ Index: Uses base year quantities as weights.

  • Paasche’s Index: Uses current year quantities.

  • Fisher’s Ideal Index: Geometric mean of Laspeyres and Paasche indices.

Each formula has its pros and cons. Laspeyres is easier to calculate but may overstate inflation, while Paasche may understate it. Fisher’s index balances both but is more complex. The choice depends on available data and desired accuracy. The selected formula must ensure consistency and logical interpretation.

7. Computation and Interpretation

Once the prices, quantities, weights, and formula are determined, the index number is computed. The resulting figure indicates the level of change compared to the base year. If the index is above 100, it shows a price rise; below 100 indicates a fall. The index is then interpreted in the context of economic conditions and published for use by policymakers, businesses, and researchers. Proper interpretation helps in understanding inflation trends, making wage adjustments, or planning fiscal and monetary policies effectively.

Tests of Adequacy (TRT and FRT)

To ensure the reliability and accuracy of an index number, it must satisfy certain mathematical tests of consistency, known as Tests of Adequacy. The two most important tests are:

Time Reversal Test (TRT):

Time Reversal Test checks the consistency of an index number when time periods are reversed. In other words, if we calculate an index number from year 0 to year 1, and then from year 1 back to year 0, the product of the two indices should be equal to 1 (or 10000 when expressed as percentages).

Mathematical Condition:

P01 × P10 = 1

or

P01 × P10 = 10000

Where:

  • P01 = Price index from base year 0 to current year 1

  • P10 = Price index from current year 1 to base year 0

Interpretation:

This test ensures that the index number gives symmetrical results when the time order of comparison is reversed.

Which Formula Satisfies TRT?

  • Fisher’s Ideal Index satisfies the Time Reversal Test.

  • Laspeyres’ and Paasche’s indices do not satisfy this test.

Factor Reversal Test (FRT):

Factor Reversal Test checks whether the product of the Price Index and the Quantity Index equals the value ratio (i.e., the ratio of total expenditure in the current year to that in the base year).

Mathematical Condition:

P01 × Q01 = ∑P1Q1 / ∑P0Q0

Where:

  • P01 = Price index from base year to current year

  • Q01 = Quantity index from base year to current year

  • ∑P1Q1 = Total value in the current year

  • ∑P0Q0 = Total value in the base year

Interpretation:

This test checks whether the index number captures the combined effect of both price and quantity changes on total value.

Which Formula Satisfies FRT?

  • Fisher’s Ideal Index satisfies the Factor Reversal Test.

  • Laspeyres’ and Paasche’s indices do not satisfy this test.

error: Content is protected !!