Data Tabulation, Meaning, Definition, Characteristics, Principles, Types, Importance and Limitations

Tabulation of data is the systematic presentation of classified data in the form of rows and columns. It is a method of arranging numerical information in a table to make it simple, concise, and easy to understand. After data has been classified, it is organized into tables so that comparisons, analysis, and interpretation can be carried out efficiently. Tabulation helps condense a large volume of information into a compact form and highlights important facts. It serves as a bridge between data collection and statistical analysis, making statistical information more meaningful and useful.

Definition

According to statistical experts, tabulation is the process of presenting classified data systematically in rows and columns to facilitate comparison, analysis, and interpretation.

Characteristics of Tabulation of Data

  • Systematic Presentation

One of the most important characteristics of tabulation is the systematic presentation of data. Tabulation arranges information in rows and columns according to a logical pattern, making it easy to understand and analyze. Raw data collected from various sources is often scattered and difficult to interpret. Through tabulation, this information is organized into a structured format that highlights important facts. A systematic arrangement enables users to locate specific information quickly and reduces confusion. This characteristic improves the overall efficiency of data handling and provides a clear foundation for statistical analysis and business decision-making.

  • Condenses Large Volumes of Data

Tabulation helps condense a large amount of information into a compact and manageable form. Instead of presenting lengthy descriptions or thousands of observations, data is summarized in tables. This reduction in size makes information easier to read and understand. Managers, researchers, and analysts can quickly grasp the essential facts without examining every individual detail. Condensation does not eliminate important information but presents it more efficiently. This characteristic is particularly useful in business and research where large datasets are common. Thus, tabulation simplifies the presentation of extensive information while retaining its significance.

  • Facilitates Comparison

A significant characteristic of tabulation is its ability to facilitate comparison. Data arranged in rows and columns allows users to compare different categories, groups, regions, or time periods easily. For example, a table showing annual sales figures enables quick comparison of performance across years. Such comparisons help identify differences, similarities, strengths, and weaknesses. They also assist managers in evaluating performance and making informed decisions. Without tabulation, comparing large amounts of raw data would be difficult and time-consuming. Therefore, facilitating comparison is one of the most valuable features of tabulated information.

  • Enhances Clarity and Understanding

Tabulation improves the clarity and understanding of statistical information. Raw data often appears complex and confusing, especially when presented in large quantities. By arranging information systematically, tabulation makes data easier to comprehend. Clear headings, rows, and columns help readers interpret information accurately and quickly. This organized presentation reduces the possibility of misunderstanding and enhances communication. Managers, researchers, and policymakers can understand the information without requiring extensive explanations. Therefore, tabulation serves as an effective tool for presenting data in a clear, concise, and understandable manner.

  • Supports Statistical Analysis

Tabulation provides a suitable foundation for statistical analysis. Before statistical measures such as averages, percentages, ratios, and correlations can be calculated, data must be organized systematically. Tabulated data enables researchers to perform these calculations accurately and efficiently. It also simplifies the identification of patterns and relationships within the data. Statistical techniques become more effective when applied to organized information. As a result, tabulation acts as a bridge between data collection and statistical interpretation. This characteristic makes tabulation an essential component of the statistical process in business and research studies.

  • Saves Time and Space

Another important characteristic of tabulation is that it saves both time and space. Large amounts of information can be presented in a relatively small area through tables. Readers can quickly obtain the required information without reading lengthy reports or descriptions. This efficiency is particularly valuable in business environments where timely decisions are important. Tabulated data reduces the effort required for data presentation and analysis. By summarizing information effectively, tabulation helps organizations communicate key facts more efficiently. Consequently, it contributes to improved productivity and better utilization of resources.

  • Reveals Trends and Relationships

Tabulation helps reveal trends, patterns, and relationships that may not be obvious in raw data. By arranging information in a structured format, it becomes easier to identify changes over time, differences between groups, and associations among variables. For example, a sales table may show a consistent increase in revenue over several years. Such observations support forecasting and strategic planning. Managers can use tabulated information to understand market behavior and business performance. Therefore, the ability to highlight trends and relationships is a key characteristic that enhances the analytical value of tabulation.

  • Improves Accuracy and Reliability

Tabulation contributes to the accuracy and reliability of data presentation. The systematic arrangement of information reduces the likelihood of errors and omissions. Tables allow users to verify figures easily and identify inconsistencies if they occur. Proper tabulation also ensures that data is presented consistently, making interpretation more dependable. Accurate presentation is essential because business decisions often rely on statistical information. Errors in data presentation can lead to incorrect conclusions and poor decisions. Therefore, by promoting organized and precise data presentation, tabulation enhances the reliability and credibility of statistical information.

Principles of Tabulation

1. Principle of Simplicity

A table should be simple and easy to understand. Unnecessary details, complex arrangements, and excessive information should be avoided. The objective of tabulation is to simplify data presentation, not to make it more complicated. Simple tables enable readers to grasp information quickly without confusion. The language used in titles, headings, and notes should also be straightforward. Simplicity improves readability and facilitates analysis. Therefore, while preparing a table, only relevant information should be included, ensuring that the table remains clear, concise, and user-friendly for all readers.

2. Principle of Clarity

Clarity is an essential principle of tabulation. Every table should have a clear title, properly labeled rows and columns, and understandable figures. The information presented should not create ambiguity or confusion. Headings should accurately describe the contents of the table, and abbreviations should be avoided unless they are commonly understood. Clear presentation helps readers interpret the data correctly and draw meaningful conclusions. A table lacking clarity may lead to misunderstandings and incorrect analysis. Therefore, ensuring clarity in design and presentation is crucial for the effectiveness of tabulation.

3. Principle of Accuracy

Accuracy is one of the most important principles of tabulation. All figures included in a table must be correct and verified before presentation. Errors in calculations, classification, or data entry can lead to misleading conclusions and poor decision-making. Statistical tables should be prepared carefully to ensure that totals, percentages, and other numerical values are accurate. Consistency in units and measurements should also be maintained. Accurate tables enhance the reliability of information and increase confidence in the analysis. Thus, accuracy is essential for producing trustworthy and meaningful statistical tables.

4. Principle of Proper Title

Every table should have a suitable and self-explanatory title. The title should clearly indicate the subject matter, scope, and purpose of the table. A good title enables readers to understand the contents of the table without needing additional explanations. It should be brief yet comprehensive enough to convey the necessary information. The title is usually placed at the top of the table and serves as its identity. Proper titles improve communication and make statistical information easier to interpret. Therefore, selecting an appropriate title is a fundamental principle of tabulation.

5. Principle of Logical Arrangement

The data within a table should be arranged logically and systematically. Rows and columns should follow a meaningful order, such as alphabetical, chronological, geographical, or numerical arrangement. Logical organization helps readers locate information quickly and understand relationships among data items. Random placement of figures may create confusion and reduce the usefulness of the table. A logical arrangement enhances readability and facilitates comparison and analysis. Therefore, proper sequencing of data is essential for ensuring that a table effectively communicates statistical information to its users.

6. Principle of Comparability

A good table should facilitate easy comparison among different categories, groups, or periods. Similar items should be placed close to each other, and uniform units of measurement should be used throughout the table. Comparative data helps readers identify similarities, differences, and trends. For example, sales figures for multiple years should be presented in adjacent columns to allow direct comparison. The principle of comparability increases the analytical value of tabulated data and supports informed decision-making. Therefore, tables should be designed in a way that promotes meaningful and convenient comparisons.

7. Principle of Completeness

A table should contain all relevant information necessary for understanding the data. Incomplete tables may create confusion and limit the usefulness of the information presented. Important details such as units of measurement, totals, footnotes, and source references should be included wherever necessary. Completeness ensures that readers have access to all essential information needed for interpretation. However, completeness should not result in overcrowding the table with unnecessary details. A balance should be maintained between providing sufficient information and preserving simplicity. Thus, completeness is an important principle of effective tabulation.

8. Principle of Attractiveness

A table should be neat, well-organized, and visually appealing. Attractive presentation encourages readers to examine and understand the information more easily. Proper spacing, alignment, headings, and formatting contribute to the appearance of a table. A cluttered or poorly designed table may discourage readers and reduce the effectiveness of communication. While accuracy and clarity are essential, visual appeal also plays a role in improving readability. Therefore, statistical tables should be designed in a manner that is both functional and aesthetically pleasing, enhancing their overall usefulness and impact.

Parts of a Table

A statistical table is a sjhuystematic arrangement of data in rows and columns designed to present information clearly and concisely. It helps organize large amounts of data, making comparison, analysis, and interpretation easier. Every statistical table consists of several important parts, each serving a specific purpose. These components ensure that the table is complete, accurate, and easy to understand. Understanding the different parts of a table is essential for preparing and interpreting statistical information effectively.

1. Table Number

The table number is a unique identification number assigned to a table. It helps readers locate and refer to a particular table easily, especially in reports, books, research papers, and statistical publications containing multiple tables. Table numbers are usually placed at the top of the table before the title.

Importance

  • Facilitates easy reference.
  • Helps in indexing and organization.
  • Avoids confusion when multiple tables are used.

Example: Sales Performance of XYZ Company During 2024

2. Title

The title is a brief statement that describes the contents of the table. It should clearly indicate what information is presented, including the subject, place, and time period whenever necessary. A good title should be concise, self-explanatory, and informative.

Importance:

  • Provides an immediate understanding of the table.
  • Defines the scope of the data.
  • Helps readers interpret information correctly.

Example: Sales of Electronic Products in India During 2024

3. Headnote

A headnote is an explanatory note placed below the title and above the main body of the table. It provides additional information about units of measurement, definitions, or special conditions related to the data presented.

Importance:

  • Clarifies the meaning of figures.
  • Specifies units and measurements.
  • Prevents misunderstanding of data.

4. Captions (Column Headings)

Captions are the headings placed at the top of columns. They indicate the nature of the information contained in each column and help readers understand the data presented.

Importance:

  • Identifies column contents.
  • Improves clarity and readability.
  • Facilitates comparison among columns.

Example

Year Sales (₹ Lakhs) Profit (₹ Lakhs)

Here, Year, Sales, and Profit are captions.

5. Stubs (Row Headings)

Stubs are the headings placed at the left side of rows. They describe the categories or items represented in each row of the table.

Importance:

  • Identifies row contents.
  • Organizes data systematically.
  • Makes interpretation easier.

Example

Product Sales
Mobile Phones 500
Laptops 300

Here, Mobile Phones and Laptops are listed under the stub column.

6. Body of the Table

The body is the main part of the table containing the actual statistical data. It consists of numerical values or information arranged at the intersection of rows and columns.

Importance:

  • Contains the core information.
  • Provides the basis for analysis and interpretation.
  • Represents the results of classification and tabulation.

Example

Product Sales (Units)
Mobile Phones 1,500
Laptops 800

The figures 1,500 and 800 form the body of the table.

7. Footnote

A footnote is an explanatory remark placed below the table. It provides additional clarification about specific figures, symbols, abbreviations, or exceptional circumstances related to the data.

Importance:

  • Explains special cases.
  • Clarifies symbols and abbreviations.
  • Enhances understanding of the table.

Example

Note: Sales figures exclude export transactions.

8. Source Note

The source note indicates the origin from which the data has been obtained. It is usually placed below the footnote at the bottom of the table.

Importance:

  • Establishes authenticity and credibility.
  • Enables verification of information.
  • Acknowledges the original source.

Example

Source: Annual Report of XYZ Company, 2024.

Illustrative Table Showing All Parts

Sales Performance of XYZ Company During 2024

(Figures in ₹ Lakhs)

Product Category Sales Profit
Mobile Phones 500 120
Laptops 300 80
Tablets 200 50

Note: Figures exclude export sales.

Source: XYZ Company Annual Report, 2024.

Types of Tabulation with Examples

Tabulation refers to the systematic presentation of classified data in rows and columns. Depending on the number of characteristics used for classification, tabulation can be of different types. The various types of tabulation help researchers present data according to the complexity and objectives of the study. Each type serves a specific purpose and facilitates easy analysis, comparison, and interpretation of information.

1. Simple Tabulation (One-Way Tabulation)

Simple tabulation is the simplest form of tabulation in which data is classified according to only one characteristic or attribute. It presents information regarding a single variable and is easy to construct and understand.

Example: Distribution of Employees by Gender

Gender Number of Employees
Male 120
Female 80
Total 200

Explanation: In this table, employees are classified only on the basis of gender. Since only one characteristic is considered, it is called simple or one-way tabulation.

Uses

  • Basic data presentation.
  • Quick understanding of information.
  • Suitable for simple statistical studies.

2. Double Tabulation (Two-Way Tabulation)

Double tabulation presents data according to two characteristics simultaneously. It helps analyze the relationship between two variables and allows more detailed comparisons.

Example: Distribution of Employees by Gender and Area

Gender Urban Rural Total
Male 70 50 120
Female 40 40 80
Total 110 90 200

Explanation: This table classifies employees according to two characteristics:

  • Gender
  • Area of residence

Therefore, it is known as double or two-way tabulation.

Uses

  • Comparative analysis.
  • Studying relationships between two variables.
  • Business and social research.

3. Triple Tabulation (Three-Way Tabulation)

Triple tabulation presents data according to three characteristics at the same time. It provides more detailed information and helps analyze complex relationships among variables.

Example: Distribution of Employees by Gender, Area, and Educational Qualification

Gender Area Graduate Postgraduate Total
Male Urban 40 30 70
Male Rural 35 15 50
Female Urban 25 15 40
Female Rural 30 10 40
Total 130 70 200

Explanation: This table classifies employees based on:

  • Gender
  • Area
  • Educational Qualification

Hence, it is called triple tabulation.

Uses

  • Detailed statistical analysis.
  • Research studies involving multiple variables.
  • Understanding complex relationships.

4. Complex Tabulation (Manifold Tabulation)

Complex tabulation, also known as manifold tabulation, classifies data according to more than three characteristics simultaneously. It provides comprehensive information but can be more difficult to prepare and interpret.

Example: Distribution of Employees by Gender, Area, Education, and Experience

Gender Area Education Experience (Years) Number
Male Urban Graduate 0–5 25
Male Urban Graduate Above 5 15
Female Rural Postgraduate 0–5 10
Female Rural Postgraduate Above 5 8

Explanation: This table includes four characteristics:

  • Gender
  • Area
  • Education
  • Experience

Since more than three variables are involved, it is known as complex or manifold tabulation.

Uses

  • Advanced business research.
  • Market analysis.
  • Detailed demographic studies.

Comparison of Types of Tabulation

Basis Simple Double Triple Complex
Number of Characteristics One Two Three More than Three
Complexity Very Low Moderate High Very High
Ease of Understanding Easy Easy to Moderate Moderate Difficult
Level of Detail Basic Detailed More Detailed Highly Detailed
Use in Research Limited Common Extensive Advanced

Importance of Tabulation of Data

  • Simplifies Complex Data

One of the greatest importance of tabulation is that it simplifies complex and bulky data. Raw statistical information often consists of a large number of observations that are difficult to understand in their original form. Tabulation organizes such information into rows and columns, making it more systematic and manageable. This arrangement helps readers grasp the essential facts quickly without examining every detail. By condensing large volumes of data into a concise format, tabulation improves readability and understanding. Thus, it transforms complicated information into a form that is convenient for analysis and interpretation.

  • Facilitates Easy Comparison

Tabulation enables easy comparison between different groups, categories, regions, or time periods. When data is arranged systematically in a table, similarities and differences become immediately visible. For example, sales figures for different years can be compared easily when presented side by side in columns. Such comparisons help identify trends, performance levels, and variations. Managers and researchers can use these comparisons to evaluate outcomes and make informed decisions. Therefore, one of the major advantages of tabulation is its ability to provide a clear basis for meaningful and accurate comparisons.

  • Assists Statistical Analysis

Tabulated data serves as the foundation for statistical analysis. Statistical measures such as averages, percentages, ratios, correlation, and regression require organized data for accurate calculation. Tabulation presents information in a structured form that facilitates the application of statistical techniques. Researchers can easily locate figures, perform computations, and interpret results. Without tabulation, statistical analysis would be more difficult and time-consuming. This importance makes tabulation an indispensable step in the statistical process. It bridges the gap between data collection and interpretation, allowing meaningful conclusions to be drawn from the information available.

  • Improves Clarity and Understanding

A significant importance of tabulation is that it improves the clarity and understanding of data. Raw information often appears confusing and difficult to interpret. Through tabulation, data is arranged logically with proper headings, rows, and columns, making it easier to comprehend. Readers can quickly identify important facts and relationships without requiring extensive explanations. Clear presentation reduces misunderstandings and improves communication. This characteristic is especially valuable in business reports and research studies where information must be presented to different audiences. Thus, tabulation enhances the effectiveness of statistical communication.

  • Saves Time and Space

Tabulation helps save both time and space in data presentation. A large amount of information can be summarized within a compact table instead of lengthy textual descriptions. Readers can obtain the required information quickly without going through extensive reports. This efficiency is particularly important in business organizations where decisions often need to be made promptly. The concise nature of tabulated data also reduces storage and presentation space. By organizing information in an economical format, tabulation increases productivity and allows users to focus on analysis rather than searching for relevant information.

  • Reveals Trends and Relationships

Tabulation plays a crucial role in identifying trends, patterns, and relationships within data. When information is arranged systematically, changes over time and differences between categories become more noticeable. For example, a table showing annual profits may reveal a consistent upward or downward trend. Such observations help businesses understand performance and predict future developments. Tabulation also highlights relationships among variables, supporting better analysis and interpretation. Therefore, the ability to reveal hidden patterns and trends makes tabulation an important tool for forecasting, planning, and strategic decision-making.

  • Provides a Basis for Graphical Presentation

Another important role of tabulation is that it provides the basis for graphical and diagrammatic presentation of data. Charts, graphs, histograms, and pie diagrams require organized numerical information, which is obtained through tabulation. A properly prepared table ensures accuracy and consistency in graphical representation. Visual presentations derived from tabulated data make information more attractive and easier to understand. They also help communicate statistical findings effectively to a wider audience. Thus, tabulation serves as an essential preliminary step in transforming numerical data into visual formats for presentation and analysis.

  • Supports Decision-Making

One of the most significant importance of tabulation is its contribution to decision-making. Managers, researchers, and policymakers rely on tabulated information to evaluate situations, compare alternatives, and formulate strategies. Organized data provides a clear picture of business performance, market conditions, and operational outcomes. This enables decision-makers to identify opportunities, address problems, and allocate resources efficiently. Since tabulation presents information in a concise and understandable form, it reduces uncertainty and improves the quality of decisions. Therefore, tabulation is an essential tool for effective planning, control, and management in business organizations.

Limitations of Tabulation of Data

  • Loss of Detailed Information

One of the major limitations of tabulation is that it condenses a large amount of data into a summarized form. While summarization improves understanding, it may result in the loss of important details. Individual observations, unique characteristics, and specific facts may not appear in the table. As a result, readers may miss certain aspects of the data that could be significant for deeper analysis. Tabulation focuses on presenting the overall picture rather than individual cases. Therefore, detailed information may be sacrificed for the sake of simplicity and brevity.

  • Cannot Explain Causes

Tabulation presents statistical facts and figures but does not explain the reasons behind them. A table may show an increase or decrease in sales, profits, or production, but it cannot indicate why such changes occurred. The causes and underlying factors require further analysis and interpretation. Therefore, tabulation serves only as a method of presentation and not as a tool for explanation. Decision-makers must use additional statistical techniques and contextual information to understand the causes of observed trends and relationships. This limitation reduces the explanatory power of tabulated data.

  • Requires Skill and Experience

Preparing an effective statistical table requires knowledge, skill, and experience. The compiler must decide how to classify data, arrange rows and columns, and present information clearly. Poorly designed tables may confuse readers and lead to incorrect interpretations. Inaccurate headings, improper classifications, or calculation errors can reduce the usefulness of the table. Therefore, tabulation is not merely a mechanical process; it requires careful planning and expertise. Organizations may need trained personnel to prepare meaningful tables, making the process more demanding and sometimes costly.

  • Possibility of Misinterpretation

Tabulated data may sometimes be misunderstood or misinterpreted by readers. Individuals who lack statistical knowledge may draw incorrect conclusions from the figures presented. Complex tables containing numerous rows, columns, and classifications can be particularly difficult to understand. If headings, notes, or classifications are unclear, users may interpret the information incorrectly. Such misunderstandings can lead to poor decisions and inaccurate judgments. Therefore, although tabulation improves organization, it does not guarantee correct interpretation. Proper explanation and statistical literacy are often required to understand tabulated information accurately.

  • Not Suitable for Qualitative Information

Tabulation is primarily designed for presenting numerical and measurable information. Certain qualitative data, such as opinions, emotions, attitudes, and experiences, cannot always be effectively represented in tables. Although some qualitative information can be categorized, the richness and complexity of such data may be lost during tabulation. Descriptive information often requires narrative explanations rather than numerical presentation. Consequently, tabulation has limited usefulness when dealing with highly qualitative subjects. This restriction reduces its applicability in studies where non-numerical information plays a major role in analysis.

  • Oversimplification of Data

Another limitation of tabulation is that it may oversimplify complex information. To make data concise and manageable, details are grouped into categories and summarized. However, excessive simplification can hide important variations and relationships within the data. Readers may focus only on summarized figures and overlook significant differences among observations. This can result in incomplete understanding and inaccurate conclusions. While simplification is one of the strengths of tabulation, it can become a weakness when important information is sacrificed. Therefore, a balance must be maintained between simplicity and completeness.

  • Time-Consuming Preparation

Although tabulated data saves time during analysis, the preparation of statistical tables can itself be time-consuming. Data must first be collected, classified, verified, and organized before being arranged into rows and columns. Large datasets may require extensive effort to ensure accuracy and consistency. Complex tables involving multiple variables require careful planning and formatting. The preparation process may also involve calculations, checking totals, and adding explanatory notes. Therefore, creating effective statistical tables can demand considerable time and resources, especially in large-scale business and research projects.

  • Limited Analytical Capability

Tabulation is mainly a method of data presentation and has limited analytical capability. While tables help organize and summarize information, they do not perform statistical analysis by themselves. Additional techniques such as averages, correlation, regression, and graphical analysis are required to derive deeper insights from the data. A table can present facts but cannot automatically reveal relationships, causes, or future trends. Therefore, tabulation should be viewed as a preliminary step in the statistical process rather than a complete analytical tool. Its usefulness depends on subsequent analysis and interpretation.

Mean (AM, Weighted, Combined)

Arithmetic Mean

The arithmetic mean,’ mean or average is calculated by summ­ing all the individual observations or items of a sample and divid­ing this sum by the number of items in the sample. For example, as the result of a gas analysis in a respirometer an investigator obtains the following four readings of oxygen percentages:

14.9
10.8
12.3
23.3
Sum = 61.3

He calculates the mean oxygen percentage as the sum of the four items divided by the number of items here, by four. Thus, the average oxygen percentage is

Mean = 61.3 / 4 =15.325%

Calculating a mean presents us with the opportunity for learning statistical symbolism. An individual observation is symbo­lized by Yi, which stands for the ith observation in the sample. Four observations could be written symbolically as Yi, Y2, Y3, Y4.

We shall define n, the sample size, as the number of items in a sample. In this particular instance, the sample size n is 4. Thus, in a large sample, we can symbolize the array from the first to the nth item as follows: Y1, Y2…, Yn. When we wish to sum items, we use the following notation:

The capital Greek sigma, Ʃ, simply means the sum of items indica­ted. The i = 1 means that the items should be summed, starting with the first one, and ending with the nth one as indicated by the i = n above the Ʃ. The subscript and superscript are necessary to indicate how many items should be summed. Below are seen increasing simplifications of the complete notation shown at the extreme left:

Properties of Arithmetic Mean:

  1. The sum of deviations of the items from the arithmetic mean is always zero i.e.

∑(X–X) =0.

  1. The Sum of the squared deviations of the items from A.M. is minimum, which is less than the sum of the squared deviations of the items from any other values.
  2. If each item in the series is replaced by the mean, then the sum of these substitutions will be equal to the sum of the individual items.                       

Merits of A.M:

  1. It is simple to understand and easy to calculate.
  2. It is affected by the value of every item in the series.
  3. It is rigidly defined.
  4. It is capable of further algebraic treatment.
  5. It is calculated value and not based on the position in the series.

Demerits of A.M:

  1. It is affected by extreme items i.e., very small and very large items.
  2. It can hardly be located by inspection.
  3. In some cases A.M. does not represent the actual item. For example, average patients admitted in a hospital is 10.7 per day.
  4. M. is not suitable in extremely asymmetrical distributions.

Weighted Mean

In some cases, you might want a number to have more weight. In that case, you’ll want to find the weighted mean. To find the weighted mean:

  1. Multiply the numbers in your data set by the weights.
  2. Add the results up.

For that set of number above with equal weights (1/5 for each number), the math to find the weighted mean would be:
1(*1/5) + 3(*1/5) + 5(*1/5) + 7(*1/5) + 10(*1/5) = 5.2.

Sample problem: You take three 100-point exams in your statistics class and score 80, 80 and 95. The last exam is much easier than the first two, so your professor has given it less weight. The weights for the three exams are:

  • Exam 1: 40 % of your grade. (Note: 40% as a decimal is .4.)
  • Exam 2: 40 % of your grade.
  • Exam 3: 20 % of your grade.

What is your final weighted average for the class?

  1. Multiply the numbers in your data set by the weights:

    .4(80) = 32

    .4(80) = 32

    .2(95) = 19

  2. Add the numbers up. 32 + 32 + 19 = 83.

The percent weight given to each exam is called a weighting factor.

Weighted Mean Formula

The weighted mean is relatively easy to find. But in some cases the weights might not add up to 1. In those cases, you’ll need to use the weighted mean formula. The only difference between the formula and the steps above is that you divide by the sum of all the weights.

The image above is the technical formula for the weighted mean. In simple terms, the formula can be written as:

Weighted mean = Σwx / Σw

Σ = the sum of (in other words…add them up!).
w = the weights.
x = the value.

To use the formula:

  1. Multiply the numbers in your data set by the weights.
  2. Add the numbers in Step 1 up. Set this number aside for a moment.
  3. Add up all of the weights.
  4. Divide the numbers you found in Step 2 by the number you found in Step 3.

In the sample grades problem above, all of the weights add up to 1 (.4 + .4 + .2) so you would divide your answer (83) by 1:
83 / 1 = 83.

However, let’s say your weighted means added up to 1.2 instead of 1. You’d divide 83 by 1.2 to get:
83 / 1.2 = 69.17.

Combined Mean

A combined mean is a mean of two or more separate groups, and is found by:

  1. Calculating the mean of each group,
  2. Combining the results.

Combined Mean Formula

More formally, a combined mean for two sets can be calculated by the formula :

Where:

  • xa = the mean of the first set,
  • m = the number of items in the first set,
  • xb = the mean of the second set,
  • n = the number of items in the second set,
  • xc the combined mean.

A combined mean is simply a weighted mean, where the weights are the size of each group.

Linear Programming, Concept and Assumptions, Usage in Business Decision Making

Linear programming is a mathematical technique used to determine the most effective solution to a problem by either maximizing or minimizing a linear objective function, subject to a set of constraints. This involves formulating a linear equation to represent the goal, and then finding the optimal values for the decision variables that meet the specified constraints. Applied across various fields like business, economics, engineering, and computer science, linear programming helps optimize resources, costs, and profits. It’s a valuable tool for making well-informed decisions and tackling complex problems, ranging from production scheduling to investment portfolio management.

Assumptions of Linear Programming

  • Linearity:

Both the objective function and the constraints are linear. This means that the relationship between variables is represented by straight-line equations, and there are no interactions or non-linear effects between variables.

  • Additivity:

The contribution of each variable to the objective function and constraints is additive. This implies that the total effect is the sum of the individual effects of each variable.

  • Proportionality:

Changes in the objective function and constraints are directly proportional to changes in the decision variables. For instance, if you double the quantity of a variable, its effect on the outcome is also doubled.

  • Continuity:

Decision variables can take any value within a continuous range, including fractional values. This means that the variables are not restricted to integer values, though integer programming can be used if such constraints are required.

  • Certainty:

All coefficients in the objective function and constraints are known with certainty and remain constant. There is no uncertainty or variation in these parameters.

  • Additivity of Constraints:

The constraints are also linear and additive. This implies that the total effect of the constraints is the sum of the individual constraints.

  • Feasibility:

There exists at least one set of values for the decision variables that satisfies all the constraints. This ensures that a feasible solution to the problem exists.

  • Non-negativity:

The decision variables are non-negative, meaning they cannot take negative values. This is important in practical scenarios where negative quantities do not make sense, such as production levels or resource allocations.

Usage of Linear Programming in Business Decision Making:

  • Resource Allocation:

Businesses often face constraints on resources such as labor, materials, and capital. Linear programming helps in allocating these resources in the most efficient way to maximize profit or minimize costs. For example, a manufacturer might use linear programming to determine the optimal mix of products to produce given constraints on raw materials and production capacity.

  • Production Planning:

Linear programming assists in planning production schedules to optimize output. It helps businesses decide how much of each product to manufacture to meet demand while minimizing production costs. For instance, a company with multiple production lines and varying production costs can use linear programming to balance the load across these lines efficiently.

  • Supply Chain Management:

Businesses use linear programming to optimize their supply chain operations, including transportation, inventory management, and distribution. It can help determine the best routes for shipping goods to minimize transportation costs or the optimal inventory levels to meet demand without overstocking.

  • Portfolio Optimization:

In finance, linear programming is used to create investment portfolios that maximize returns or minimize risk, given certain constraints such as budget limits or risk tolerance. For example, an investor might use linear programming to allocate investments across different assets to achieve the best risk-return trade-off.

  • Workforce Scheduling:

Linear programming can be applied to create efficient work schedules for employees while meeting various constraints such as labor laws, shift requirements, and employee availability. This ensures that staffing levels are optimal for meeting business needs without incurring unnecessary labor costs.

  • Marketing and Sales Optimization:

Businesses use linear programming to optimize marketing and sales strategies. For instance, it can help in deciding the optimal mix of advertising channels to maximize reach and engagement within a given budget.

  • Project Management:

In project management, linear programming can be used to schedule tasks and allocate resources efficiently, ensuring that projects are completed on time and within budget. It helps in identifying the critical path and managing constraints related to resources and deadlines.

  • Cost Minimization:

Linear programming helps in minimizing costs associated with various business operations. For example, it can be used to minimize transportation costs by optimizing delivery routes or to reduce production costs by selecting the most cost-effective combination of inputs.

General Mathematical Form of LPP:

Steps in Solving LPP:

  1. Identify decision variables.

  2. Formulate the objective function.

  3. Set up the constraints.

  4. Represent constraints graphically (for two variables).

  5. Determine the feasible region.

  6. Find the corner points (vertices).

  7. Evaluate the objective function at each corner point.

  8. Choose the point that gives the optimal (maximum or minimum) value.

Baye’s Theorem

Bayes’ Theorem is a way to figure out conditional probability. Conditional probability is the probability of an event happening, given that it has some relationship to one or more other events. For example, your probability of getting a parking space is connected to the time of day you park, where you park, and what conventions are going on at any time. Bayes’ theorem is slightly more nuanced. In a nutshell, it gives you the actual probability of an event given information about tests.

“Events” Are different from “tests.” For example, there is a test for liver disease, but that’s separate from the event of actually having liver disease.

Tests are flawed:

Just because you have a positive test does not mean you actually have the disease. Many tests have a high false positive rate. Rare events tend to have higher false positive rates than more common events. We’re not just talking about medical tests here. For example, spam filtering can have high false positive rates. Bayes’ theorem takes the test results and calculates your real probability that the test has identified the event.

Bayes’ Theorem (also known as Bayes’ rule) is a deceptively simple formula used to calculate conditional probability. The Theorem was named after English mathematician Thomas Bayes (1701-1761). The formal definition for the rule is:

In most cases, you can’t just plug numbers into an equation; You have to figure out what your “tests” and “events” are first. For two events, A and B, Bayes’ theorem allows you to figure out p(A|B) (the probability that event A happened, given that test B was positive) from p(B|A) (the probability that test B happened, given that event A happened). It can be a little tricky to wrap your head around as technically you’re working backwards; you may have to switch your tests and events around, which can get confusing. An example should clarify what I mean by “switch the tests and events around.”

Bayes’ Theorem Example

You might be interested in finding out a patient’s probability of having liver disease if they are an alcoholic. “Being an alcoholic” is the test (kind of like a litmus test) for liver disease.

A could mean the event “Patient has liver disease.” Past data tells you that 10% of patients entering your clinic have liver disease. P(A) = 0.10.

B could mean the litmus test that “Patient is an alcoholic.” Five percent of the clinic’s patients are alcoholics. P(B) = 0.05.

You might also know that among those patients diagnosed with liver disease, 7% are alcoholics. This is your B|A: the probability that a patient is alcoholic, given that they have liver disease, is 7%.

Bayes’ theorem tells you:

P(A|B) = (0.07 * 0.1)/0.05 = 0.14

In other words, if the patient is an alcoholic, their chances of having liver disease is 0.14 (14%). This is a large increase from the 10% suggested by past data. But it’s still unlikely that any particular patient has liver disease.

Conditional Probability, Meaning, Definition, Characteristics, Applications, Advantages and Limitations

Conditional Probability refers to the probability of an event occurring given that another event has already occurred. It measures how the occurrence of one event affects the likelihood of another event. In many real-life situations, events are not independent, and the probability of one event depends on the outcome of another. Conditional probability helps analyze such relationships and provides a more accurate understanding of uncertain situations.

This concept is widely used in business, economics, finance, insurance, medicine, and statistics. It helps organizations make informed decisions by considering available information and understanding how different events are connected.

Definition

Conditional Probability is the probability of an event occurring under the condition that another related event has already taken place.

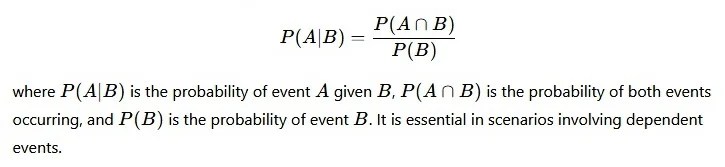
The probability of the occurrence of an event A given that an event B has already occurred is called the conditional probability of A given B:

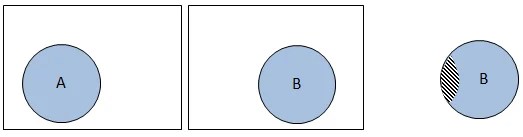
The same is explained in Figure 2.15 using the sample spaces related to the events A and B, assuming that there are few sample points common to these two events. Part 1 of the figure shows the total sample space related to the experiment as in the form of rectangle and the sample space related to the event A as a circle. Similarly part 2 of the figure shows the total sample space and the sample space related to event B. As explained earlier in conditional probability the total sample space is restrained to the sample space that is related to event B (which has already occurred). The same is shown in part 3 of Figure 2.15. Now the sample space for event A (B is the total sample space available) is nothing but the sample points related to event A and falling in the sample space. This is nothing but the intersection of the events A and B and is shown in part 3 of the figure as the hatched area.  

Figure 2.15: Representation of conditional probability using the Venn diagrams

For example, there are 100 trips per day between two places X and Y. Out of these 100 trips 50 are made by car, 25 are made by bus and the other 25 are by local train. Probabilities associated to these modes are 0.5, 0.25, and 0.25, respectively. In transportation engineering both the bus and the local train are considered as public transport so the event space associated to this is the summation of the event spaces associated to bus and local train. Probability of choosing public transportation is 0.5. Now if one is interested in finding the probability of choosing bus given public transportation is chosen the conditional probability is useful in finding that.

Characteristics of Conditional Probability

  • Depends on the Occurrence of Another Event

A key characteristic of conditional probability is that it depends on the occurrence of another event. Unlike simple probability, which measures the likelihood of an event independently, conditional probability considers additional information. The probability of an event changes when another related event has already occurred. For example, the probability of a customer purchasing a printer may increase if the customer has already purchased a laptop. This dependency makes conditional probability highly useful in analyzing real-world situations where events are interconnected and influence one another.

  • Measures Relationships Between Events

Conditional probability helps measure and understand the relationship between two or more events. It shows how the occurrence of one event affects the likelihood of another event occurring. By analyzing these relationships, businesses and researchers can identify patterns and dependencies within data. For example, a retailer may study whether customers who buy one product are more likely to buy another. This characteristic makes conditional probability valuable in market research, risk assessment, and forecasting. It provides insights into event interactions that simple probability cannot capture effectively.

  • Based on Joint Probability

Another important characteristic is that conditional probability relies on joint probability. To calculate conditional probability, the probability of both events occurring together must be known. Joint probability provides the foundation for determining how likely one event is when another has already occurred. This relationship ensures that conditional probability is mathematically consistent and accurate. By using joint probability, analysts can examine event dependencies in a systematic manner. This characteristic highlights the close connection between different probability concepts and their role in statistical analysis.

  • Applicable to Dependent Events

Conditional probability is particularly useful when dealing with dependent events. Dependent events are events where the occurrence of one influences the probability of another. In many business and real-world situations, events are not independent. For example, customer purchasing decisions may depend on previous purchases or promotional offers. Conditional probability helps quantify these dependencies and provides more realistic probability estimates. This characteristic makes it an essential tool for understanding situations where outcomes are interconnected and cannot be analyzed accurately using independent probabilities alone.

  • Provides Updated Probability Estimates

Conditional probability allows probabilities to be updated when new information becomes available. Instead of relying solely on initial estimates, it incorporates additional data to produce revised probability values. This characteristic is especially important in dynamic environments where circumstances change over time. For example, a bank may reassess the probability of loan repayment after receiving updated information about a customer’s financial status. By adjusting probabilities based on current information, conditional probability improves the accuracy and relevance of decision-making and forecasting processes.

  • Supports Better Decision-Making

A significant characteristic of conditional probability is its ability to support informed decision-making. By considering specific conditions and relevant information, it provides more accurate estimates of future outcomes. Managers, investors, and policymakers use conditional probability to evaluate alternatives and assess risks. For example, a business may determine the likelihood of achieving sales targets under certain market conditions. This information enables decision-makers to choose strategies that maximize opportunities and minimize risks. Consequently, conditional probability plays an important role in effective planning and management.

  • Forms the Foundation of Advanced Statistical Methods

Conditional probability serves as the basis for many advanced statistical and analytical techniques. Concepts such as Bayes’ Theorem, predictive modeling, machine learning, and statistical inference all rely on conditional probability principles. By understanding how probabilities change under specific conditions, analysts can develop sophisticated models for forecasting and decision support. This characteristic demonstrates the importance of conditional probability in both theoretical and applied statistics. Its role as a foundational concept makes it essential for advanced research and data analysis across numerous disciplines.

  • Widely Applicable in Real-Life Situations

Conditional probability has broad applicability in business, finance, insurance, healthcare, engineering, and many other fields. Real-world events are often dependent on specific conditions, making conditional probability highly relevant. Businesses use it to analyze customer behavior, assess risks, and forecast demand. Insurance companies use it to estimate claim probabilities based on customer profiles. Financial institutions apply it in credit risk analysis and investment decisions. This widespread applicability demonstrates its practical value and importance. As a result, conditional probability is one of the most widely used concepts in probability and statistics.

Applications of Conditional Probability in Business

  • Customer Purchase Analysis

Conditional probability is widely used to analyze customer purchasing behavior. Businesses calculate the probability that a customer will buy a product given that they have already purchased another related product. For example, a customer who buys a smartphone may also be likely to purchase accessories such as earphones or phone cases. This information helps companies design cross-selling and upselling strategies. By understanding these purchasing relationships, businesses can improve customer experience, increase sales revenue, and develop targeted promotional campaigns. As a result, conditional probability plays a significant role in consumer behavior analysis and marketing decisions.

  • Credit Risk Assessment

Banks and financial institutions use conditional probability to evaluate the likelihood of loan repayment or default under specific conditions. For example, they may calculate the probability that a borrower will default given a low credit score or unstable income. This analysis helps lenders assess creditworthiness and make informed lending decisions. By understanding the relationship between borrower characteristics and repayment behavior, financial institutions can reduce lending risks and improve profitability. Conditional probability therefore serves as an essential tool in credit risk management and financial decision-making.

  • Insurance Underwriting

Insurance companies apply conditional probability to estimate risks associated with policyholders. For example, they may calculate the probability of an accident occurring given a driver’s age, driving history, or vehicle type. These probability estimates help insurers determine premium rates and policy terms. By considering specific conditions, insurance companies can accurately assess risk and avoid financial losses. Conditional probability enables insurers to create fair pricing structures and maintain financial stability. Consequently, it is a critical component of insurance underwriting and risk evaluation processes.

  • Marketing Campaign Evaluation

Businesses use conditional probability to assess the effectiveness of marketing campaigns. They may calculate the probability that a customer makes a purchase after receiving an advertisement or promotional offer. This analysis helps marketers determine which campaigns generate the highest customer response rates. By understanding how promotional activities influence buying behavior, companies can optimize marketing strategies and allocate resources efficiently. Conditional probability also supports customer segmentation and personalized marketing efforts. Therefore, it contributes significantly to improving marketing performance and maximizing returns on investment.

  • Demand Forecasting

Conditional probability plays an important role in demand forecasting by considering specific market conditions. Businesses estimate the probability of future product demand given factors such as seasonal trends, economic conditions, or consumer preferences. This approach provides more accurate demand forecasts than relying solely on historical data. Improved forecasting helps organizations manage inventory, plan production schedules, and allocate resources effectively. By incorporating relevant conditions into predictions, conditional probability reduces uncertainty and enhances operational efficiency. As a result, businesses can better meet customer demand and improve profitability.

  • Quality Control and Production Management

Manufacturing companies use conditional probability to monitor product quality and production efficiency. For example, they may calculate the probability of a product defect occurring given a machine malfunction or a specific production condition. This information helps identify the causes of quality problems and implement corrective measures. By understanding the relationship between production factors and defects, organizations can improve quality standards and reduce waste. Conditional probability therefore supports continuous improvement initiatives and enhances overall manufacturing performance. It is an essential tool for maintaining product reliability and customer satisfaction.

  • Supply Chain and Logistics Management

Conditional probability is valuable in supply chain management because it helps evaluate risks and uncertainties. Businesses may estimate the probability of delayed deliveries given adverse weather conditions, supplier issues, or transportation disruptions. Understanding these probabilities allows organizations to develop contingency plans and improve supply chain resilience. By anticipating potential problems, businesses can reduce operational disruptions and maintain customer service levels. Conditional probability also supports inventory planning and supplier selection. Consequently, it contributes to more efficient and reliable supply chain operations.

  • Investment and Financial Decision-Making

Investors and financial managers use conditional probability to evaluate investment opportunities under specific market conditions. For example, they may calculate the probability of a stock price increase given favorable economic indicators or industry growth. This analysis helps assess investment risks and expected returns. By considering relevant conditions, investors can make more informed decisions and develop effective portfolio strategies. Conditional probability also supports financial forecasting and risk management. Therefore, it plays a crucial role in achieving investment objectives and improving financial performance.

Advantages of Conditional Probability

  • Improves Accuracy of Predictions

One of the major advantages of conditional probability is that it improves the accuracy of predictions by considering additional information. Instead of relying only on general probabilities, it takes into account specific conditions that affect outcomes. For example, a business can estimate future sales based on current market trends and customer behavior. This approach produces more realistic and reliable forecasts. Accurate predictions help organizations reduce uncertainty and make better strategic decisions. As a result, conditional probability is widely used in forecasting, planning, and analytical processes where precise estimates are essential.

  • Supports Better Decision-Making

Conditional probability provides decision-makers with more relevant information by incorporating existing conditions into probability calculations. Managers can evaluate various alternatives and assess the likelihood of different outcomes before making important decisions. For example, a company may determine the probability of a successful product launch given favorable market conditions. This helps in selecting the most effective strategy. By providing a clearer understanding of possible outcomes, conditional probability enables businesses to make informed choices, improve efficiency, and achieve organizational objectives more effectively.

  • Enhances Risk Assessment

Businesses often face risks that depend on specific circumstances. Conditional probability helps assess these risks by measuring the likelihood of an event occurring under particular conditions. For example, banks estimate the probability of loan default based on a borrower’s credit history. This analysis helps organizations identify potential threats and develop risk management strategies. By understanding conditional risks, businesses can take preventive actions and reduce potential losses. Therefore, conditional probability is an important tool for improving risk assessment and ensuring organizational stability.

  • Useful in Customer Behavior Analysis

Conditional probability helps businesses understand customer behavior more effectively. It allows companies to determine the likelihood of a customer taking a specific action given a previous action. For example, a retailer can calculate the probability that a customer purchases accessories after buying a smartphone. Such insights support targeted marketing, personalized recommendations, and cross-selling strategies. Understanding customer behavior enables organizations to improve customer satisfaction and increase sales revenue. Consequently, conditional probability contributes significantly to customer relationship management and marketing effectiveness.

  • Assists in Financial and Investment Planning

Financial institutions and investors use conditional probability to evaluate investment opportunities and financial risks. It helps estimate the probability of favorable returns under specific market conditions. Investors can analyze how economic indicators, interest rates, or industry trends influence investment outcomes. This information supports better portfolio management and resource allocation. By considering relevant conditions, conditional probability improves financial forecasting and investment decision-making. As a result, organizations can maximize returns while minimizing risks, making it an essential tool in financial planning and analysis.

  • Improves Demand Forecasting

Demand forecasting becomes more accurate when businesses consider factors that influence customer demand. Conditional probability allows organizations to estimate future demand based on conditions such as seasonal changes, promotional campaigns, or economic trends. This helps businesses prepare for fluctuations in customer requirements and adjust production accordingly. Accurate demand forecasts reduce inventory costs, prevent stock shortages, and improve operational efficiency. By incorporating relevant information into predictions, conditional probability enhances the reliability of forecasting models and supports effective business planning.

  • Supports Quality Control and Process Improvement

Manufacturing organizations use conditional probability to analyze production quality and identify factors associated with defects. For example, managers can calculate the probability of product defects given specific machine conditions or production processes. This information helps identify root causes of quality issues and implement corrective measures. Improved quality control reduces waste, lowers production costs, and increases customer satisfaction. By supporting continuous process improvement, conditional probability contributes to higher operational efficiency and better product reliability. Therefore, it plays an important role in manufacturing and production management.

  • Widely Applicable Across Different Industries

A significant advantage of conditional probability is its broad applicability. It is used in business, finance, insurance, healthcare, engineering, marketing, and many other fields. Organizations apply it to solve diverse problems involving uncertainty and decision-making. Whether assessing risks, forecasting demand, evaluating investments, or analyzing customer behavior, conditional probability provides valuable insights. Its versatility makes it one of the most important tools in probability and statistics. Because it can be adapted to various situations, conditional probability remains highly relevant in modern business and research environments.

Limitations of Conditional Probability

  • Requires Accurate and Reliable Data

One of the major limitations of conditional probability is its dependence on accurate and reliable data. The probability estimates are only as good as the information used in the calculations. If the data is incomplete, outdated, or incorrect, the resulting probabilities may be misleading. Businesses often face challenges in collecting high-quality data from customers, markets, or operational activities. Poor data quality can lead to inaccurate forecasts and ineffective decisions. Therefore, organizations must invest significant effort in data collection and verification to ensure meaningful and reliable conditional probability analysis.

  • Complex Calculations

Conditional probability calculations can become complicated, especially when multiple variables and conditions are involved. While simple examples are easy to understand, real-world business situations often require advanced statistical methods and large datasets. The complexity increases when there are numerous interrelated events or changing conditions. Managers without statistical expertise may find it difficult to perform or interpret these calculations. As a result, businesses may need specialized software or trained analysts to handle complex probability problems. This complexity can limit the practical application of conditional probability in some situations.

  • Dependent on Assumptions

Many conditional probability models rely on assumptions about the relationships between events. If these assumptions are incorrect, the probability estimates may not accurately reflect reality. For example, analysts may assume that certain factors influence customer behavior in a particular way, even though market conditions may differ. Such assumptions can affect the reliability of the results. In dynamic business environments, relationships between variables may change over time, making earlier assumptions invalid. Therefore, dependence on assumptions is a significant limitation that users must consider when interpreting conditional probability outcomes.

  • Difficult to Interpret

Conditional probability results can sometimes be difficult to interpret, particularly for individuals without a background in statistics. Understanding how one event influences another requires careful analysis and logical reasoning. In complex situations, the meaning of probability values may not be immediately obvious to managers or stakeholders. Misinterpretation can lead to poor decisions and incorrect conclusions. Businesses often need experts to explain and communicate the results effectively. This limitation reduces the accessibility of conditional probability and may create challenges in applying it to everyday business decision-making.

  • Time-Consuming Data Collection

Calculating conditional probability often requires large amounts of detailed information about related events and conditions. Collecting, organizing, and analyzing this data can be time-consuming and resource-intensive. Businesses may need to conduct surveys, monitor transactions, or gather historical records over long periods. This process can delay decision-making and increase operational costs. Small organizations with limited resources may find it particularly challenging to obtain the required information. Consequently, the time and effort involved in data collection can be a significant limitation of conditional probability analysis.

  • Sensitive to Changes in Data

Conditional probability estimates can change significantly when the underlying data changes. Even small variations in the probability of one event may affect the final conditional probability. In rapidly changing business environments, customer preferences, market conditions, and economic factors can alter probability estimates frequently. As a result, previously calculated probabilities may become outdated or less reliable. Businesses must continuously update their data and recalculate probabilities to maintain accuracy. This sensitivity to changing information can increase the complexity and cost of using conditional probability effectively.

  • Limited Predictive Power in Uncertain Situations

Although conditional probability improves prediction accuracy, it cannot guarantee future outcomes. Unexpected events such as economic crises, natural disasters, technological disruptions, or sudden changes in consumer behavior may occur without warning. These unforeseen factors can significantly affect actual results. Conditional probability is based on available information and known relationships, but it cannot account for every possible circumstance. Therefore, its predictive power is limited in highly uncertain or rapidly changing environments. Businesses should use conditional probability as a support tool rather than relying on it exclusively.

  • Cannot Eliminate Uncertainty Completely

Conditional probability helps measure uncertainty, but it cannot remove it entirely. Probability values represent likelihoods rather than certainties. Even when a conditional probability is very high, there is still a chance that the expected event will not occur. Business decisions based solely on probability estimates may overlook qualitative factors such as managerial judgment, market sentiment, or unforeseen opportunities. Therefore, conditional probability should be combined with experience, expertise, and other analytical tools. This limitation reminds decision-makers that uncertainty remains a part of all business activities despite statistical analysis.

Lines of Regression; Co-efficient of regression

Regression Line is the line that best fits the data, such that the overall distance from the line to the points (variable values) plotted on a graph is the smallest. In other words, a line used to minimize the squared deviations of predictions is called as the regression line.

There are as many numbers of regression lines as variables. Suppose we take two variables, say X and Y, then there will be two regression lines:

  • Regression line of Y on X: This gives the most probable values of Y from the given values of X.
  • Regression line of X on Y: This gives the most probable values of X from the given values of Y.

The algebraic expression of these regression lines is called as Regression Equations. There will be two regression equations for the two regression lines.

The correlation between the variables depend on the distance between these two regression lines, such as the nearer the regression lines to each other the higher is the degree of correlation, and the farther the regression lines to each other the lesser is the degree of correlation.

The correlation is said to be either perfect positive or perfect negative when the two regression lines coincide, i.e. only one line exists. In case, the variables are independent; then the correlation will be zero, and the lines of regression will be at right angles, i.e. parallel to the X axis and Y axis.

The regression lines cut each other at the point of average of X and Y. This means, from the point where the lines intersect each other the perpendicular is drawn on the X axis we will get the mean value of X. Similarly, if the horizontal line is drawn on the Y axis we will get the mean value of Y.

Co-efficient of Regression

The Regression Coefficient is the constant ‘b’ in the regression equation that tells about the change in the value of dependent variable corresponding to the unit change in the independent variable.

If there are two regression equations, then there will be two regression coefficients:

  • Regression Coefficient of X on Y:

The regression coefficient of X on Y is represented by the symbol bxy that measures the change in X for the unit change in Y. Symbolically, it can be represented as:

The bxy can be obtained by using the following formula when the deviations are taken from the actual means of X and Y:When the deviations are obtained from the assumed mean, the following formula is used:

  • Regression Coefficient of Y on X:

The symbol byx is used that measures the change in Y corresponding to the unit change in X. Symbolically, it can be represented as:


In case, the deviations are taken from the actual means; the following formula is used:
The byx can be  calculated by using the following formula when the deviations are taken from the assumed means:

The Regression Coefficient is also called as a slope coefficient because it determines the slope of the line i.e. the change in the independent variable for the unit change in the independent variable

Scatter Diagram

Scatter Diagram Method is the simplest method to study the correlation between two variables wherein the values for each pair of a variable is plotted on a graph in the form of dots thereby obtaining as many points as the number of observations. Then by looking at the scatter of several points, the degree of correlation is ascertained.

The degree to which the variables are related to each other depends on the manner in which the points are scattered over the chart. The more the points plotted are scattered over the chart, the lesser is the degree of correlation between the variables. The more the points plotted are closer to the line, the higher is the degree of correlation. The degree of correlation is denoted by “r”.

The following types of scatter diagrams tell about the degree of correlation between variable X and variable Y.

  1. Perfect Positive Correlation (r = +1):

The correlation is said to be perfectly positive when all the points lie on the straight line rising from the lower left-hand corner to the upper right-hand corner.

2. Perfect Negative Correlation (r = -1):

When all the points lie on a straight line falling from the upper left-hand corner to the lower right-hand corner, the variables are said to be negatively correlated.

3. High Degree of +Ve Correlation (r = + High):

The degree of correlation is high when the points plotted fall under the narrow band and is said to be positive when these show the rising tendency from the lower left-hand corner to the upper right-hand corner.

4. High Degree of –Ve Correlation (r = – High):

The degree of negative correlation is high when the point plotted fall in the narrow band and show the declining tendency from the upper left-hand corner to the lower right-hand corner.

5. Low degree of +Ve Correlation (r = + Low):

The correlation between the variables is said to be low but positive when the points are highly scattered over the graph and show a rising tendency from the lower left-hand corner to the upper right-hand corner.

6. Low Degree of –Ve Correlation (r = + Low):

The degree of correlation is low and negative when the points are scattered over the graph and the show the falling tendency from the upper left-hand corner to the lower right-hand corner.

7. No Correlation (r = 0):

The variable is said to be unrelated when the points are haphazardly scattered over the graph and do not show any specific pattern. Here the correlation is absent and hence r = 0.

Thus, the scatter diagram method is the simplest device to study the degree of relationship between the variables by plotting the dots for each pair of variable values given. The chart on which the dots are plotted is also called as a Dotogram.

Mean Deviation, Coefficient of Mean Deviation and Standard Deviation

Mean Deviation

Mean deviation is a measure of dispersion that indicates the average of the absolute differences between each data point and the mean (or median) of the dataset. It provides an overall sense of how much the values deviate from the central value. To calculate mean deviation, the absolute differences between each data point and the central measure are summed and then divided by the number of observations. Unlike variance, mean deviation is expressed in the same units as the data and is less sensitive to extreme outliers.

The basic formula for finding out mean deviation is :

Mean Deviation = Sum of absolute values of deviations from ‘a’ ÷ The number of observations

Coefficient of Mean Deviation

Coefficient of Mean Deviation is a relative measure of dispersion that expresses the Mean Deviation in relation to the average from which the deviations are calculated. It is useful for comparing the variability of different datasets, especially when their units or average values are different.

Formula: Coefficient of Mean Deviation = Mean Deviation / Average

The average may be Arithmetic Mean, Median, or Mode, depending on the basis used for calculating Mean Deviation.

If Mean Deviation is calculated from the Mean:

Coefficient of M.D.= MDXˉ / Xˉ

If it is calculated from the Median:

Example

Suppose the Mean Deviation = 8 and the Mean = 40.

Coefficient of M.D.= 8 / 40 = 0.20

Therefore, the Coefficient of Mean Deviation = 0.20.

If expressed as a percentage:

0.20 × 100 = 20%

Computation of Mean Deviation

1. Meaning and Concept of Mean Deviation

Mean Deviation (MD) is an absolute measure of dispersion that indicates the average amount by which observations differ from a central value. The central value may be the Arithmetic Mean, Median, or Mode. While calculating Mean Deviation, positive and negative signs are ignored by taking absolute deviations. It helps determine the degree of variation and consistency in a dataset. A lower Mean Deviation indicates greater concentration around the selected average.

2. Computation for Individual Series

For an Individual Series, Mean Deviation is calculated by taking the absolute difference between every observation and the selected average. The absolute deviations are then added and divided by the total number of observations. The formula is: MD = Σ|X − A| / N. Here, X represents an observation, A represents Mean, Median, or Mode, and N represents the number of observations. This method is suitable when observations are given separately.

3. Computation for Discrete Series

In a Discrete Series, each variable has a corresponding frequency. First, the selected average is calculated. Then, the absolute deviation of every value from that average is determined and multiplied by its frequency. The products are added and divided by total frequency. The formula is: MD = Σf|X − A| / Σf. Here, f represents frequency, X represents the value, and A represents the selected average used for calculating Mean Deviation.

4. Computation for Continuous Series

For a Continuous Series, Mean Deviation is calculated using the midpoints of class intervals. First, the midpoint of every class is determined and treated as X. The absolute deviation from the selected average is then calculated and multiplied by frequency. The total of these products is divided by total frequency. The formula is: MD = Σf|X − A| / Σf. This method is useful for analysing data presented through continuous class intervals.

5. Selection of Central Value

Mean Deviation can be calculated from the Mean, Median, or Mode. The choice depends upon the nature of the data and the purpose of analysis. Generally, the Median is preferred because Mean Deviation calculated from the Median is minimum compared with other central values. The selected average provides the reference point from which absolute deviations are measured. Therefore, proper selection of the central value is important for meaningful results.

6. Steps in Computation

The computation of Mean Deviation involves several systematic steps. First, identify the appropriate central value. Second, calculate the deviation of each observation from that value. Third, ignore the positive and negative signs by taking absolute values. Fourth, multiply deviations by frequencies for discrete or continuous series. Fifth, add the resulting values and divide by the total number of observations or frequency. This procedure produces the required Mean Deviation.

7. Coefficient of Mean Deviation

The Coefficient of Mean Deviation is a relative measure used to compare the dispersion of different datasets. It is obtained by dividing Mean Deviation by the central value from which the deviation was calculated. The formula is: Coefficient of M.D. = Mean Deviation / Average. If Median is used, the formula becomes Coefficient of M.D. = M.D. / Median. A lower coefficient indicates greater consistency, while a higher coefficient indicates greater relative variability.

8. Interpretation of Mean Deviation

Mean Deviation indicates the average distance of observations from a selected central value. A low Mean Deviation means that observations are closely concentrated around the average, showing greater consistency. A high Mean Deviation indicates that observations are widely dispersed and less consistent. Therefore, Mean Deviation provides a simple numerical measure of variability. It is useful for understanding the extent to which observations differ from their central tendency.

Applications of Mean Deviation

1. Business Performance Analysis

Mean Deviation is useful in analysing variations in sales, production, revenue, costs, and profits. It helps managers determine how far individual business results generally differ from the average performance. A smaller Mean Deviation indicates greater stability and consistency, whereas a larger value indicates greater fluctuations. This information can support managerial planning, performance evaluation, budgeting, and control. Therefore, Mean Deviation provides a useful measure for understanding variability in different areas of business operations.

2. Financial Analysis

In financial analysis, Mean Deviation can be used to study variations in income, expenditure, returns, prices, and other financial variables. It indicates the average extent to which financial observations differ from their selected central value. This helps analysts understand the consistency of financial performance. By examining dispersion along with central tendency, financial managers can make more informed decisions regarding planning, budgeting, investment evaluation, and financial control.

3. Wage and Income Analysis

Mean Deviation is useful for studying variations in wages, salaries, and incomes among individuals or groups. It indicates how far individual earnings generally differ from the average or median income. A lower Mean Deviation suggests greater uniformity in earnings, while a higher value indicates greater inequality or variation. Governments, researchers, and organizations can use this information to study income patterns and understand the distribution of earnings within a population.

4. Educational Analysis

Educational institutions can apply Mean Deviation to analyse variations in marks, grades, attendance, and academic performance. It helps determine how closely students’ results are concentrated around the average performance. A low Mean Deviation indicates relatively consistent performance, whereas a high value indicates substantial differences among students. Teachers and administrators can use this information to evaluate academic patterns, identify variations in achievement, and support educational planning and improvement.

5. Market Research

Mean Deviation has important applications in market research for studying variations in customer spending, product demand, sales, prices, and purchasing behaviour. It helps researchers determine the average extent of variation around a selected central value. Understanding dispersion enables businesses to identify whether consumer behaviour is relatively stable or highly variable. Such information can support decisions related to pricing, production, marketing strategies, inventory management, and sales forecasting.

6. Quality Control

In quality control, Mean Deviation helps measure variations in product characteristics such as weight, size, dimensions, quantity, and production output. It indicates how far individual measurements differ from the selected standard or central value. A smaller Mean Deviation generally indicates greater consistency in production, while a larger value may suggest greater variation. Therefore, it can help manufacturers monitor production quality, identify inconsistencies, and improve manufacturing processes.

7. Economic Analysis

Mean Deviation is useful in economic analysis for studying variations in prices, income, consumption, production, employment, and other economic variables. It provides information about the degree of dispersion around a central value. Economists can use it to understand the stability or variability of economic conditions. When combined with measures of central tendency, Mean Deviation provides a clearer picture of the distribution and consistency of economic data.

8. Comparison of Data

Mean Deviation and its coefficient can be used to compare the variability of different datasets. Absolute Mean Deviation is useful when datasets are expressed in similar units, while the Coefficient of Mean Deviation is more suitable when their magnitudes or averages differ. A lower coefficient generally indicates greater consistency, whereas a higher coefficient indicates greater relative dispersion. Thus, Mean Deviation supports meaningful comparison between different groups or distributions.

Advantages

  • It is a relative measure of dispersion.
  • It facilitates comparison between different distributions.
  • It is simple to calculate and understand.
  • It is based on absolute deviations.
  • It can be calculated using Mean or Median.
  • It is useful when datasets have different magnitudes.
  • It provides a standardized measure of variability.
  • It is useful in business and economic analysis.

Limitations

  • It is not based on algebraic deviations.
  • It is less useful for advanced mathematical analysis.
  • Its value depends on the average selected.
  • It gives less importance to extreme values than standard deviation.
  • It may not be suitable for all types of statistical analysis.
  • Calculation can become lengthy for large datasets.
  • It does not use the squared deviations used in standard deviation.
  • It is less widely used than the Coefficient of Variation.

Standard Deviation

Standard deviation is a widely used measure of dispersion that indicates the average amount by which each data point deviates from the mean. It is calculated by first finding the variance, which is the average of squared deviations, and then taking the square root of the variance. Standard deviation provides a more interpretable measure of spread, as it is in the same units as the original data. A higher standard deviation indicates greater variability, while a lower value indicates data points are closer to the mean, indicating less spread or consistency.

Usually represented by s or σ. It uses the arithmetic mean of the distribution as the reference point and normalizes the deviation of all the data values from this mean.

Therefore, we define the formula for the standard deviation of the distribution of a variable X with n data points as:

Combined Standard Deviation

Combined Standard Deviation is a statistical measure used to determine the standard deviation of two or more groups taken together. It considers the number of observations, individual standard deviations, and differences between group means. It provides a single measure of dispersion for the combined data and is useful when separate groups need to be analysed as one population.

Formula: Combined S.D. = √[N₁(σ₁² + d₁²) + N₂(σ₂² + d₂²)] / √(N₁ + N₂)

Where:

N₁, N₂ = Number of observations in the groups
σ₁, σ₂ = Standard deviations of the groups
d₁, d₂ = Differences between group means and combined mean

Combined Mean

Combined Mean = (N₁X̄₁ + N₂X̄₂) / (N₁ + N₂)

Computation of Standard Deviation

1. Meaning and Concept of Standard Deviation

Standard Deviation (SD) is an important absolute measure of dispersion that shows the extent to which observations differ from their Arithmetic Mean. It is calculated by taking the square root of the average of the squared deviations from the mean. A smaller Standard Deviation indicates greater consistency, while a larger value indicates greater variability. It is widely used because it considers all observations and provides a reliable measure of dispersion.

2. Computation for Individual Series

For an Individual Series, Standard Deviation is calculated by first finding the Arithmetic Mean. The deviation of each observation from the mean is then calculated and squared. These squared deviations are added and divided by the total number of observations. Finally, the square root of the result is taken. Formula: SD = √[Σ(X − X̄)² / N]. Here, X represents observations, X̄ represents the mean, and N represents observations.

3. Computation for Discrete Series

In a Discrete Series, each value is associated with a frequency. First, the Arithmetic Mean is calculated. Then, deviations of each value from the mean are obtained and squared. Each squared deviation is multiplied by its corresponding frequency. The total is divided by the total frequency, and the square root is taken. Formula: SD = √[Σf(X − X̄)² / Σf]. This method considers both values and their respective frequencies.

4. Computation for Continuous Series

For a Continuous Series, Standard Deviation is calculated using the midpoints of class intervals. The midpoint represents each class and is treated as X. Deviations from the Arithmetic Mean are calculated and squared, then multiplied by the corresponding frequencies. The sum is divided by total frequency, followed by taking the square root. Formula: SD = √[Σf(X − X̄)² / Σf]. This method is suitable for grouped continuous data.

5. Direct Method

The Direct Method calculates Standard Deviation by using the actual deviations of observations from the Arithmetic Mean. The formula for an individual series is SD = √[Σ(X − X̄)² / N]. For frequency distributions, frequencies are incorporated into the calculation. Although this method is conceptually simple, it can become lengthy when observations are large or contain inconvenient numerical values. It is mainly useful when the Arithmetic Mean is easy to calculate.

6. Assumed Mean Method

Assumed Mean Method simplifies the calculation when the actual mean is inconvenient to use. A convenient value is selected as the Assumed Mean (A), and deviations are calculated from it. The formula is: SD = √[(Σd² / N) − (Σd / N)²], where d represents deviation from the assumed mean. This method reduces calculation work and is particularly useful for datasets containing large values.

7. Step-Deviation Method

Step-Deviation Method is a simplified form of the assumed mean method, especially useful when class intervals have a common width. Deviations are divided by the common class interval. The formula is: SD = i√[(Σfu² / Σf) − (Σfu / Σf)²]. Here, i represents the common class interval and u represents step-deviations. This method considerably reduces the size of calculations in large frequency distributions.

8. Interpretation of Standard Deviation

Standard Deviation measures the overall spread of observations around the mean. A low Standard Deviation indicates that observations are closely concentrated around the mean, showing greater consistency. A high Standard Deviation indicates greater dispersion and less consistency. Since it is expressed in the same units as the original observations, it is easy to interpret. Standard Deviation also forms the basis for several advanced statistical techniques.

Applications of Standard Deviation

1. Business Performance Analysis

Standard Deviation is widely used in business analysis to measure variations in sales, production, revenue, costs, and profits. It helps managers determine the stability of business performance. A low Standard Deviation indicates consistent results, while a high value indicates significant fluctuations. This information can support planning, budgeting, performance evaluation, and managerial decision-making. Therefore, Standard Deviation provides a reliable measure for analysing variability in different business activities.

2. Financial and Investment Analysis

In financial analysis, Standard Deviation is commonly used to measure the variability of investment returns. A higher Standard Deviation generally indicates greater fluctuation in returns and therefore greater investment risk. Investors can use it to compare the stability of different investments and evaluate risk-return characteristics. It is also useful in portfolio analysis, financial planning, and assessment of market performance where variation in returns is an important consideration.

3. Quality Control

Standard Deviation is an important tool in quality control because it measures variation in production processes. It can be used to study differences in product weight, size, dimensions, strength, or other characteristics. A small Standard Deviation indicates that products are produced consistently, while a large value suggests greater variation. Manufacturers can use this information to identify production problems, maintain quality standards, and improve operational efficiency.

4. Educational Analysis

In education, Standard Deviation is used to analyse variations in students’ marks, grades, test scores, and academic performance. It helps determine whether students’ results are concentrated around the average or widely dispersed. A low Standard Deviation suggests relatively similar performance, while a high value indicates greater differences among students. Educational institutions can use this information for performance evaluation, examination analysis, and comparison of academic results.

5. Economic Analysis

Standard Deviation is useful in economic studies for analysing variations in income, prices, employment, production, consumption, and other economic variables. It helps economists understand the stability and distribution of economic data. By studying Standard Deviation along with measures of central tendency, researchers can obtain a better understanding of economic conditions. It is particularly useful when comparing variability across different periods, regions, or economic groups.

6. Market Research

In market research, Standard Deviation helps measure variations in customer spending, product demand, sales, prices, and consumer preferences. It enables businesses to determine whether market behaviour is relatively stable or highly variable. A lower Standard Deviation indicates greater consistency in observations, while a higher value suggests greater variation. This information can assist businesses in marketing planning, pricing decisions, demand analysis, and sales forecasting.

7. Scientific and Research Analysis

Standard Deviation is widely applied in scientific research to measure the variability of experimental observations. Researchers use it to determine how closely observations are distributed around their mean. It helps assess the consistency and reliability of experimental results. Standard Deviation is also an important component of many statistical techniques, including correlation, regression, hypothesis testing, and statistical estimation, making it essential for quantitative research.

8. Comparison and Decision-Making

Standard Deviation provides a useful basis for comparison and decision-making. When datasets are measured in the same units, their Standard Deviations can be compared directly to determine which has greater variability. When combined with the Coefficient of Variation, it can also help compare relative consistency between datasets with different averages. Therefore, Standard Deviation supports effective decisions in business, finance, economics, education, research, and other fields.

Median Characteristics, Applications and Limitations

Median is a measure of central tendency that represents the middle value of an ordered dataset, dividing it into two equal halves. If the dataset has an odd number of values, the median is the middle value. If the dataset has an even number, it is the average of the two middle values. The median is less affected by outliers, making it useful for skewed data or non-uniform distributions.

Example:

The marks of nine students in a geography test that had a maximum possible mark of 50 are given below:

     47     35     37     32     38     39     36     34     35

Find the median of this set of data values.

Solution:

Arrange the data values in order from the lowest value to the highest value:

    32     34     35     35     36     37     38     39     47

The fifth data value, 36, is the middle value in this arrangement.

Characteristics of Median:

  1. Middle Value of Data

The median divides a dataset into two equal halves, with 50% of the values lying below it and 50% above it. It is determined by arranging data in ascending or descending order.

  1. Resistant to Outliers

The median is not influenced by extreme values or outliers. This makes it a more robust measure for datasets with significant variability or skewness.

  1. Applicable to Ordinal and Quantitative Data

The median can be calculated for ordinal data (where data can be ranked) and quantitative data. It is not suitable for nominal data, as there is no inherent order.

  1. Unique Value

For any given dataset, the median is always unique and provides a single central value, ensuring consistency in its interpretation.

  1. Requires Data Sorting

The calculation of the median necessitates ordering the data values. Without arranging the data, the median cannot be identified.

  1. Effective for Skewed Distributions

In skewed datasets, the median better represents the center compared to the mean, as it remains unaffected by the skewness.

  1. Not Affected by Sample Size

Median’s calculation is straightforward and remains valid regardless of the sample size, as long as the data is properly ordered.

Applications of Median:

  1. Income and Wealth Distribution

In economics and social studies, the median is used to analyze income and wealth distributions. For example, the median income indicates the income level at which half the population earns less and half earns more. It is more accurate than the mean in scenarios with extreme disparities, such as high-income earners skewing the average.

  1. Real Estate Market Analysis

Median is commonly applied in the real estate industry to determine the central value of property prices. Median house prices are preferred over averages because they are less affected by outliers, such as extremely high or low-priced properties.

  1. Educational Assessments

In education, the median is used to evaluate student performance. For example, the median test score helps identify the middle-performing student, providing a fair representation when the scores are unevenly distributed.

  1. Medical and Health Statistics

Median is often employed in health sciences to summarize data such as median survival rates or recovery times. These metrics are crucial when the data includes extreme cases or a non-symmetric distribution.

  1. Demographic Studies

Median age, household size, and other demographic measures are widely used in population studies. These metrics provide insights into the central characteristics of populations while avoiding distortion by extremes.

  1. Transportation Planning

In transportation and traffic analysis, the median is used to determine the typical travel time or commute duration. It offers a realistic measure when the data includes unusually long or short travel times.

Demerits or Limitations of Median:

  1. Even if the value of extreme items is too large, it does not affect too much, but due to this reason, sometimes median does not remain the representative of the series.
  2. It is affected much more by fluctuations of sampling than A.M.
  3. Median cannot be used for further algebraic treatment. Unlike mean we can neither find total of terms as in case of A.M. nor median of some groups when combined.
  4. In a continuous series it has to be interpolated. We can find its true-value only if the frequencies are uniformly spread over the whole class interval in which median lies.
  5. If the number of series is even, we can only make its estimate; as the A.M. of two middle terms is taken as Median.

Mode, Characteristics, Applications and Limitations

Mode is a measure of central tendency that identifies the most frequently occurring value or values in a dataset. Unlike the mean or median, the mode can be used for both numerical and categorical data. A dataset may have one mode (unimodal), more than one mode (bimodal or multimodal), or no mode at all if no value repeats. The mode is particularly useful for understanding trends in categorical data, such as the most popular product, common response, or frequent event, and is less sensitive to outliers compared to other central tendency measures.

Examples:

For example, in the following list of numbers, 16 is the mode since it appears more times than any other number in the set:

  • 3, 3, 6, 9, 16, 16, 16, 27, 27, 37, 48

A set of numbers can have more than one mode (this is known as bimodal if there are 2 modes) if there are multiple numbers that occur with equal frequency, and more times than the others in the set.

  • 3, 3, 3, 9, 16, 16, 16, 27, 37, 48

In the above example, both the number 3 and the number 16 are modes as they each occur three times and no other number occurs more than that.

If no number in a set of numbers occurs more than once, that set has no mode:

  • 3, 6, 9, 16, 27, 37, 48

Characteristics of Mode:

  • Can Be Used for Qualitative and Quantitative Data

Mode can be applied to both qualitative (categorical) and quantitative data. For example, in market research, the mode can identify the most common product color or customer preference.

  • Not Affected by Outliers

The mode is not influenced by extreme values or outliers in a dataset. For instance, in a dataset of salaries where most values are clustered around a certain range but a few extreme salaries exist, the mode will still reflect the most frequent salary, making it a useful measure when dealing with skewed data or anomalies.

  • May Have Multiple Values

A dataset may have more than one mode. If there are two values that occur with the same highest frequency, the dataset is considered bimodal. If there are more than two, it is multimodal. In such cases, the mode provides insight into multiple frequent occurrences within the dataset, unlike the mean or median, which offer a single value.

  • Can Be Uniquely Defined or Undefined

In some datasets, there may be no mode if all values occur with equal frequency. For example, in a dataset where every value appears only once, the mode is undefined. Conversely, in datasets with a clear most frequent value, the mode is uniquely defined.

  • Easy to Calculate

The mode is simple to compute. It only requires identifying the value that appears most frequently in the dataset. No complex formulas or data manipulations are needed, making it a straightforward measure for quick analysis.

  • Useful for Categorical Data

The mode is especially useful for categorical data where numerical calculations do not apply. For instance, in surveys where respondents choose their favorite color, the mode will show the most popular choice, providing valuable insights in marketing or social studies.

Applications of Mode:

  1. Market Research

In market research, the mode is used to identify the most popular product, service, or customer preference. For example, if a survey is conducted to determine consumers’ favorite brands, the mode will highlight the brand chosen most frequently, helping businesses focus on popular trends.

  1. Fashion and Retail Industry

The mode is widely used in the fashion and retail sectors to determine popular product styles, colors, or sizes. For example, if a clothing store wants to know the most commonly bought color of a particular item, the mode will provide the answer, guiding inventory decisions and promotional strategies.

  1. Educational Testing

In educational assessments, the mode can be used to determine the most common score or grade achieved by students in a test or examination. This helps educators identify common performance trends and understand the difficulty level of the assessment.

  1. Health and Medical Statistics

In healthcare, the mode is used to find the most common age group, symptom, or diagnosis within a population. For example, in a study of common diseases, the mode can reveal the most frequently occurring disease or the most prevalent age group affected, providing insights into public health needs.

  1. Consumer Behavior Analysis

In consumer behavior studies, the mode is used to determine the most frequently chosen option in surveys and polls. For instance, it can highlight the most common reasons for customer dissatisfaction or preferences regarding product features, aiding companies in product development and customer service strategies.

  1. Sports Statistics

In sports analytics, the mode is used to identify the most frequent performance metric. For example, the mode can be applied to identify the most common score in a set of matches or the most frequent outcome of a particular game, assisting coaches and analysts in understanding patterns in performance.

Advantages:

  • It is easy to understand and simple to calculate.
  • It is not affected by extremely large or small values.
  • It can be located just by inspection in un-grouped data and discrete frequency distribution.
  • It can be useful for qualitative data.
  • It can be computed in an open-end frequency table.
  • It can be located graphically.

Disadvantages:

  • It is not well defined.
  • It is not based on all the values.
  • It is stable for large values so it will not be well defined if the data consists of a small number of values.
  • It is not capable of further mathematical treatment.
  • Sometimes the data has one or more than one mode, and sometimes the data has no mode at all.
error: Content is protected !!