Graphs of Frequency Distribution

Frequency distribution, in statistics, a graph or data set organized to show the frequency of occurrence of each possible outcome of a repeatable event observed many times. Simple examples are election returns and test scores listed by percentile. A frequency distribution can be graphed as a histogram or pie chart. For large data sets, the stepped graph of a histogram is often approximated by the smooth curve of a distribution function (called a density function when normalized so that the area under the curve.

In statistics, a frequency distribution is a list, table or graph that displays the frequency of various outcomes in a sample. Each entry in the table contains the frequency or count of the occurrences of values within a particular group or interval.

The famed bell curve, or normal distribution, is the graph of one such function. Frequency distributions are particularly useful in summarizing large data sets and assigning probabilities.

Applications

Managing and operating on frequency tabulated data is much simpler than operation on raw data. There are simple algorithms to calculate median, mean, standard deviation etc. from these tables.

Statistical hypothesis testing is founded on the assessment of differences and similarities between frequency distributions. This assessment involves measures of central tendency or averages, such as the mean and median, and measures of variability or statistical dispersion, such as the standard deviation or variance.

A frequency distribution is said to be skewed when its mean and median are significantly different, or more generally when it is asymmetric. The kurtosis of a frequency distribution is a measure of the proportion of extreme values (outliers), which appear at either end of the histogram. If the distribution is more outlier-prone than the normal distribution it is said to be leptokurtic; if less outlier-prone it is said to be platykurtic.

Letter frequency distributions are also used in frequency analysis to crack ciphers, and are used to compare the relative frequencies of letters in different languages and other languages are often used like Greek, Latin, etc.

Types of Frequency Distribution

  • Grouped frequency distribution.
  • Ungrouped frequency distribution.
  • Cumulative frequency distribution.
  • Relative frequency distribution.
  • Relative cumulative frequency distribution.

Grouped Data

At certain times to ensure that we are making correct and relevant observations from the data set, we may need to group the data into class intervals. This ensures that the frequency distribution best represents the data. Let us make a grouped frequency data table of the same example above of the height of students.

Class Interval Frequency
130-140 4
140-150 5
150-160 3

From the above table, you can see that the value of 150 is put in the class interval of 150-160 and not 140-150.

Example

Frequency Distribution Table

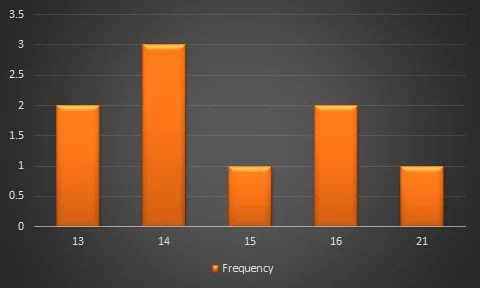
13,14,16,13,16,14,21,14,15

Height Frequency
13 2
14 3
15 1
16 2
21 1

Diagrammatic Presentation of Data, One Dimensional and Two-Dimensional Diagrams

Diagrammatic Presentation of Data refers to the method of presenting statistical information through diagrams, charts, and visual forms. It converts numerical data into an attractive and easily understandable form. Diagrams are especially useful when information needs to be communicated to people who may not be familiar with detailed statistical tables. They help in making comparisons, identifying trends, understanding proportions, and highlighting important features of data. Diagrammatic presentation is widely used in business reports, newspapers, research studies, government publications, and presentations.

1. Simple Bar Diagram

Simple Bar Diagram represents data using rectangular bars of equal width, where the length or height of each bar is proportional to the value being represented. Bars are generally separated by equal spaces and can be drawn vertically or horizontally. It is mainly used for comparing different categories of data. The categories are shown on one axis and their corresponding values on the other axis. Example: A company may represent annual sales of four products as Product A – ₹20 lakh, Product B – ₹30 lakh, Product C – ₹25 lakh, and Product D – ₹40 lakh. The tallest bar will represent Product D. Simple bar diagrams make comparisons quick, clear, and visually understandable.

2. Multiple Bar Diagram

Multiple Bar Diagram is used when two or more related sets of data need to be compared simultaneously. In this diagram, several bars are placed together for each category, with each bar representing a different variable. Different patterns, shades, or colours may be used to distinguish the variables. It is useful for comparing changes between related groups. Example: A company may compare the sales of Products A and B during three years. For each year, two bars can be drawn side by side—one for Product A and another for Product B. Multiple bar diagrams allow users to observe differences and relationships between several datasets conveniently and clearly.

3. Component Bar Diagram

Component Bar Diagram represents a total quantity through a single bar that is divided into different components or parts. Each component is proportional to its contribution to the total. It is useful for showing both the total value and the composition of that total. Example: A company’s total expenditure of ₹10 lakh may consist of salaries ₹4 lakh, raw materials ₹3 lakh, transportation ₹2 lakh, and other expenses ₹1 lakh. A single bar representing ₹10 lakh can be divided into these four components. Component bar diagrams help users understand how a total amount is distributed among different parts and are particularly useful for analysing the composition of business expenditure, income, production, or population.

4. Percentage Bar Diagram

Percentage Bar Diagram presents each total quantity as a bar divided into components according to their percentage contribution. Every bar represents 100 percent, regardless of the actual total value. This makes it particularly useful for comparing the relative composition of different groups. Example: Suppose the expenditure of a family consists of 40% food, 25% housing, 20% education, and 15% transport. A bar representing 100% can be divided into these four sections. If expenditure patterns for different families or years are compared, percentage bars make differences in composition easy to identify. Thus, percentage bar diagrams are useful when the objective is to compare proportions or relative shares rather than absolute quantities.

5. Pie Diagram

Pie Diagram, also called a Pie Chart, is a circular diagram divided into sectors representing different components of a total. The complete circle represents 100% or 360°, and the angle of each sector is proportional to its corresponding value. The angle can be calculated using the formula: Angle = Value ÷ Total × 360°. Example: If a company’s total expenditure is divided into salaries 40%, materials 30%, rent 20%, and other expenses 10%, the circle can be divided into sectors representing these percentages. Pie diagrams are particularly useful for showing the composition and relative importance of different components within a total.

6. Pictogram

Pictogram presents statistical information using pictures, symbols, or icons, where each picture represents a specific numerical quantity. It is a simple and attractive method of presenting data and is especially suitable for general audiences and elementary statistical communication. A key or legend is provided to explain the value represented by each symbol. Example: If one book symbol represents 100 books sold, then five symbols represent 500 books sold. A pictogram can be used to display the sales of different products, number of students, or production levels. Although it is visually appealing and easy to understand, it may not provide the same precision as tables or more technical diagrams.

7. Line Diagram

Line Diagram represents statistical data by plotting values as points and connecting those points with straight lines. It is particularly useful for showing changes and trends over time. Time is usually represented on the horizontal axis, while the corresponding values are represented on the vertical axis. Example: A company’s sales may be ₹10 lakh in 2022, ₹15 lakh in 2023, ₹18 lakh in 2024, and ₹25 lakh in 2025. Plotting and joining these values creates a line showing the sales trend. Line diagrams are widely used for analysing sales, prices, production, population, profits, and other time-series data.

8. Area Diagram

An Area Diagram represents data through the size of a particular area, where the area of the diagram is proportional to the magnitude of the value. It is useful when differences between quantities need to be represented visually. Common forms include rectangles, squares, and circles whose areas correspond to the data values. Example: If the production of one factory is twice that of another, the area used to represent the first factory should be twice the area representing the second. Area diagrams can provide an effective visual comparison of large quantities. However, they require careful construction because differences in area may sometimes be more difficult to interpret accurately than differences in length or height.

One-Dimensional and Two-Dimensional Diagrams

Diagrammatic presentation can be broadly classified into One-Dimensional Diagrams and Two-Dimensional Diagrams. These diagrams present numerical data visually and make statistical information easier to understand, compare, and interpret.

1. One-Dimensional Diagrams

One-Dimensional Diagrams are diagrams in which only one dimension, usually length or height, represents the magnitude of the data. The width of the diagram is kept uniform and does not represent any value. The size of each bar or line is proportional to the quantity being presented. One-dimensional diagrams are mainly used for making simple comparisons between different categories. Common examples include simple bar diagrams, multiple bar diagrams, component bar diagrams, and percentage bar diagrams.

Example: If the sales of four products are ₹20 lakh, ₹30 lakh, ₹25 lakh, and ₹40 lakh, bars of different heights can represent these values. The tallest bar will represent ₹40 lakh. These diagrams are simple, clear, and easy to construct.

2. Two-Dimensional Diagrams

Two-Dimensional Diagrams are diagrams in which two dimensions, length and width or area, are used to represent the magnitude of data. Unlike one-dimensional diagrams, the area of the diagram is proportional to the value being represented. These diagrams are useful when differences in the magnitude of data need to be shown through areas. Common forms include rectangular diagrams, square diagrams, and circular or pie diagrams.

Example: If one company’s profit is ₹10 lakh and another company’s profit is ₹20 lakh, the area of the second diagram should be twice the area of the first. Two-dimensional diagrams are visually attractive and useful for presenting financial, business, population, and expenditure data in a comparative form.

Pictograms, Cartograms

Pictograms

A pictogram, also called a pictogramme, pictograph, or simply picto, and in computer usage an icon, is a graphic symbol that conveys its meaning through its pictorial resemblance to a physical object. Pictographs are often used in writing and graphic systems in which the characters are to a considerable extent pictorial in appearance. A pictogram may also be used in subjects such as leisure, tourism, and geography.

A pictogram is a chart that uses pictures to represent data. Pictograms are set out in the same way as bar charts, but instead of bars they use columns of pictures to show the numbers involved.

Pictography is a form of writing which uses representational, pictorial drawings, similarly to cuneiform and, to some extent, hieroglyphic writing, which also uses drawings as phonetic letters or determinative rhymes. Some pictograms, such as Hazards pictograms, are elements of formal languages.

Pictograph has a rather different meaning in the field of prehistoric art, including recent art by traditional societies and then means art painted on rock surfaces, as opposed to petroglyphs; the latters are carved or incised. Such images may or may not be considered pictograms in the general sense.

Standardization

Pictographs can often transcend languages in that they can communicate to speakers of a number of tongues and language families equally effectively, even if the languages and cultures are completely different. This is why road signs and similar pictographic material are often applied as global standards expected to be understood by nearly all.

A standard set of pictographs was defined in the international standard ISO 7001: Public Information Symbols. Other common sets of pictographs are the laundry symbols used on clothing tags and the chemical hazard symbols as standardized by the GHS system.

Pictograms have been popularized in use on the web and in software, better known as “icons” displayed on a computer screen in order to help user navigate a computer system or mobile device.

Pictograms are most commonly used in Key Stage 1 as a simple and engaging introduction to bar charts. Sometimes teachers will give children cut-out pictures to count out and stick onto a ready-made sheet. This physical activity makes the concept very clear for young children.

When compiling information for a pictogram, a teacher will usually encourage their class to collect data about other children: for example, children might be asked to find out about favourite crisps, cakes, animals or colours of the children in their class or another class. Often, they will record this information on a class list and then put it onto a tally chart (for the younger children, the teacher will probably collate a tally chart on the board for the class). This information is then converted into a pictogram.

Children continue to learn about pictograms in Year 3. More advanced pictograms might be used further up the school, where one image represents more than one of an object, so children need to think about how they are interpreting the number of images.

Cartograms

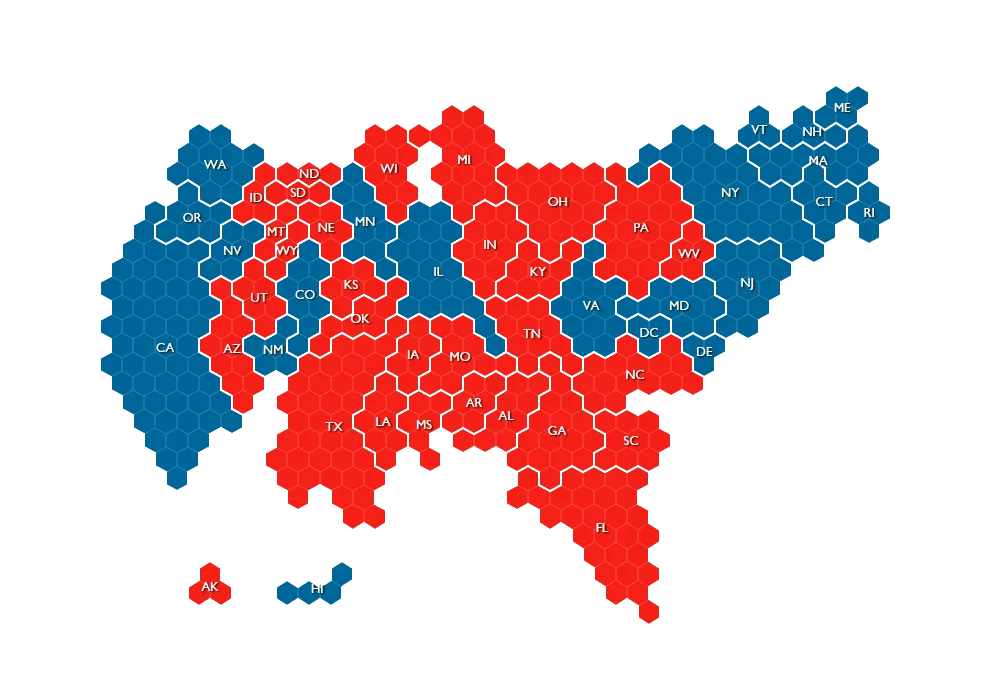
A cartogram (also called a value-area map or an anamorphic map, the latter common among German-speakers) is a thematic map of a set of features (countries, provinces, etc.), in which their geographic size is altered to be directly proportional to a selected ratio-level variable, such as travel time, population, or GNP. Geographic space itself is thus warped, sometimes extremely, in order to visualize the distribution of the variable. It is one of the most abstract types of map; in fact, some forms may more properly be called diagrams. They are primarily used to display emphasis and for analysis as nomographs.

Cartograms leverage the fact that size is the most intuitive visual variable for representing a total amount. In this, it is a strategy that is similar to proportional symbol maps, which scale point features, and many flow maps, which scale the weight of linear features. However, these two techniques only scale the map symbol, not space itself; a map that stretches the length of linear features is considered a linear cartogram (although additional flow map techniques may be added). Once constructed, cartograms are often used as a base for other thematic mapping techniques to visualize additional variables, such as choropleth mapping.

General principles

Since the early days of the academic study of cartograms, they have been compared to map projections in many ways, in that both methods transform (and thus distort) space itself. The goal of designing a cartogram or a map projection is therefore to represent one or more aspects of geographic phenomena as accurately as possible, while minimizing the collateral damage of distortion in other aspects. In the case of cartograms, by scaling features to have a size proportional to a variable other than their actual size, the danger is that the features will be distorted to the degree that they are no longer recognizable to map readers, making them less useful.

As with map projections, the tradeoffs inherent in cartograms have led to a wide variety of strategies, including manual methods and dozens of computer algorithms that produce very different results from the same source data. The quality of each type of cartogram is typically judged on how accurately it scales each feature, as well as on how (and how well) it attempts to preserve some form of recognizability in the features, usually in two aspects: shape and topological relationship (i.e., retained adjacency of neighboring features). It is likely impossible to preserve both of these, so some cartogram methods attempt to preserve one at the expense of the other, some attempt a compromise solution of balancing the distortion of both, and other methods do not attempt to preserve either one, sacrificing all recognizability to achieve another goal.

Several options are available for the geometric shapes:

  • Circles (Dorling), typically brought together to be touching and arranged to retain some semblance of the overall shape of the original space.[26] These often look like proportional symbol maps, and some consider them to be a hybrid between the two types of thematic map.
  • Squares (Levasseur/Demers), treated in much the same way as the circles, although they do not generally fit together as simply.
  • Rectangles (Raisz), in which the height and width of each rectangular district is adjusted to fit within an overall shape. The result looks much like a treemap diagram, although the latter is generally sorted by size rather than geography. These are often contiguous, although the contiguity may be illusory because many of the districts that are adjacent in the map may not be the same as those that are adjacent in reality.

Statistical Errors and Approximation

Statistical Errors and Approximation are important concepts in Business Statistics-I because statistical results may differ from the actual or true values due to various reasons. Statistical errors arise during data collection, sampling, measurement, processing, calculation, or interpretation. Approximation means expressing an exact value in a simpler form by rounding or estimating it. Understanding these concepts helps maintain accuracy, reliability, and consistency in statistical calculations and investigations.

1. Statistical Error

Statistical Error is the difference between the true value of a population characteristic and the value obtained through statistical observation or calculation. Errors may occur because of sampling, measurement, recording, processing, or other factors. Statistical error does not necessarily mean that an investigator has made a mistake; some errors are unavoidable when studying a sample rather than the complete population.

Example: If the actual average monthly income of a population is ₹35,000 but the calculated sample average is ₹34,500, the difference of ₹500 represents statistical error.

2. Sampling Error

Sampling Error occurs because a sample rather than the entire population is studied. Even when sampling is carried out correctly, the characteristics of a sample may differ from those of the population. The size of sampling error depends on factors such as sample size, sampling method, and population variability. A larger and properly selected sample generally reduces sampling error.

Example: The actual average expenditure of all customers is ₹8,000, while a selected sample of customers shows an average of ₹7,700. The difference represents sampling error.

3. Non-Sampling Error

Non-Sampling Error arises from factors other than sampling and can occur in both census and sample investigations. Common causes include incorrect responses, poor questionnaire design, missing information, interviewer bias, recording mistakes, and data-processing errors. These errors can sometimes be more serious than sampling errors because increasing the sample size does not necessarily eliminate them.

Example: If respondents incorrectly report their monthly income because they misunderstand the question, the resulting incorrect information represents a non-sampling error.

4. Measurement Error

Measurement Error occurs when the value recorded during an investigation differs from the actual value of the variable being measured. It may result from defective instruments, inaccurate procedures, unclear definitions, or misunderstanding by respondents. Proper measurement standards and reliable instruments can help minimize such errors.

Example: If the actual weight of a product is 10 kilograms but an improperly calibrated weighing machine records it as 9.8 kilograms, the difference of 0.2 kilograms represents a measurement error.

5. Processing and Calculation Error

Processing and Calculation Errors occur during editing, coding, classification, tabulation, data entry, or mathematical calculations. Even accurate data can produce incorrect results if mistakes are made while processing them. Such errors may include incorrect addition, duplication of observations, wrong coding, or entering figures incorrectly. Careful checking and verification are necessary to reduce these errors.

Example: If the sales figures ₹20,000, ₹30,000, and ₹40,000 are incorrectly added as ₹80,000 instead of ₹90,000, the resulting figure contains a calculation error.

6. Approximation

Approximation means representing an exact numerical value by a nearby simpler value. It is commonly used when exact values contain many decimal places or when a simpler figure is sufficient for practical purposes. Approximation makes statistical calculations and presentation easier, but it introduces a small difference from the exact value.

Example: If the exact average sales value is ₹25,678.45, it may be approximated to ₹25,678 or ₹25,700 depending on the required level of accuracy. The choice should be appropriate to the purpose.

7. Rounding Off

Rounding Off is a common method of approximation in which numbers are reduced to a specified number of decimal places or significant digits. If the next digit is 5 or more, the preceding digit is generally increased by one; if it is less than 5, the preceding digit remains unchanged. Consistent rounding improves clarity and presentation.

Example: 48.736 rounded to two decimal places becomes 48.74, while 48.732 becomes 48.73. Rounding should be performed carefully to avoid unnecessary errors.

8. Absolute and Relative Error

Absolute Error is the numerical difference between the true value and the observed or approximate value. Relative Error expresses this difference in relation to the true value and is often presented as a percentage. These measures help determine the magnitude and significance of an error.

Example: If the true value is 500 and the observed value is 490, the absolute error is 10. The relative error is 10 ÷ 500 × 100 = 2%. Thus, relative error provides a useful measure of accuracy.

A type I error (or error of the first kind) is the incorrect rejection of a true null hypothesis. Usually, a type I error leads one to conclude that a supposed effect or relationship exists when in fact it doesn’t. Examples of type I errors include a test that shows a patient to have a disease when in fact the patient does not have the disease, a fire alarm going on indicating a fire when in fact there is no fire, or an experiment indicating that a medical treatment should cure a disease when in fact it does not.
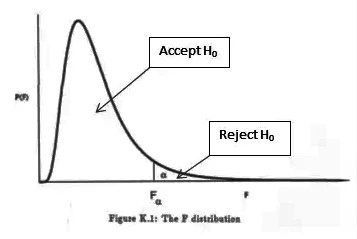
A type II error (or error of the second kind) is the failure to reject a false null hypothesis. Examples of type II errors would be a blood test failing to detect the disease it was designed to detect, in a patient who really has the disease; a fire breaking out and the fire alarm does not ring; or a clinical trial of a medical treatment failing to show that the treatment works when really it does.

When comparing two means, concluding the means were different when in reality they were not different would be a Type I error; concluding the means were not different when in reality they were different would be a Type II error. Various extensions have been suggested as “Type III errors”, though none have wide use.
All statistical hypothesis tests have a probability of making type I and type II errors. For example, all blood tests for a disease will falsely detect the disease in some proportion of people who don’t have it, and will fail to detect the disease in some proportion of people who do have it. A test’s probability of making a type I error is denoted by α. A test’s probability of making a type II error is denoted by β. These error rates are traded off against each other: for any given sample set, the effort to reduce one type of error generally results in increasing the other type of error. For a given test, the only way to reduce both error rates is to increase the sample size, and this may not be feasible.

Type I error

A type I error occurs when the null hypothesis (H0) is true, but is rejected. It is asserting something that is absent, a false hit. A type I error may be likened to a so-called false positive (a result that indicates that a given condition is present when it actually is not present).

In terms of folk tales, an investigator may see the wolf when there is none (“raising a false alarm”). Where the null hypothesis, H0, is: no wolf.

The type I error rate or significance level is the probability of rejecting the null hypothesis given that it is true. It is denoted by the Greek letter α (alpha) and is also called the alpha level. Often, the significance level is set to 0.05 (5%), implying that it is acceptable to have a 5% probability of incorrectly rejecting the null hypothesis.

Type II error

A type II error occurs when the null hypothesis is false, but erroneously fails to be rejected. It is failing to assert what is present, a miss. A type II error may be compared with a so-called false negative (where an actual ‘hit’ was disregarded by the test and seen as a ‘miss’) in a test checking for a single condition with a definitive result of true or false. A Type II error is committed when we fail to believe a true alternative hypothesis.

In terms of folk tales, an investigator may fail to see the wolf when it is present (“failing to raise an alarm”). Again, H0: no wolf.

The rate of the type II error is denoted by the Greek letter β (beta) and related to the power of a test (which equals 1−β).

Table of error types
Null hypothesis (H0) is
True False
Decision
about null
hypothesis (H0)
Don’t
reject
Correct inference

(true negative)

(probability = 1−α)

Type II error

(false negative)

(probability = β) 

Reject Type I error

(false positive)

(probability = α) 

Correct inference

(true positive)

(probability = 1−β)

Error Rate

A perfect test would have zero false positives and zero false negatives. However, statistical methods are probabilistic, and it cannot be known for certain whether statistical conclusions are correct. Whenever there is uncertainty, there is the possibility of making an error. Considering this nature of statistics science, all statistical hypothesis tests have a probability of making type I and type II errors.

  • The type I error rate or significance level is the probability of rejecting the null hypothesis given that it is true. It is denoted by the Greek letter α (alpha) and is also called the alpha level. Usually, the significance level is set to 0.05 (5%), implying that it is acceptable to have a 5% probability of incorrectly rejecting the true null hypothesis.
  • The rate of the type II error is denoted by the Greek letter β (beta) and related to the power of a test, which equals 1−β.

These two types of error rates are traded off against each other: for any given sample set, the effort to reduce one type of error generally results in increasing the other type of error.

The quality of hypothesis test

Error 2

The same idea can be expressed in terms of the rate of correct results and therefore used to minimize error rates and improve the quality of hypothesis test. To reduce the probability of committing a Type I error, making the alpha (p) value more stringent is quite simple and efficient. To decrease the probability of committing a Type II error, which is closely associated with analyses’ power, either increasing the test’s sample size or relaxing the alpha level could increase the analyses’ power. A test statistic is robust if the Type I error rate is controlled.

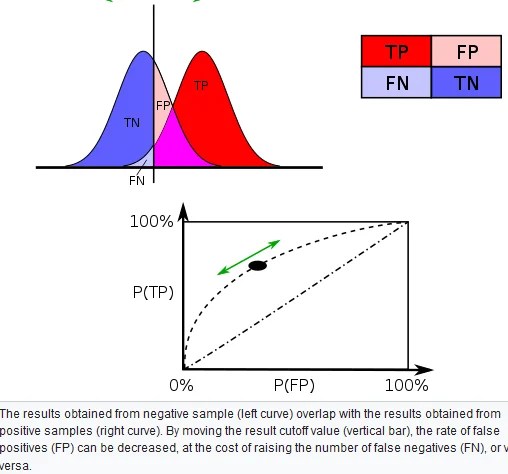
Varying different threshold (cut-off) value could also be used to make the test either more specific or more sensitive, which in turn elevates the test quality. For example, imagine a medical test, in which experimenter might measure the concentration of a certain protein in the blood sample. Experimenter could adjust the threshold (black vertical line in the figure) and people would be diagnosed as having diseases if any number is detected above this certain threshold. According to the image, changing the threshold would result in changes in false positives and false negatives, corresponding to movement on the curve.

Approximation

Too many results are only approximate; meaning they are similar but not equal to the actual result. An approximation can turn a complex calculation into a less complicated one.

For instance, the calculation of a Poisson distribution is more complicated than that of a binomial distribution. If both only differ slightly in their end result, it is permissible to approximate the Poisson distribution by a more simple-to-use binomial distribution. Prerequisite for such approximations is a sufficient sample size. In this example, at least 100 respondents are necessary in order to justify a sufficient proximity of the two distributions. An approximation based on too small a sample can lead to errors, for example, an accidental similarity of the two distributions.

The binomial distribution can be used to solve problems such as, “If a fair coin is flipped 100 times, what is the probability of getting 60 or more heads?” The probability of exactly x heads out of N

Flips is computed using the formula:

P(x)=[N!/(x!(N−x)!)]*πx(1−π)^N−x

where x

is the number of heads (60), N is the number of flips (100), and π

is the probability of a head (0.5). Therefore, to solve this problem, you compute the probability of 60 heads, then the probability of 61 heads, 62 heads, etc, and add up all these probabilities.

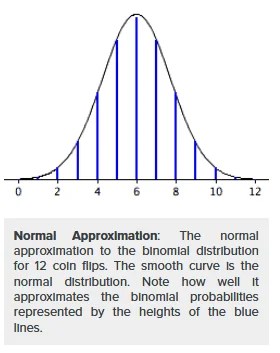
Abraham de Moivre, an 18th century statistician and consultant to gamblers, was often called upon to make these lengthy computations. de Moivre noted that when the number of events (coin flips) increased, the shape of the binomial distribution approached a very smooth curve. Therefore, de Moivre reasoned that if he could find a mathematical expression for this curve, he would be able to solve problems such as finding the probability of 60 or more heads out of 100 coin flips much more easily. This is exactly what he did, and the curve he discovered is now called the normal curve. The process of using this curve to estimate the shape of the binomial distribution is known as normal approximation.
Sixty two percent of 12th graders attend school in a particular urban school district. If a sample of 500 12th grade children are selected, find the probability that at least 290 are actually enrolled in school.

Part 1: Making the Calculations

Step 1: Find p,q, and n

  • The probability p is given in the question as 62%, or 0.62
  • To find q, subtract p from 1: 1 – 0.62 = 0.38
  • The sample size n is given in the question as 500

Step 2: Figure out if you can use the normal approximation to the binomial. If n * p and n * q are greater than 5, then you can use the approximation

n * p = 310 and n * q = 190.

These are both larger than 5, so you can use the normal approximation to the binomial for this question.

Step 3: Find the mean, μ by multiplying n and p

n * p = 310

(You actually figured that out in Step 2!).

Step 4: Multiply step 3 by q 

310 * 0.38 = 117.8.

Step 5: Take the square root of step 4 to get the standard deviation, σ

√(117.8)=10.85

Note: The formula for the standard deviation for a binomial is √(n*p*q)

Part 2: Using the Continuity Correction Factor

Step 6: Write the problem using correct notation. The question stated that we need to “find the probability that at least 290 are actually enrolled in school”. 

P(X ≥ 290)

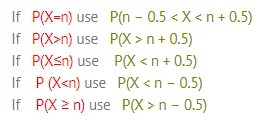
Step 7: Rewrite the problem using the continuity correction factor

P (X ≥ 290-0.5) = P (X ≥ 289.5)

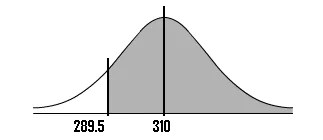
Step 8: Draw a diagram with the mean in the center. Shade the area that corresponds to the probability you are looking for. We’re looking for X ≥ 289.5, so:
Step 9: Find the z-score

You can find this by subtracting the mean (μ) from the probability you found in step 7, then dividing by the standard deviation (σ):

(289.5 – 310) / 10.85 = -1.89

Step 10: Look up the z-value in the z-table

The area for -1.89 is 0.4706.

Step 11: Add .5 to your answer in step 10 to find the total area pictured

0.4706 + 0.5 = 0.9706.
That’s it! The probability is .9706, or 97.06%.

Difference between Salary and Wages

Salary

Salary is a fixed regular payment, typically paid on a monthly basis, for the performance of work or services. Unlike wages, which are often calculated on an hourly or weekly basis, salaries provide employees with a consistent and predetermined amount of compensation, regardless of the number of hours worked.

Components:

  1. Base Salary:

The core, fixed amount of money paid to an employee on a regular basis, forming the foundation of the overall salary. Reflects the employee’s role, responsibilities, and experience.

  1. Bonuses:

Additional monetary rewards provided to employees, often based on performance, company profits, or specific achievements. Motivates employees and aligns their efforts with organizational goals.

  1. Allowances:

Supplementary payments intended to cover specific expenses or costs related to the job, such as housing, transportation, or meals. Addresses the financial impact of job-related requirements.

  1. Benefits:

Non-monetary compensation, including healthcare, retirement plans, and other perks, provided to enhance employees’ overall well-being. Contributes to employee satisfaction and work-life balance.

  1. Overtime Pay:

Additional compensation for hours worked beyond the standard workweek, often calculated at a higher rate than the regular hourly pay. Compensates employees for extra effort and time invested in work.

  1. Performance–Based Incentives:

Variable payments linked to individual or team performance, encouraging employees to achieve specific goals or targets. Aligns compensation with results and fosters a performance-driven culture.

  1. Profit Sharing:

Sharing company profits with employees, providing them with a stake in the organization’s financial success. Aligns the interests of employees with the overall success of the business.

  1. Commissions:

Payments based on sales or revenue generated by an employee, common in roles with direct sales responsibilities. Rewards employees for their contribution to revenue generation.

  1. Retirement Benefits:

Contributions made by the employer to retirement plans, such as 401(k) or pension schemes. Supports employees in building financial security for their post-work years.

  • Stock Options:

The right to purchase company stock at a predetermined price, offering employees a share in the company’s ownership. Aligns employees’ interests with the company’s long-term success.

  • Education and Training Support:

Financial assistance provided by the employer for the education and skill development of employees. Promotes continuous learning and professional growth.

  • Health and Wellness Programs:

Initiatives and benefits aimed at promoting employees’ physical and mental well-being. Enhances employee health, productivity, and job satisfaction.

  • Vacation and Leave Benefits:

Paid time off from work, including vacation days, holidays, and other types of leave. Supports work-life balance and employee well-being.

  • Severance Pay:

Compensation provided to employees upon termination of employment, often based on factors like length of service. Offers financial support during transitions and provides a safety net for employees.

  • Other Perquisites (Perks):

Additional benefits or privileges provided to employees, such as company cars, memberships, or flexible work arrangements. Enhances the overall employment experience and contributes to employee satisfaction.

Wages

Wages refer to the compensation paid to an employee for the hours worked or services rendered, often calculated on an hourly, daily, or weekly basis. Unlike salaries, which provide a fixed amount irrespective of hours worked, wages are directly tied to the time spent on the job.

Components:

  1. Hourly Rate:

The amount paid for each hour worked by an employee. Forms the basic unit for calculating wages based on time.

  1. Overtime Pay:

Additional compensation provided for hours worked beyond the standard workweek or regular working hours. Compensates employees for extra effort and time beyond the standard working hours.

  1. Piece-Rate Pay:

Compensation based on the number of units produced or tasks completed. Directly links pay to productivity and output.

  1. Commission:

A percentage of sales or revenue earned by an employee, common in sales roles. Rewards employees based on their contribution to generating business.

  1. Tips and Gratuities:

Additional payments received by employees, often in service industries, as a form of appreciation from customers. Augments income and is often based on customer satisfaction.

  1. Holiday Pay:

Compensation for hours worked on recognized holidays. Encourages employees to work during holiday periods and compensates for the disruption to personal time.

  1. Shift Differentials:

Additional pay for working shifts that fall outside regular daytime hours. Compensates for inconveniences associated with non-standard working hours.

  1. Bonuses (Variable):

Additional payments beyond regular wages, often tied to performance, project completion, or other achievements. Acts as an incentive and recognition for exceptional contributions.

  1. Piecework Bonuses:

Additional payments for meeting or exceeding production targets in piecework arrangements.  Motivates employees to achieve or surpass production goals.

  • Travel Allowances:

Compensation for work-related travel expenses, such as mileage or transportation costs. Addresses additional costs incurred while traveling for work.

  • Uniform or Tool Allowances:

Payments provided to cover the cost of uniforms, tools, or equipment required for the job. Supports employees in meeting job-specific requirements.

  • Incentive Pay:

Additional compensation tied to achieving specific targets, often related to productivity or efficiency. Encourages employees to meet or exceed performance expectations.

  • Danger Pay:

Additional compensation for employees working in hazardous conditions or environments. Recognizes the risks associated with certain jobs.

  • Call-out Pay:

Compensation for employees called in to work outside their regular schedule, often applicable to on-call positions. Compensates for the inconvenience of being available on short notice.

  • Benefits (Limited):

Some wage-related benefits, such as health insurance or retirement contributions, may be provided, but to a lesser extent compared to salary packages. Enhances the overall compensation package, albeit on a more limited scale compared to salaried positions.

Difference between Salary and Wages

Basis of Comparison

Salary

Wages

Payment Frequency Monthly Hourly or Weekly
Consistency Fixed, stable Variable, fluctuates
Calculation Basis Annual rate / 12 Hourly rate x Hours worked
Overtime Compensation Typically included Paid separately
Employment Level Often for salaried employees Common for hourly workers
Work Hours Impact Irrelevant to pay Directly affects earnings
Benefits Often includes benefits Limited or no benefits
Professional Positions Common for white-collar jobs Common for blue-collar jobs
Skill-Based Reflects skills and qualifications Often skill-independent
Administrative Work Common for managerial roles Common for administrative roles
Unionization Less common for unionized jobs Common in unionized settings
Job Complexity Reflects job responsibilities May not directly reflect complexity
Job Stability Generally perceived as stable Can be influenced by job market
Performance Impact Less direct impact on pay Directly impacts pay through hours
Perception in Society Often associated with higher status May not carry the same status

Effect of Various Labour Laws on Wages

Labour laws play a pivotal role in shaping the employment landscape and influencing wage structures within a country. These laws are designed to regulate the relationship between employers and employees, ensuring fair treatment, safe working conditions, and just compensation. The impact of labour laws on wages is multifaceted, encompassing aspects such as minimum wage regulations, overtime pay, equal pay for equal work, and various other provisions aimed at protecting workers’ rights. Labour laws wield substantial influence over wage structures, seeking to establish a balance between the interests of employers and the rights of workers. While these laws are crafted with the intention of promoting fairness, equity, and worker protection, their impact is subject to various challenges. Striking the right balance between regulation and flexibility, addressing regional disparities, and adapting to evolving workforce dynamics are ongoing challenges for policymakers and businesses alike. Nevertheless, a well-crafted and effectively enforced legal framework is essential for fostering a work environment where wages are just, working conditions are safe, and the rights of workers are upheld.

Minimum Wage Regulations:

Intended Benefits:

  • Fair Compensation:

Minimum wage laws are enacted to ensure that workers receive a baseline level of compensation deemed necessary for a decent standard of living. This promotes economic justice by preventing the exploitation of vulnerable workers.

  • Poverty Alleviation:

Setting a minimum wage helps lift workers out of poverty, providing them with the means to cover essential living expenses. This has broader societal implications, contributing to poverty reduction.

Challenges:

  • Impact on Small Businesses:

Critics argue that higher minimum wages can impose financial burdens on small businesses, potentially leading to job cuts or increased prices for goods and services.

  • Regional Disparities:

Minimum wage regulations may not adequately account for regional variations in living costs, creating challenges in finding a one-size-fits-all solution that addresses the diverse economic landscapes within a country.

Equal Pay for Equal Work:

Intended Benefits:

  • Gender Pay Equity:

Labour laws promoting equal pay for equal work aim to eliminate gender-based wage disparities. This contributes to gender equality in the workplace, fostering a fair and inclusive environment.

  • Fair Treatment:

The principle of equal pay extends to all forms of discrimination, ensuring that employees are not subjected to wage disparities based on race, ethnicity, or other protected characteristics.

Challenges:

  • Data Accuracy and Transparency:

Implementing equal pay measures requires accurate and transparent data on employees’ roles, responsibilities, and compensation. Some organizations may face challenges in collecting and disclosing this information.

  • Subjectivity in Job Evaluation:

Determining what constitutes “equal work” can be subjective, and variations in job roles may complicate efforts to ensure equal pay. Standardizing job evaluation methodologies is a complex task.

Overtime Pay and Working Hours:

Intended Benefits:

  • Fair Compensation for Extra Effort:

Overtime pay regulations are intended to compensate employees for working beyond standard hours. This ensures that employees are fairly rewarded for their additional efforts.

  • Limiting Exploitative Practices:

Labour laws prescribing limits on working hours and overtime seek to prevent exploitative practices and promote a healthy work-life balance. This contributes to employee well-being and job satisfaction.

Challenges:

  • Operational Constraints:

Industries with fluctuating workloads may face challenges in accommodating strict working hour regulations. Flexibility in working hours may be crucial for certain sectors.

  • Compliance Monitoring:

Ensuring compliance with overtime regulations requires effective monitoring mechanisms, which can be resource-intensive for regulatory authorities.

Collective Bargaining and Trade Union Laws:

Intended Benefits:

  • Negotiating Power for Workers:

Collective bargaining laws empower workers to negotiate wages and working conditions collectively. This enhances their bargaining power, leading to more equitable agreements with employers.

  • Labour Market Stability:

By providing a structured framework for negotiations, collective bargaining laws contribute to labour market stability, reducing the likelihood of widespread strikes or industrial unrest.

Challenges:

  • Power Imbalances:

In situations where there is a significant power imbalance between employers and workers, collective bargaining may be challenging. This is particularly relevant in industries with limited unionization.

  • Potential for Disruption:

While collective bargaining aims for mutually beneficial agreements, disputes can arise, leading to work stoppages and disruptions that impact both workers and employers.

Social Security and Benefits:

Intended Benefits:

  • Worker Well-being:

Labour laws pertaining to social security and benefits, such as healthcare, retirement plans, and disability insurance, aim to enhance the overall well-being of workers.

  • Attracting and Retaining Talent:

Competitive benefit packages can attract skilled workers and contribute to employee retention. Labour laws often prescribe minimum standards for these benefits.

Challenges:

  • Financial Strain on Employers:

Mandating certain benefits can place a financial burden on employers, especially smaller businesses. Striking a balance between worker welfare and business viability is crucial.

  • Changing Workforce Dynamics:

The rise of the gig economy and non-traditional employment arrangements poses challenges in adapting social security and benefit regulations to accommodate diverse work structures.

Child Labour and Forced Labour Laws:

Intended Benefits:

  • Protecting Vulnerable Populations:

Laws prohibiting child labour and forced labour are designed to protect vulnerable populations from exploitation. These regulations prioritize the well-being of children and individuals subjected to coercion.

  • Ethical Business Practices:

Compliance with child labour and forced labour laws is integral to promoting ethical business practices. Organizations adhering to these regulations contribute to global efforts against human rights abuses.

Challenges:

  • Enforcement and Monitoring:

Effectively enforcing laws against child labour and forced labour requires robust monitoring systems, especially in industries where such practices may be prevalent.

  • Global Supply Chain Complexity:

Addressing child labour and forced labour becomes complex in global supply chains, where products may pass through multiple jurisdictions with varying regulations and enforcement capacities.

The Impact of Information Technology in Retailing

Information technology (IT) has had a profound impact on the retail industry, transforming various aspects of the business from operations and customer interactions to supply chain management and overall strategic decision-making. The integration of IT in retailing has led to increased efficiency, improved customer experiences, and enhanced competitiveness.

Technology has always played a major role, creating a massive impact in reviving the retail industry, bringing it reknown and repute. It is assisting retailers to become highly-equipped and advanced in the way they enhance the experience for consumers.

The Industry Growth

As per Euromonitor International’s recent retailing research, the market size of Modern Grocery Retailers in retail value sales at current prices (including inflation) was Rs 603 billion in 2017. Modern Grocery Retailers grew at 13.2 percent in 2016- 17. The category is forecast to grow by CAGR 9.2 percent through 2017-22.

The search for a one-stop shopping destination keeps making consumers shift from traditional to modern retailing stores. Modern retail stores attract footfalls in their physical store in Tier I and Tier II equally, albeit for different reasons. Aspirational Tier II consumers look at modern retailers as places to experience the new age retail. Equally Tier II & III cities have lucrative geographies for expansion of modern retail.

Retailers are tapping on to this new market of aspirational consumers increasingly. The lack of presence of most of the international and a major portion of national brands in these areas, have led consumers to resort to online channels in Tier II cities.

IT in Retail Importance

  • To collect and analyze customer data while enhancing differentiation.
  • To increase the company’s ability to respond to the evolving marketplace through enhanced speed and flexibility.
  • To work effectively; retailers need one system working across stores (or even across national borders) to make sure the most effective use of stock and improve business processes.

Helpful for Retailer:

  • Transparency and tracking

Retailers must increase transparency between systems, as well as obtain better tracking to integrate systems from manufacturer through to the consumer while obtaining customer and sales information.

  • Customer data

Many retailers struggle with information overload because they’re required to collect and sift through mass amounts of data, then convert it into useful information in a customer-centric industry.

  • PCI Security Compliance

PCI Security Compliance addresses the retailer’s internal security setup and practices, in order to mitigate payment security risks. Every business engaged in credit card payment processing is required to comply with PCI Security Standards. If a retailer collects or stores credit card information that becomes compromised, the retailer may lose the ability to accept credit card payments. Other possible consequences include lawsuits, insurance claims, cancelled accounts, and government fines.

  • Global data synchronization

Due to radio frequency identification/electronic product coding, the entire supply chain has become more intelligent. Retailers must enable the use of real-time data to watch inventory levels. In addition, radio frequency identification tagging positions the company to be able to safeguard its shipments by allowing products to be tracked from manufacturer through the entire supply chain.

Advantages of Information Technology in Retailing

  • Automating processes

Automating a process render many advantages to the retailers. It reduces costs, increases accuracy, reduces processing times, enables quick decision and speeds up customer service.

For example, EPOS (electronic point of sales) uses scanning systems. It ensures accurate prices, enables checkout staff to work faster, and it eliminates the need to fix price label to goods. All these factors reduce the cost considerably.

  • Collecting data about the customer

The purchase details of individual shoppers are collected and analyzed. Product extensions and promotions are based on the analysis of purchasing patterns of different types of shoppers.

Demographic information about the customers is known from a loyalty card database. The entries in the loyalty card are related to transactions data furnished by EPOS. These data can be further used to profile a customer base. This facilitates specific offers to be made to certain types of customers.

A retailer may send mail order catalogue to all loyalty card holders who have bought in the previous year. Moreover, internet and e-commerce sites use previous transactions information to personalize their sites for each shopper by offering them product items that have been related to their last few transactions. They automatically greet them by name when they enter the site.

  • Feedback on marketing decisions

Analysis of EPOS data helps the retailer in knowing the effect of promotion, prices, new products and packaging changes. Retailers can assess the impact of changes in layout or merchandising of stores in terms of category sales, competitor brands, gross profit and sales in the store. Innovative product ideas may be tested against the realities prevailing in the market. In short, the EPOS data analysis helps the company in

  • Evaluating its promotions
  • Calculating customer price responsiveness for core and seasonal products.
  • Predicting the outcome of its newly adopted policies.
  • Planning its promotional measures.


  • Communication

The stores manager indulges in effective communication with his suppliers. He sends documents such as purchase orders, stock and sales information over third party communication networks. This is electronic commerce. This method works fast and costs less. It is sufficient for stores to place their orders one or two days and in advance against seven days earlier in the traditional paper based method.

Store computers transmit EPOS data to the head office on daily basis. So, the senior manager is able to assess the performance of every store and product group.

Stock replenishment is done automatically. The computer system receives daily EPOS data from each store and next day’s stock requirements are known.

The system automatically sends the requirement electronically overnight to the distribution centre. So, delivery of merchandise is possible the very next day.

Effective communication reduces the lead time. It is the time taken between sending an order and receiving the merchandise.

Tools for Planning the business

(i) With the use of sophisticated computer software packages, retailers are able to

  • Plan, budget and forecast,
  • Choose the most successful location; and
  • Control their business.

(ii) Model decision making, statistical packages of sales forecast and data mining tools are available for retailers.

(iii) Retailers can also use geographic information systems (GIS).

(iv) Socio demographic data along with company transactions data and intelligent analytical tools are used to forecast sales in different stores.

  • Adding value to the retail transaction

Customers prefer IT assisted transactions to traditional retailing because IT assisted transactions provide speed, accuracy and convenience. For example, ATMs are used at any time of day. Thus, use of IT adds value to retailing.

  • Technology enabled shopping

Selling goods over the internet is becoming popular. Electronic means of selling include the following.

  • Products: Grocery, clothing, footwear, music, books, videos, cameras, photographic goods, computer hardware and software, pharmacy goods etc.
  • Services: Retail banking, personal insurance, financial service, real estate, stocks and shares, Tourism, florists, entertainment tickets, virtual education, information services, etc.

Thus, IT is transforming the nature of products, processes, companies, industries and even competition itself. The spectacular reach of IT is widely accepted today.

Components

  • E-commerce and Online Retailing:

Information technology has fueled the growth of e-commerce, enabling retailers to establish online platforms for buying and selling products. E-commerce platforms provide a convenient and accessible way for customers to browse, shop, and make transactions.

  • Point-of-Sale (POS) Systems:

POS systems, powered by IT, have replaced traditional cash registers. These systems streamline transactions, track sales, manage inventory, and provide valuable data for decision-making.

  • Supply Chain Management:

IT has revolutionized supply chain management in retail. Technologies like RFID (Radio-Frequency Identification), barcoding, and advanced analytics help in real-time tracking of inventory, reducing stockouts and overstock situations.

  • Customer Relationship Management (CRM):

CRM systems leverage IT to manage and analyze customer data. Retailers can personalize marketing efforts, track customer interactions, and enhance customer loyalty through targeted promotions and communication.

  • Data Analytics and Business Intelligence:

Retailers use data analytics and business intelligence tools to gain insights into consumer behavior, market trends, and operational efficiency. This data-driven approach supports informed decision-making and strategy formulation.

  • Mobile Commerce (m–commerce):

The rise of smartphones and mobile apps has given birth to mobile commerce. Retailers leverage IT to create mobile-friendly platforms, enabling customers to shop, compare prices, and make transactions using their mobile devices.

  • Augmented Reality (AR) and Virtual Reality (VR):

AR and VR technologies enhance the shopping experience. Retailers use these technologies for virtual try-ons, interactive product displays, and creating immersive environments that engage customers.

  • Social Media Integration:

IT facilitates the integration of social media platforms into retail strategies. Retailers use social media for marketing, customer engagement, and gathering insights into consumer preferences.

  • Automated Checkout Systems:

Self-checkout systems and automated kiosks, driven by IT, offer an efficient and convenient alternative for customers. These systems reduce wait times and enhance the overall shopping experience.

  • Personalized Marketing:

IT enables retailers to implement personalized marketing strategies. Through data analysis, retailers can create targeted promotions, personalized recommendations, and individualized communication based on customer preferences.

  • Cloud Computing:

Cloud computing technologies have streamlined data storage, processing, and collaboration. Retailers use cloud-based solutions for inventory management, data analytics, and overall business operations.

  • Artificial Intelligence (AI) and Machine Learning (ML):

AI and ML technologies are used for predictive analytics, demand forecasting, chatbots for customer service, and enhancing the overall efficiency of retail operations.

  • Voice Commerce:

 Voice-activated technologies, such as virtual assistants, have introduced new ways of shopping. Customers can use voice commands to search for products, place orders, and receive personalized recommendations.

  • Cybersecurity:

As retail operations become more digitized, the importance of cybersecurity has grown. IT is crucial in implementing robust security measures to protect customer data and secure online transactions.

  • Internet of Things (IoT):

IoT devices, such as smart shelves and connected devices in stores, contribute to real-time monitoring of inventory, temperature control, and other operational aspects, improving overall efficiency.

  • Feedback and Reviews Platforms:

IT facilitates the collection and analysis of customer feedback and reviews.

Limitations of Using Information Technology in Retailing

  • Originally IT was used by retailers to automate control services such as finance, pay roll, and management accounts. Electronic point of sales systems can be afford only by a very few department stores. Basically, retailing is a highly dispersed business. Retailers have to incur enormous amount of expenditure on installation of IT equipment in their retail business.

  • Retailing involves a wide array of products. So, a complex system is required to handle a large number of product lines.
  •  In retail stores, staff may have limited knowledge about computers. So, computer specialists are to be employed to deal with the automation process. Only the largest retailers can afford to employ technically qualified people.
  • The costs of routine investment in automation process is very high.
  • Many IT projects fail and the risk of such failure is too high for retailers.
  • According to Prof. John Sawson, many retailers concentrate on operational improvement rather than transformational ones. The expected pay off from IT has not been fully realized. Retailers devote only a small amount of their budgets to IT.
  • Getting the full benefits of IT may actually take a longer time. Retailers should learn how best to exploit the new systems. Many U.K. grocers invested in EPOS in the 1980s. But only a few made effective use of information about customer’s shopping behavior. Only after making heavy investments and learning from experience, retailers could create IT based stock replenishment system.
  • IT alone has not produced performance advantage in the retail industry.

Inspite of the above limitations in using Information Technology for competitive advantages, firms have gained advantages such as flexible culture, strategic planning and improved supplier relationships. Advantage lies in people and systems rather than systems alone. To derive full competitive advantage of IT requires long-term investment.

Social Issues in Retailing in India

Retailing in India, like in many other countries, is influenced by a variety of social issues that impact both the industry and consumers. These issues often reflect the broader social and cultural context of the country.

Addressing these social issues requires a holistic approach from retailers, encompassing ethical business practices, cultural sensitivity, and responsiveness to changing consumer dynamics. By aligning their strategies with the social fabric of India, retailers can build stronger connections with their customer base and contribute positively to society. This involves not only understanding the diverse needs of consumers but also actively participating in social initiatives that align with the values of the community.

  • Diversity and Cultural Sensitivity:

India is a diverse country with multiple languages, cultures, and traditions. Retailers need to be sensitive to this diversity in their marketing strategies, product offerings, and customer interactions. Cultural insensitivity can lead to backlash and negatively impact a brand’s image.

  • Consumer Behavior and Preferences:

Consumer preferences in India can vary significantly across regions and demographic segments. Retailers must stay attuned to evolving consumer trends, preferences, and purchasing behaviors to tailor their offerings and marketing strategies effectively.

  • Gender Sensitivity:

Gender plays a significant role in shaping consumer behavior. Retailers need to be aware of gender-related social issues and promote inclusivity in their marketing and advertising. Creating gender-neutral spaces and products can be essential for attracting a diverse customer base.

  • Economic Disparities:

India faces economic disparities, with a significant portion of the population belonging to lower-income segments. Retailers need to balance their product offerings to cater to diverse economic groups. Strategies like affordable pricing, value for money, and inclusive marketing are crucial.

  • Ethical Sourcing and Fair Trade:

There is an increasing awareness among Indian consumers about the ethical sourcing of products and fair trade practices. Retailers are under scrutiny to ensure that their supply chains adhere to ethical standards, and they are expected to be transparent about their sourcing practices.

  • Digital Divide:

While there is a growing trend of digitalization in urban areas, rural parts of India may still face challenges related to digital access and literacy. Retailers need to adopt strategies that cater to diverse digital maturity levels among consumers.

  • Changing Lifestyle and Aspirations:

India is experiencing a significant shift in lifestyle and aspirations, especially among the younger population. Retailers must keep pace with changing consumer expectations, including a demand for international brands, experiential shopping, and lifestyle products.

  • Health and Wellness Trends:

There is an increasing awareness of health and wellness in India, leading to a growing demand for organic, sustainable, and health-conscious products. Retailers need to adapt to these trends by offering healthier options and providing transparent information about product ingredients.

  • Social Media Influence:

Social media plays a substantial role in shaping consumer opinions and trends. Retailers need to have a robust social media strategy to engage with consumers, manage brand perception, and stay connected with the younger demographic.

  • Sustainability and Environmental Concerns:

Environmental consciousness is on the rise, and consumers are increasingly looking for sustainable and eco-friendly products. Retailers need to incorporate sustainable practices in their operations, such as reducing packaging waste and promoting environmentally friendly products.

  • Inclusivity and Accessibility:

Retail spaces and services need to be inclusive and accessible to people with disabilities. Ensuring that stores are wheelchair-friendly, providing assistance for visually impaired individuals, and offering inclusive product ranges are important considerations.

  • Rural-Urban Dynamics:

Retailers need to recognize the unique dynamics between rural and urban consumers. While urban consumers may seek convenience and a wide range of products, rural consumers may have different preferences and purchasing patterns.

Ethical Issues in Retailing in India

Ethical issues in retailing are critical considerations that impact the relationships between businesses, consumers, and the broader society. Maintaining ethical standards is not only a legal requirement but also essential for building trust, ensuring fair practices, and sustaining a positive reputation.

Ethics in business have become an essential topic of discussion. In retailing, retailers want to earn maximum profit by providing satisfaction to their customers with ethical means. Some certain laws and regulations govern the retail sector.

Following these laws are important and beneficial for the organizations. In this article, you will learn about ethical behavior in the retail sector and its importance.

Ethics can be defined as the moral principles for the behavior of a person or an organization to conduct activities. Business ethics tell the difference between right and wrong activities. However, ethical conduct in business is not as simple as it seems. There are various complexities when It comes to ethical conduct.

Ethical order ensures a sense of order and justice in an organization. The concepts like Corporate Social Responsibility is introduced in the retailing sector. The CSR is related to the ethical expression to conduct business. Retailing is the end unit of the Supply chain.

Customers directly interact with retailers. Therefore, it is important that retailers act ethically as they impact the lives of many people. Ethical practices are not only moral responsibility of a retailer, but it has great importance for the retail business. Let us learn about them one by one.

Adopting an ethical approach in retailing is not only a legal obligation but also a strategic imperative. Ethical behavior builds trust with consumers, fosters a positive workplace culture, and contributes to the long-term sustainability and success of a retail business. By addressing these ethical issues, retailers can demonstrate a commitment to integrity, responsibility, and the well-being of both consumers and the broader community.

Fair Pricing and Transparency:

Deceptive pricing practices, hidden fees, and misleading discounts can erode consumer trust.

  • Ethical Approach: Retailers should ensure transparency in pricing, avoid misleading promotions, and provide clear information about product costs.

Product Quality and Safety:

Selling substandard or unsafe products can harm consumers and damage a retailer’s reputation.

  • Ethical Approach: Retailers must adhere to quality standards, conduct product testing, and promptly recall defective items.

Supply Chain Ethics:

Unethical practices within the supply chain, such as exploitation of labor, child labor, or environmental violations, can tarnish a retailer’s reputation.

  • Ethical Approach: Retailers should implement ethical sourcing policies, ensure fair labor practices, and promote sustainable and responsible supply chain management.

Employee Treatment and Fair Labor Practices:

Unfair wages, poor working conditions, and lack of employee benefits can lead to ethical concerns.

  • Ethical Approach: Retailers should prioritize fair wages, provide a safe and healthy work environment, and offer employee benefits to promote overall well-being.

Customer Privacy and Data Security:

Mishandling customer data, privacy breaches, and unauthorized use of personal information can lead to ethical violations.

  • Ethical Approach: Retailers must prioritize customer privacy, implement robust data security measures, and adhere to data protection laws.

Truth in Advertising:

False or misleading advertising can deceive consumers and harm a retailer’s credibility.

  • Ethical Approach: Retailers should ensure that advertising is truthful, accurate, and does not exaggerate product capabilities.

Inclusivity and Diversity:

Discrimination or lack of inclusivity in hiring practices or product representation can be ethically problematic.

  • Ethical Approach: Retailers should foster diversity and inclusion, both in their workforce and in the representation of various demographics in marketing and product offerings.

Environmental Sustainability:

Irresponsible environmental practices, such as excessive packaging or contributing to pollution, raise ethical concerns.

  • Ethical Approach: Retailers should adopt sustainable practices, reduce environmental impact, and promote eco-friendly products.

Social Responsibility:

Neglecting social responsibility, such as community engagement or charitable initiatives, can be viewed as ethically irresponsible.

  • Ethical Approach: Retailers should actively engage in socially responsible activities, supporting community initiatives and contributing to social causes.

Ethical Marketing:

Manipulative marketing tactics, such as false scarcity or exploiting emotional triggers, can be ethically questionable.

  • Ethical Approach: Retailers should prioritize honesty, integrity, and authenticity in marketing, avoiding manipulative practices.

Fair Competition:

Unfair business practices, such as price fixing or collusion, can harm competition and violate ethical standards.

  • Ethical Approach: Retailers should compete fairly, adhere to antitrust laws, and avoid engaging in anti-competitive behavior.

Product Endorsements and Reviews:

Deceptive product endorsements or fake reviews can mislead consumers.

  • Ethical Approach: Retailers should encourage genuine customer reviews, avoid deceptive endorsements, and maintain the integrity of product recommendations.

Importance of Ethics in Retail

  • Build a Positive Image in society

People who have not much knowledge about the business ethics and rules of business conduct usually prefer to associate with those organizations which have a positive image in society.

Take the example of an IT company Infosys. Infosys is known for its charitable work, good corporate governance, and social responsibility initiatives such as providing scholarship to deserving children and providing medical help to poor elderly people.

People, when learning all about this they built a positive perception about the company.

  1. Ethics helps in satisfying human needs

People, whether they are employee or customers, want to associate with an organization which works with honesty and in a fair manner.

Therefore, the following ethical practices are important if you want to retain customers as well as employees for a long period of time.

  1. Ethics plays an important role in decision making

In everyday life, retailers need to take important decisions for the well-being of the organization. If an organization believe in ethical practices, it tends to make decisions which are in favor of the organization, its employees as well as customers.

A retailer can take fierce decisions in the absence of ethical practices. For example, an organization which does not follow ethical practice can take fierce decisions to tackle competition.

  1. Bringing People together

Employees love and respect organization whose actions are influenced by ethical practices. The organization which practices ethics will never only think about its own but also think about its employees and customers. In this way, a healthy relationship establishes between employees and the owner.

A healthy relationship is important for the well-being of the organization. A happy employee will never betray his organization and consistently take actions to make his organization successful.

  1. Makes society a better place to live

Society will become a better place to live if everyone follows ethical practices. A society where everyone thinks about themselves and take selfish decisions is not a suitable place for people to live. There will always be contradictions between the people.

However, we know very well that no two people can be the same. There will always be people who will indulge in unethical practices. At that time, ethical laws come into action and restrict unethical practices.

  1. Long-term profits

Organizations which practices malice activities might get profit for short period of time, but can’t retain that success for longer period of time and, on the other hand, Organizations which are driven by values and ethics are expected to be profitable for a long time though they might lose money in a short time.

For example, the Tata group faced a great loss of business in the initial 1990s,’ but soon it turns into one of the most profitable organization by not indulging into unethical practices. The company is one of the most successful companies in India and also known for its ethical conduct in business.

In simple words, it can be said that ethics shows the path of right doing to the organization and let it make decisions which are both in favor of its employees as well as customers.

International Perspective in Retail Business

Retail internationalization is the transfer of retail operations outside the home market. It involves the international transfer of retail concepts, management skills, technology and even the buying function.

International trade and commerce has existed for centuries and played a very important part in the World History. However International Retailing has been in existence and has gained ground in the past two to three decades. The economic boom in several countries, coupled with globalization have given way to Organizations looking at setting up retailing across borders. The advent of internet and multimedia has further changed the dimensions as far as International Retailing is concerned.

The international perspective in retail business involves understanding and navigating the complexities of operating in diverse global markets. Retailers expanding internationally must consider cultural nuances, regulatory environments, consumer behaviors, and economic conditions unique to each country.

The international perspective in retail business involves a nuanced understanding of diverse markets and the ability to adapt strategies to local conditions. Successful global retailers prioritize cultural sensitivity, comply with local regulations, and leverage technology to navigate the complexities of operating on a global scale. By combining a deep understanding of local markets with a strategic and flexible approach, retailers can establish a strong international presence and capitalize on global opportunities.

Factors involved in International Retailing

A careful examination of the definition for international retailing reveals certain concepts which are key to the process of international retailing. These include operations, concepts, management expertise, technology and buying.

  1. Operations

Retail internationalization is the expansion of a retailer’s operations into a foreign market. The store format may or may not be similar to that in the home market. Identical operations may well trade under a different brand than that operated in the domestic market. This decision is largely dependent upon the method of market entry. On the acquisition of a foreign retail operation, the new owner may retain the original brand if it is a respected brand.

For example, in 1999 Wal-Mart (the retail giant) bought UK grocery chain ASDA and retained the original ASDA brand. When a retailer enters a new market by franchise, it may transfer an established domestic brand. Sometimes, a new foreign brand is perceived as more fashionable than its competitors.

  1. Concepts

Retail concepts lay emphasis on innovations in the industry. The self service concept first emerged in California in 1912. Later, the concept was followed in a number of international markets in the next two decades. Similarly, the convenience store format which originated in USA in 1920s was taken up in Europe in the 1970s. Now, the focus in on globalization. The retail concept currently by operated by retailers may also become successful in a foreign market.

The internationalization of “the body shops” popularized the idea of environmentally sensitive products. The success of such concepts have been adopted by competitors spawning of similar retail offers in natural toiletries and cosmetics.

  1. Management expertise

The transfer of concepts is linked with the internationalization of management expertise. This encompassed the internationalization of skills and techniques used in the management of the business. Formation of alliances is an important means of transferring management functions. Retail alliances are prompted by operational synergies, buying economies of scale, increased retailer power over manufacturer, the development of retailer own labels and joint defense building against the market entry of foreign competitors.

International retail alliances are the direct outcome of growing globalization. Successful alliance management rests on close cooperation, communication, synergistic performance measures and an agreement to common objectives.

  1. Technology

Retailers who operate internationally require the use of technology advances. Use IT in central management of retail operations has improved its decision making in areas such as finance, personnel and logistics. Technologies such as EPOS (Electronic Point of Sale) are also used at operational levels of retail stores.

Generally, internationalization will employ relatively advanced technology. It is preferable for retailers to move into a market where they have a technological advantage. Technological advantage in turn, would confer a competitive advantage over indigenous retailers.

  1. Buying

The proportion of consumer expenditure on retail is considerably important. As the population becomes more wealthy a greater proportion of income is spent on non-essentials. Only a small percentage of total spend goes on food and clothing. A higher share of spending power is directed towards non-essentials such as holidays and leisure activities. In retail operations the function of buying is indeed sourcing. Sourcing has had the greatest impact in terms of internationalization.

Alliances are formed to attain efficiency and leverage in sourcing. International retailers use their collective influence with suppliers to reduce prices and improve quality. For example, the European alliance EMD has stated exerting the combined purchasing power of its members as its primary objective.

Reason for Internationalization of retailing

  1. Inadvertent internationalization

Inadvertent internationalization is due to political instability. Sometimes, changes in the demarcation of national borders take place. This may mean a retail company is operating in a different market although its stores have not physically moved. Changes in Eastern Europe are the examples of this kind. The US retailer KMart entered Czechoslovakia. Within a year it found itself operating in two district markets, the Czech and Slovak republics.

  1. Non-commercial reasons

Non-commercial reasons of political, personal, ethical or social responsibility have motivated retailers to move into foreign markets. For example, retailers foray into markets for reasons of social and environmental responsibility. Notably, the Body Shop’s “trade not aid” sourcing policy helped develop infrastructures in order to stabilize economics.

  1. Commercial objectives

It include entering the market which gives retailers competitive edge. Gaining important market knowledge before moving in on a larger scale learning about innovations may be other commercial objectives of retail internationalization.

  1. Government regulations

Government regulations influence the choice of market by retailers. It is not a prerequisite to internationalization. Retailers prefer the markets with fewer restrictions on their growth. Severe regulations at home push retailers into the international arena. Loi Royer in France severely restricted the development of large out of town stores. As a result the French hypermarkets turned to less restrictive markets to continue their expansion.

  1. Growth potential

Retailers seek the best growth potential possible. If they perceive profitable opportunities in overseas markets, they are likely to capitalize on them.

International Perspective in Retail Business

  1. Globalization and Market Expansion:

  • Market Entry Strategies:

Retailers may choose from various entry strategies, including franchising, joint ventures, acquisitions, or establishing wholly-owned subsidiaries, depending on the level of control desired and the nature of the market.

  • Global Supply Chains:

Managing global supply chains is crucial, involving coordination of sourcing, production, and distribution across different countries. Retailers often optimize supply chain efficiency to reduce costs and enhance flexibility.

  1. Cultural Sensitivity and Localization:

  • Understanding Cultural Differences:

Cultural factors significantly impact consumer preferences, shopping habits, and communication styles. Successful retailers adapt their strategies to align with local cultural norms and values.

  • Localization of Products and Services:

Retailers often tailor their product offerings and services to meet local tastes and preferences. This may involve adapting packaging, marketing messages, and even the assortment of products.

  1. Regulatory and Legal Considerations:

  • Compliance with Local Regulations:

International retailers must navigate diverse regulatory landscapes, including tax laws, employment regulations, and trade restrictions. Understanding and complying with local laws are critical for sustained success.

  • Trade Barriers and Tariffs:

Retailers need to be aware of trade barriers, tariffs, and import/export regulations that may impact the cost and availability of goods.

  1. Economic Conditions:

  • Currency Fluctuations:

Global retailers face exposure to currency fluctuations, which can impact pricing, profitability, and financial performance. Hedging strategies may be employed to manage currency risk.

  • Economic Stability:

Economic conditions in different countries influence consumer purchasing power and spending behavior. Retailers must be adaptable to economic fluctuations and tailor strategies accordingly.

  1. Technology and E-commerce:

  • E-commerce and Digital Platforms:

The growth of e-commerce enables retailers to reach international consumers without significant physical infrastructure. Online platforms provide opportunities for market entry and global reach.

  • Technology Adoption:

The adoption of technology varies globally. Retailers need to assess the digital maturity of each market and adapt their technology strategies accordingly.

  1. Competitive Landscape:

  • Local and Global Competition:

Retailers face competition from both local players and other international brands. Understanding the competitive landscape is crucial for market positioning and differentiation.

  • Partnerships and Collaborations:

Forming strategic partnerships with local businesses or entering collaborations with established players can facilitate market entry and enhance competitiveness.

  1. Consumer Behavior and Trends:

  • Diverse Consumer Behaviors:

Consumer preferences and behaviors differ across countries. Retailers must conduct thorough market research to understand local trends, shopping habits, and preferences.

  • Global Trend Impact:

Some consumer trends, such as sustainability and ethical consumption, have global resonance. Retailers can leverage such trends for consistent messaging across international markets.

  1. Social and Environmental Responsibility:

  • CSR and Sustainability:

Social and environmental responsibility are increasingly important globally. Retailers are expected to demonstrate commitment to sustainable and ethical practices, aligning with global expectations.

  1. Logistics and Distribution:

  • Efficient Distribution Networks:

Establishing efficient logistics and distribution networks is critical for timely and cost-effective delivery of products. Retailers often optimize distribution strategies based on the geography and infrastructure of each market.

  • Last-Mile Challenges:

Last-mile delivery challenges can vary significantly, and retailers must address them to provide a seamless customer experience.

  1. Adaptability and Agility:

  • Agile Business Models:

International retailers need to adopt agile business models to respond to changing market conditions, consumer preferences, and competitive landscapes.

  • Crisis Management:

Effective crisis management is essential for navigating unexpected challenges, such as geopolitical events, economic downturns, or public health crises.

error: Content is protected !!