Major behavioural science disciplines contributing to OB

Organization behavior is an applied science that is built up on contribution from a number of behavioral science. There are some important disciplines to the organizational behavior field which developed it extensively. Due to an increase in organizational complexity, various types of knowledge are required and help many ways.

Psychology

The terms psychology comes from the Greek word ‘Psyche’ meaning soul or spirit. Psychology is the science that seeks to measure, explain and sometimes change the behavior of human beings. Modern psychology is almost universally defined as the science of behavior which is nearly identical with behavioral science, in general. Psychology has a great deal of influence on the field of organizational behavior. Psychology is concerned with individual behavior.

Psychology studies behavior of different people in various conditions such as normal, abnormal, social, industrial legal, childhood, adolescence, old age, etc. It also studies processes of human behavior, such as learning, motivation, perception, individual and group decision-making, pattern of influences change in organization, group process, satisfaction, communication, selection and training.

It is a science, which describes the change of behavior of human and other animals. It is concerned with the more study of human behavior. The major contribution of psychology in the field of OB (Organizational Behavior) have been concerned are following:

  • Personality
  • Learning
  • Perception
  • Performance appraised
  • Individual decision-making
  • Attitude measurement
  • Employee selected
  • Work design
  • Motivation
  • Job satisfaction
  • Emotions
  • Work strain

Social psychology

It is the scientific study of the ways in which interaction, interdependence, and influence among persons affect their behaviour. This field of study blends concepts from psychology and sociology. Social psychologists have provided an answer to why people behave as they do Social psychology analyses the behaviour at group level. It has made a remarkable contribution in the areas of measuring, understanding and group decision making changing attitudes, communication patterns, processes etc.

Sociology

The major focus of sociologists is on studying the social systems in which individuals fill their roles. The focus is on group dynamics.

They have made their greatest contribution to OB through their study of group behavior in organizations, particularly formal and sophisticated organizations.

Sociological concepts, theories, models, and techniques help significantly to understand better the group dynamics, organizational culture, formal organization theory and structure, corporate technology, bureaucracy, communications, power, conflict, and intergroup behavior.

Psychologists are primarily interested in focusing their attention on individual behavior.

Key concepts of Sociology are:

  • Sociology deals with human interaction arid this communication are the key influencing factor among people in social settings.
  • Sociology is a study of plural behavior. Two or more interacting individuals constitute a plurality pattern of behavior
  • Sociology is the systematic study of social systems:

A social system is an operational social unit that is structured to serve a purpose.

It consists of two or more persons of different status with various roles playing a part in a pattern that is sustained by a physical and cultural base.

When analyzing organizing as a social system, the following elements exist:

  • People or actors
  • Acts or Behavior
  • Ends or Goals
  • Norms, rules, or regulation controlling conduct or behavior
  • Beliefs held by people as actors
  • Status and status relationships
  • Authority or power to influence other actors
  • Role expectations, role performances, and role relationships.

Anthropology

The use of anthropology focuses on the study of societies to learn about human beings, their cultures, environments and activities. It enables us to understand differences in fundamental values, attitudes and behaviour between people in different countries and within different organisations.

Political Science

Political science is the branch of social science which deals with politics in its theory and practice, and the analysis of various political system and political behaviors. Political scientists study the behavior of individuals and groups within a political environment. Specific topics of concern to political scientists include conflict resolution, group coalition, allocation of power and how people manipulate power for individual self-interest. In other words, political science helps us to understand the dynamics of power and politics within organizations, since there is usually a hierarchical structure of differing levels of managers and subordinates.

It is the study of the behavior of individuals and group within or political environment. The main contribution of political science in the field of OB have been concerned with:

  • Intra-organizational policies
  • Conflict
  • Power

Economics

Economics contributes to organizational behavior to a great extent in designing the organizational structure. Transaction cost economics influence the organization and its structure.

Transaction costs economics implies cost components to make an exchange on the market.

This transaction cost economics examines the extent to which the organization structure and size of an organization varies in response to attempts to avoid market failures through minimizing production and transaction costs within the constraints of human and environmental factors.

Costs of transactions include both costs of market transactions and internal coordination.

A transaction occurs when a good or service is transferred across a ‘technologically separable barrier’ Transaction costs arise for many reasons.

Role of Behavioural Science in present Business world, Organizations and Managers

The Behavioral science is of great importance to a business management, as it deals with science studying behavior. It is the study of sociology and psychology. It is very much concerned with the ways in which people behave. While on the other hand, anthropology which is also included in behavioral sciences involves the study of mankind relating to all aspects. Especially, it deals with human culture and human development.

The concept that a non-discriminatory understanding may be established in order to appraise the factors motivating managers and the employees as well as the desired results may be attained, is closely linked with this phenomenon. Since it addresses the human dimension of work, the behavioral management theory is often called the human relations movement. Thus, behavioral science is of great importance to a business management. A few concepts concerning behavioral science are concisely discussed hereunder.

Main propositions of the behavioral science approach:

  • An organization is a socio-technical system
  • The interpersonal or group behavior of people in the organization is influenced by a wide range of factors.
  • The goals of the organization are to be harmonized with an understanding of the human needs
  • Multitude of attitudes, perceptions, and values are prevalent amongst employees and these characterize their behavior and influence their performance
  • As a result, some degree of conflict is inevitable in the organization and not necessarily undesirable.

Motivation: Motivation can be defined as to make someone want to achieve something or to make someone willing to work hard in order to do it. It is the act of giving somebody a reason or incentive to do a particular task. Motivation causes a feeling of enthusiasm and interest and commitment. It is to create goal oriented behavior among the employees and managers. It implicates a drive towards an action. A framework originated from the needs is a good starting point with the aim of figuring out how people chose certain behaviors. It is considered to be a key to organizational expansion since a highly motivated subordinate or a manager works more effectively and efficiently than the one who is not. According to Young, “Motivation is the process of arousing action, sustaining the activity in progress and regulating the pattern of activity.” Motivational technique is very much useful to a business management, as it inspires the employees towards working by adding excitement or interest.

Attitude: Attitude is of much value and significance in the attainment of organizational goals. Enhancement of positive attitude is necessary for both managers and the employees. Just as the advancement of an organization rests on a proficient manager, so does the performance of the employees largely depend on the managerial style – which in itself is a reflection of the attitude of a manager. Better the managerial style, more efficient will be the performance of the employees. It is conspicuous in the light of this concept that a management control system is ineffective unless a manager has positive attitude. Positive attitude provides positive results to the entire organization. There is a need for altering the attitude- to make it positive in order to move on the path of success. However, there is almost always a choice as to which attitude should be chosen, that is, positive or negative.

Perception: Perception is a psychological process which lets one interpret the sensory stimulation into meaningful information about the environment. The same world is viewed differently by individuals depending upon their personalities, needs, experience and so on. Similarly, an organizational control system is perceived by a manager and his subordinates in their own ways. We often form our opinions based on what we perceive while it is not necessary at all times that what we perceive is what lies in the reality. The reality may be different from what is perceived. So, the real situation is different from the perceived one and that which is perceived may involve inaccurate information. Hence, the need is to develop perceptual abilities in order to establish positive thinking that may be proven advantageous in the attainment of organizational goals.

Improving Quality and Productivity: Industries are facing the problem of excess supply. This has increased competition to a large extent. Almost every Manager is confronting the same problem of improving the productivity, quality of the goods and services their organisation is providing. Programmes such as business process reengineering, and total Quality Management are being implemented to achieve these ends. Organisational Behaviour helps the Managers to empower their employees, as they are the major forces for implementing this change.

Improving people skills: Organisational Behaviour helps in better management of business as it helps in improving the skills of the people. It provides insight into the skills that the employees can use on the job such as designing jobs and creating effective teams.

Promoting ethical Behaviour: Sometimes the organisations are in a situation of ethical dilemma where they have to define right and wrong. It is Organisational Behaviour which helps an important role by helping the management to create such a woek environment which is ethically healthy and increases work productivity, job satisfaction and organisational citizenship behaviour.

Management Style

A contributor and theorist in the area of Management Style includes:

Likert’s System 1-4T- System 1-4T alternatively known as likert system analysis. The organizational dimensions Likert addresses in his framework seven variable: motivation, communication, interaction, decision making, goal setting, control, and performance. He categorized management styles as follows:

Benevolent: authoritative is similar to the above but allows some upward opportunities for consultation and some delegation. Rewards may be available as well as threats. Productivity is typically fair to good but at the cost of considerable absenteeism and turnover. This environment is best for a weaker version of the Rational Economic Man.

Exploitative: This is a highly task-oriented management style. It is authoritative where power and direction come from the top downwards. Managers employ threats and punishment. Communication is generally poor and teamwork is rare. Individual productivity is generally low to medium. This environment is best for the Rational Economic Man.

Participative: This is a more group-oriented management style. The main aspect is group participation. The result is an increased commitment to the organizations goals. Communication flows more readily up and down the organization. Productivity tends to be higher with lower employee turnover. This environment is best for the Self-Actualizing Man.

Consultative: where goals are set or orders issued after discussion with subordinates, where communication is upwards and downwards and where teamwork is encouraged, at least partially. Some involvement of employees as a motivator. This environment is best for the Social Man.

Manager’s roles

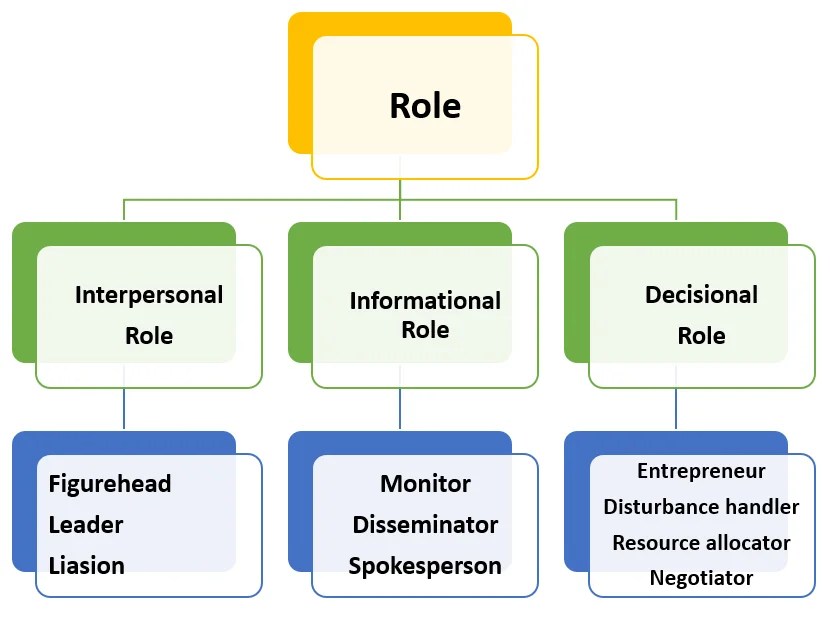
It is important to know “what managers actually do”. Managers play a variety of roles in organisation to manage the work. Henry Mintzberg criticized the traditional func­tional approach. He concluded that functions “tell us little about what managers actually do. At best they indicate some vague objectives managers have when they work. Managers do not act out the classical classification of managerial functions. Instead, they engage in a variety of other activities.” Roles are organized set of behaviours. These are behavioural patterns.

After studying several managers at work, Mintzberg classified their behaviours into three distinct areas or roles- interpersonal, informational, and decisional. Fig­ure 1.2 shows that managers have formal authority, status, personal characteristics and skills to perform these roles effectively.

  1. Interpersonal Roles:

There are three interpersonal roles inherent in the manager’s job. This set of roles derives directly from the manager’s formal position. As the figurehead for his unit, he stands as a symbol of legal authority, performing certain ceremonial duties e.g., signing documents and receiving visitors. The manager in a leader role hires, trains, and motivates his personnel. In the liaison role, manager interacts with many people outside the immedi­ate chain of command, those who are neither subordi­nates nor superiors.

Liaison:

In this role of liaison, every manager must cultivate contacts outside his vertical chain of command to collect information useful for his organization.

Leader:

As a leader, every manager must motivate and encourage his employees. He must also try to reconcile their individual needs with the goals of the organization.

Figurehead:

In this role, every manager has to perform some duties of a ceremonial nature, such as greeting the touring dignitaries, attending the wedding of an employee, taking an important customer to lunch, and so on.

  1. Informational Roles:

Informational roles are important because informa­tion is the lifeblood of organizations and the manager is the nerve center of his unit. As a monitor, the manager is a receiver and collector of information. Information is acquired through meetings, conversations, or documen­tation. In the disseminator role, managers distribute information to subordinates daily. As a spoke-person, the manager transmits information to individuals outside the organization. This role is present in all managerial jobs.

Disseminator:

In the role of a disseminator, the manager passes some of his privileged information directly to his subordinates who would otherwise have no access to it.

Monitor:

As monitor, the manager has to perpetually scan his environment for information, interrogate his liaison contacts and his subordinates, and receive unsolicited information, much of it as result of the network of personal contacts he has developed.

Spokesman:

In this role, the manager informs and satisfies various groups and people who influence his organization. Thus, he advises shareholders about financial performance, assures consumer groups that the organization is fulfilling its social responsibilities and satisfies government that the origination is abiding by the law.

  1. Decisional Roles:

To get the work done, managers have to make decisions. In performing the decision-making role, man­agers act as entrepreneur, disturbance handler, resource allocator, and negotiator. In playing the entrepreneurial role, managers actively design and initiate changes within the organization. It involves some improvements.

As a disturbance handler, the manager handles difficult prob­lems and non-routine situations such as strikes, energy shortages etc. As resource allocator, the manager decides how resources are distributed, and with whom he will work most closely. The fourth decisional role is that of negotiator. Managers negotiate with suppliers, custom­ers, unions, individual employees, the government, and other groups.

It is important to note that neither the functional (process) nor the role approach provides complete insight into many aspects of a manager’s daily routine. Managers should integrate the role-oriented approach with the traditional process approach, because it is, as Jon Pierce says, through the interpersonal, informational, and deci­sional roles that managers execute the planning, organiz­ing, directing and controlling functions.

Disturbance Handler:

In this role, the manager has to work like a fire-fighter. He must seek solutions of various unanticipated problems – a strike may loom large a major customer may go bankrupt; a supplier may renege on his contract, and so on.

Entrepreneur:

In this role, the manager constantly looks out for new ideas and seeks to improve his unit by adapting it to changing conditions in the environment.

In addition, managers in any organization work with each other to establish the organization’s long-range goals and to plan how to achieve them. They also work together to provide one another with the accurate information needed to perform tasks. Thus, managers act as channels of communication with the organization.

Negotiator:

The manager has to spend considerable time in negotiations. Thus, the chairman of a company may negotiate with the union leaders a new strike issue; the foreman may negotiate with the workers a grievance problem, and so on.

Report writing Principles

Proper Format:

An ideal repost is one, which must be prepared as per commonly used format. One must comply with the contemporary practices; completely a new format should not be used.

Proper Language:

Researcher must use a suitable language. Language should be selected as per its target users.

Preciseness:

Research report must not be unnecessarily lengthy. It must contain only necessary parts with adequate description.

Objectivity:

Report must be free from personal bias, i.e., it must be free from one’s personal liking and disliking. The report must be prepared for impersonal needs. The facts must be stated boldly. It must reveal the bitter truth. It must suit the objectives and must meet expectations of the relevant audience/readers.

Cost Consideration:

It must be prepared within the budgeted amount. It should not result into excessive costs.

Selectiveness:

It is important to exclude the matter, which is known to all. Only necessary contents should be included to save time, costs, and energy. However, care should be taken that the vital points should not be missed.

Attractive:

Report must be attractive in all the important regards like size, colour, paper quality, etc. Similarly, it should use liberally the charts, diagrams, figures, illustrations, pictures, and multiple colours.

Reliability:

Research report must be reliable. Manager can trust on it. He can be convinced to decide on the basis of research reports.

Simplicity:

Report must be simple to understand. Unnecessary technical words or terminologies (jargons) should be avoided.

Clarity:

Report must reveal the facts clearly. Contents and conclusions drawn must be free from ambiguities. In short, outcomes must convey clear-cut implications.

Accuracy:

As far as possible, research report must be prepared carefully. It must be free from spelling mistakes and grammatical errors.

Comprehensiveness:

Report must be complete. It must include all the necessary contents. In short, it must contain enough detail to covey meaning.

Reference importance and Writing style

Referencing allows you to acknowledge the contribution of other writers and researchers in your work. Any university assignments that draw on the ideas, words or research of other writers must contain citations.

Referencing in a general sense means to give credit to someone for using his or her own ideas or thoughts in a research activity. Referencing helps in gaining the originality of the ideas and thoughts used in the research activity. Failure to reference is treated as disrespect to the original author or writer and seen as a major misconduct in the area of academic research writing. Generally students made the mistake of not mentioning proper referencing at the end of their research projects, essays or any other piece of work. This may lead to cancellation of the written matter.

Referencing is also a way to give credit to the writers from whom you have borrowed words and ideas. By citing the work of a particular scholar, you acknowledge and respect the intellectual property rights of that researcher. As a student or academic, you can draw on any of the millions of ideas, insights and arguments published by other writers, many of whom have spent years researching and writing. All you need to do is acknowledge their contribution to your assignment.

Referencing is a way to provide evidence to support the assertions and claims in your own assignments. By citing experts in your field, you are showing your marker that you are aware of the field in which you are operating. Your citations map the space of your discipline and allow you to navigate your way through your chosen field of study, in the same way that sailors steer by the stars.

References should always be accurate, allowing your readers to trace the sources of information you have used. The best way to make sure you reference accurately is to keep a record of all the sources you used when reading and researching for an assignment.

Referencing correctly:

  • Shows your understanding of the topic.
  • Helps you to avoid plagiarism by making it clear which ideas are your own and which are someone else’s
  • Allows others to identify the sources you have used.
  • Gives supporting evidence for your ideas, arguments and opinions.

Non-Parametric Tests, Importance, Types, Formulation

Non-parametric tests, also known as distribution-free tests, are statistical techniques that do not assume a specific underlying probability distribution (such as normal distribution) for the population from which the sample is drawn. They are primarily used when data is ordinal, nominal, or violates the assumptions of parametric tests like normality and homogeneity of variance. These tests rely on ranks, signs, or frequencies rather than actual numerical values. Common examples include Chi-Square, Mann-Whitney U, Wilcoxon Signed-Rank, and Kruskal-Wallis tests. They are particularly valuable in business research when dealing with small sample sizes, skewed data, or subjective attitudinal measurements that lack interval properties.

Importance of Non-Parametric Tests:

1. Suitable for Non-Normal Data

Non-parametric tests are important because they can be used when data do not follow a normal distribution. Many statistical tests require assumptions about the distribution of data, but real world business and social science data may be skewed or irregular. Non parametric methods provide an alternative when these assumptions are not satisfied. For example, customer satisfaction scores or income data may not be normally distributed. Tests such as the Mann Whitney U test and Kruskal Wallis test can be used in such situations. Therefore, non parametric tests provide flexibility when the normality assumption required by parametric tests is not met.

2. Useful for Ordinal Data

Non-parametric tests are particularly useful when research data are measured using ordinal scales. Ordinal data provide information about ranking or order but do not necessarily have equal differences between categories. Examples include satisfaction levels, preference rankings and levels of agreement. Tests such as the Mann Whitney U test, Wilcoxon signed rank test and Kruskal Wallis test can analyse such data. This makes non parametric methods highly relevant in business and social science research, where Likert type and ranking data are commonly collected. Thus, they allow researchers to analyse ordered information without requiring strong assumptions about numerical distances.

3. Useful for Small Samples

Non-parametric tests can be useful when the sample size is relatively small. With small samples, it may be difficult to reliably determine whether data satisfy assumptions such as normality. Non parametric methods generally require fewer distributional assumptions and can therefore provide practical alternatives. For example, a researcher studying customer satisfaction among a small group of specialised customers may use an appropriate non parametric test to compare responses. However, the suitability of a test still depends on the research design and data characteristics. Thus, non parametric tests provide researchers with useful analytical options when collecting data from smaller samples.

4. Fewer Statistical Assumptions

A major importance of non parametric tests is that they generally require fewer assumptions than many parametric tests. Parametric tests often require assumptions concerning normality, variance and measurement levels. Non parametric methods are generally less dependent on these distributional assumptions. This makes them suitable for situations where the characteristics of the data do not meet the requirements of parametric techniques. For example, when the data are highly skewed or measured on an ordinal scale, a non parametric test may be more appropriate. Therefore, fewer assumptions make non parametric tests flexible tools for analysing diverse research data.

5. Suitable for Ranked Data

Non-parametric tests can analyse data that are expressed in ranks rather than exact numerical measurements. Ranking is common in business research when respondents are asked to rank products, brands, preferences or alternatives. For example, customers may rank five brands according to their preference. Tests such as Spearman’s rank correlation can examine relationships between ranked variables. Since the actual numerical distance between ranks is not necessarily equal, parametric methods may not always be appropriate. Non parametric techniques work effectively with such information. Therefore, they are important for research involving preferences, rankings and other ordered observations.

6. Useful for Categorical and Qualitative Information

Non-parametric methods are useful when research involves categorical information that cannot be appropriately analysed using conventional parametric procedures. For example, researchers may study relationships between gender and product preference or employment status and training participation. The Chi Square test is commonly used to examine associations between categorical variables. These methods allow researchers to analyse frequency based information and determine whether observed patterns are statistically significant. This is particularly valuable in social science and business research, where many variables are collected in categories. Therefore, non parametric tests provide suitable statistical methods for analysing categorical research data.

7. Useful in Social Science Research

Non-parametric tests are widely useful in social science and business research because data often involve attitudes, opinions, preferences, rankings and categories. Such data may not satisfy the assumptions required for parametric tests. Researchers can use tests such as Chi Square, Mann Whitney U, Wilcoxon signed rank, Kruskal Wallis and Spearman’s rank correlation according to the research situation. For example, customer satisfaction responses may be analysed using an appropriate non parametric technique. These methods allow researchers to examine relationships and differences without requiring strict distributional assumptions. Thus, they provide practical statistical tools for analysing real world social and business data.

8. Provides Alternative to Parametric Tests

Non-parametric tests provide alternatives when parametric tests cannot be appropriately applied. If data violate assumptions such as normality or involve ordinal measurements, researchers can select suitable non parametric methods. For example, the Mann Whitney U test can serve as an alternative to the independent samples t test under appropriate conditions, while the Kruskal Wallis test can be used as an alternative to one way ANOVA in suitable situations. The choice should depend on the research design and characteristics of the data. Therefore, non parametric tests expand the range of statistical methods available to researchers.

9. Less Affected by Extreme Values

Non-parametric tests often rely on ranks rather than directly using the actual numerical values of observations. As a result, they may be less influenced by extreme values or outliers than some parametric methods. For example, income data can contain a small number of extremely high observations that may strongly affect averages. A rank based non parametric method can reduce the influence of such extreme observations. However, researchers should still identify and understand outliers rather than automatically ignoring them. Thus, non parametric tests can provide more robust analysis when research data contain unusual or highly extreme observations.

10. Easy to Apply in Practical Research

Non-parametric tests are useful in practical research because many real world datasets do not perfectly satisfy the assumptions of parametric methods. Researchers can select appropriate tests based on the type of data, research objective and study design. Many non parametric procedures are straightforward to perform using statistical software. For example, Chi Square can examine associations between categorical variables, while Mann Whitney U can compare two independent groups using ranked information. Their flexibility makes them useful for students, researchers and business professionals. Therefore, non parametric tests provide practical and accessible methods for analysing a wide variety of research data.

Types of Non-Parametric Tests:

Non parametric tests are statistical techniques that do not require the data to follow a specific probability distribution such as the normal distribution. They are particularly useful for ordinal, nominal, ranked, skewed or small sample data. In business and social science research, these tests are commonly used to examine differences, relationships and associations between variables. The major non parametric tests include Chi Square Test, Mann Whitney U Test, Wilcoxon Signed Rank Test, Kruskal Wallis Test, Friedman Test and Spearman Rank Correlation.

1. Chi-Square Test

The Chi Square Test is a non parametric statistical test used mainly to examine relationships or associations between categorical variables. It compares the observed frequencies with the frequencies that would be expected if there were no relationship between the variables. For example, a researcher may examine whether gender is associated with preference for a particular product. The test is commonly used for nominal data and frequency based information. It can also be used to test goodness of fit in appropriate situations. The researcher interprets the calculated test statistic and p value to determine statistical significance. Thus, Chi Square is widely used for analysing categorical data.

2. Mann Whitney U-Test

The Mann Whitney U Test is a non parametric test used to compare two independent groups when the data are ordinal, ranked or do not satisfy the assumptions required for an independent samples t test. It examines whether the distributions or rankings of two groups differ significantly. For example, a researcher may compare customer satisfaction ratings between customers of two different brands. The test converts observations into ranks and compares the groups based on these ranks. It is particularly useful for small samples and non normal data. Therefore, the Mann Whitney U-Test provides a useful alternative for comparing two independent groups.

3. Wilcoxon Signed Rank Test

The Wilcoxon Signed Rank Test is a non parametric test used to compare two related or paired sets of observations. It is commonly applied when the same participants are measured before and after an intervention or when observations are naturally matched. For example, a researcher may compare employee performance scores before and after a training programme. The test considers the direction and magnitude of differences between paired observations using ranks. It is commonly used when the assumptions of the paired samples t test are not satisfied or when data are ordinal. Thus, the Wilcoxon Signed Rank Test is useful for analysing changes in related observations.

4. Kruskal Wallis Test

The Kruskal Wallis Test is a non parametric test used to compare three or more independent groups. It is generally considered an alternative to one way ANOVA when data are ordinal, non normal or do not satisfy the assumptions of parametric analysis. The test ranks all observations and determines whether the groups differ significantly in their distributions or central tendency. For example, a researcher may compare customer satisfaction among customers using three different brands. If the test indicates a significant difference, further analysis may be required to identify which groups differ. Therefore, the Kruskal Wallis Test is useful for comparing multiple independent groups.

5. Friedman Test

The Friedman Test is a non parametric test used to compare three or more related or matched groups. It is commonly used when the same respondents provide ratings for several conditions, products or time periods. For example, customers may be asked to rate three different brands on satisfaction, and the researcher wants to determine whether their ratings differ significantly. The test ranks observations within each respondent and compares the resulting rankings across conditions. It is considered a non parametric alternative to repeated measures ANOVA when appropriate assumptions are not satisfied. Thus, the Friedman Test is useful for analysing related samples involving ordinal or ranked data.

6. Spearman Rank Correlation

Spearman Rank Correlation is a non parametric method used to measure the strength and direction of the relationship between two variables based on their ranks. It is suitable for ordinal data or numerical data that do not meet the assumptions required for Pearson correlation. The coefficient generally ranges from −1 to +1. A positive value indicates that the variables tend to increase together, while a negative value indicates an opposite relationship. For example, a researcher may examine the relationship between employee motivation ranking and job performance ranking. Therefore, Spearman Rank Correlation is useful for studying associations between ranked or non normally distributed variables.

Formulation of Null and Alternative Hypotheses:

Hypothesis formulation is the process of developing a clear and testable statement about the expected relationship, difference or effect between variables. In research, two major hypotheses are generally formulated: the Null Hypothesis (H₀) and the Alternative Hypothesis (H₁ or Hₐ). The null hypothesis assumes that there is no significant relationship, difference or effect, while the alternative hypothesis suggests that a significant relationship, difference or effect exists. Hypotheses are developed from the research problem, objectives, theories and previous studies. Proper formulation helps researchers conduct statistical tests and make objective decisions based on collected data.

1. Null Hypothesis (H₀)

The null hypothesis states that there is no significant relationship, difference or effect between the variables being studied. It represents the position that any observed difference or relationship in the sample may have occurred due to chance. For example, H₀: There is no significant relationship between employee training and employee performance. Statistical testing is generally conducted by examining whether sufficient evidence exists to reject the null hypothesis. If the evidence is insufficient, the researcher fails to reject H₀. The null hypothesis provides an objective basis for statistical testing and helps researchers avoid drawing conclusions merely from observed differences in sample data.

2. Alternative Hypothesis (H₁)

The alternative hypothesis states that a significant relationship, difference or effect exists between the variables under investigation. It represents the researcher’s expectation or the possibility that the null hypothesis is not true. For example, H₁: There is a significant relationship between employee training and employee performance. The alternative hypothesis may be directional or non directional. A directional hypothesis specifies the expected direction, such as a positive or negative relationship. A non directional hypothesis only states that a relationship or difference exists. Therefore, the alternative hypothesis provides a testable statement about the expected outcome of the research study.

3. Directional Hypothesis

A directional hypothesis specifies not only that a relationship or difference exists but also indicates its expected direction. It predicts whether one variable will increase or decrease in relation to another variable. For example, H₁: Employee training has a positive effect on employee performance. Another example is, H₁: Higher advertising expenditure increases sales. Directional hypotheses are generally developed when previous research or theory provides sufficient evidence about the expected direction of the relationship. They help researchers conduct focused statistical testing. Therefore, a directional hypothesis provides more specific information than a general statement about the existence of a relationship.

4. Non-Directional Hypothesis

A non directional hypothesis states that a significant relationship or difference exists between variables but does not specify its direction. It does not predict whether the relationship will be positive or negative. For example, H₁: There is a significant relationship between employee motivation and job performance. The actual relationship may be positive or negative, but the hypothesis only predicts that some relationship exists. Non directional hypotheses are useful when previous research does not provide sufficient evidence to predict the direction of the relationship. Therefore, they provide flexibility while still allowing the researcher to statistically test whether a significant relationship or difference exists.

Data and its types in research

Data can be defined as a systematic record of a particular quantity. It is the different values of that quantity represented together in a set. It is a collection of facts and figures to be used for a specific purpose such as a survey or analysis. When arranged in an organized form, can be called information. The source of data (primary data, secondary data) is also an important factor.

Quantitative Data: These can be measured and not simply observed. They can be numerically represented and calculations can be performed on them. For example, data on the number of students playing different sports from your class gives an estimate of how many of the total students play which sport. This information is numerical and can be classified as quantitative.

Qualitative Data: They represent some characteristics or attributes. They depict descriptions that may be observed but cannot be computed or calculated. For example, data on attributes such as intelligence, honesty, wisdom, cleanliness, and creativity collected using the students of your class a sample would be classified as qualitative. They are more exploratory than conclusive in nature.

Primary Data

It is the data collected by the investigator himself or herself for a specific purpose.

Primary data is an original and unique data, which is directly collected by the researcher from a source according to his requirements.

Data gathered by finding out first-hand the attitudes of a community towards health services, ascertaining the health needs of a community, evaluating a social program, determining the job satisfaction of the employees of an organization, and ascertaining the quality of service provided by a worker are the examples of primary data.

Secondary Data

Data collected by someone else for some other purpose (but being utilized by the investigator for another purpose) is secondary data.

Secondary data refers to the data which has already been collected for a certain purpose and documented somewhere else.

Gathering information with the use of census data to obtain information on the age-sex structure of a population, the use of hospital records to find out the morbidity and mortality patterns of a community, the use of an organization’s records to ascertain its activities, and the collection of data from sources such as articles, journals, magazines, books and periodicals to obtain historical and other types of information, are examples of secondary data.

Discrete Data: These are data that can take only certain specific values rather than a range of values. For example, data on the blood group of a certain population or on their genders is termed as discrete data. A usual way to represent this is by using bar charts.

Continuous Data: These are data that can take values between a certain range with the highest and lowest values. The difference between the highest and lowest value is called the range of data. For example, the age of persons can take values even in decimals or so is the case of the height and weights of the students of your school. These are classified as continuous data. Continuous data can be tabulated in what is called a frequency distribution. They can be graphically represented using histograms.

Confidence interval, Level of Significance

In statistics, a confidence interval (CI) is a type of estimate computed from the observed data. This gives a range of values for an unknown parameter (for example, a population mean). The interval has an associated confidence level that gives the probability with which an estimated interval will contain the true value of the parameter. The confidence level is chosen by the investigator. For a given estimation in a given sample, using a higher confidence level generates a wider (i.e., less precise) confidence interval. In general terms, a confidence interval for an unknown parameter is based on sampling the distribution of a corresponding estimator.

A confidence interval, in statistics, refers to the probability that a population parameter will fall between a set of values for a certain proportion of times.

This means that the confidence level represents the theoretical long-run frequency (i.e., the proportion) of confidence intervals that contain the true value of the unknown population parameter. In other words, 90% of confidence intervals computed at the 90% confidence level contain the parameter, 95% of confidence intervals computed at the 95% confidence level contain the parameter, 99% of confidence intervals computed at the 99% confidence level contain the parameter, etc.

The confidence level is designated before examining the data. Most commonly, a 95% confidence level is used. However, other confidence levels, such as 90% or 99%, are sometimes used.

For example, a confidence interval can be used to describe how reliable survey results are. In a poll of election voting intentions, the result might be that 40% of respondents intend to vote for a certain party. A 99% confidence interval for the proportion in the whole population having the same intention on the survey might be 30% to 50%. From the same data one may calculate a 90% confidence interval, which in this case might be 37% to 43%. A major factor determining the length of a confidence interval is the size of the sample used in the estimation procedure, for example, the number of people taking part in a survey.

Factors affecting the width of the confidence interval include the size of the sample, the confidence level, and the variability in the sample. A larger sample will tend to produce a better estimate of the population parameter, when all other factors are equal. A higher confidence level will tend to produce a broader confidence interval.

Various interpretations of a confidence interval can be given (taking the 90% confidence interval as an example in the following).

The confidence interval can be expressed in terms of samples (or repeated samples): “Were this procedure to be repeated on numerous samples, the fraction of calculated confidence intervals (which would differ for each sample) that encompass the true population parameter would tend toward 90%.”

The confidence interval can be expressed in terms of a single sample: “There is a 90% probability that the calculated confidence interval from some future experiment encompasses the true value of the population parameter.” Note this is a probability statement about the confidence interval, not the population parameter. This considers the probability associated with a confidence interval from a pre-experiment point of view, in the same context in which arguments for the random allocation of treatments to study items are made. Here the experimenter sets out the way in which they intend to calculate a confidence interval and to know, before they do the actual experiment, that the interval they will end up calculating has a particular chance of covering the true but unknown value. This is very similar to the “repeated sample” interpretation above, except that it avoids relying on considering hypothetical repeats of a sampling procedure that may not be repeatable in any meaningful sense. See Neyman construction.

The explanation of a confidence interval can amount to something like: “The confidence interval represents values for the population parameter for which the difference between the parameter and the observed estimate is not statistically significant at the 10% level”. This interpretation is common in scientific articles that use confidence intervals to validate their experiments, although overreliance on confidence intervals can cause problems as well.

The biggest misconception regarding confidence intervals is that they represent the percentage of data from a given sample that falls between the upper and lower bounds. In other words, it would be incorrect to assume that a 99% confidence interval means that 99% of the data in a random sample fall between these bounds. What it actually means is that one can be 99% certain that the range will contain the population mean.

Level of Significance

In statistical hypothesis testing, a result has statistical significance when it is very unlikely to have occurred given the null hypothesis. More precisely, a study’s defined significance level, denoted by, is the probability of the study rejecting the null hypothesis, given that the null hypothesis was assumed to be true; and the p-value of a result, is the probability of obtaining a result at least as extreme, given that the null hypothesis is true. The result is statistically significant, by the standards of the study, when The significance level for a study is chosen before data collection, and is typically set to 5% or much lower depending on the field of study.

In any experiment or observation that involves drawing a sample from a population, there is always the possibility that an observed effect would have occurred due to sampling error alone. But if the p-value of an observed effect is less than (or equal to) the significance level, an investigator may conclude that the effect reflects the characteristics of the whole population, thereby rejecting the null hypothesis.

This technique for testing the statistical significance of results was developed in the early 20th century. The term significance does not imply importance here, and the term statistical significance is not the same as research, theoretical, or practical significance. For example, the term clinical significance refers to the practical importance of a treatment effect.

Statistical significance plays a pivotal role in statistical hypothesis testing. It is used to determine whether the null hypothesis should be rejected or retained. The null hypothesis is the default assumption that nothing happened or changed. For the null hypothesis to be rejected, an observed result has to be statistically significant, i.e. the observed p-value is less than the pre-specified significance level alpha.

To determine whether a result is statistically significant, a researcher calculates a p-value, which is the probability of observing an effect of the same magnitude or more extreme given that the null hypothesis is true. The null hypothesis is rejected if the p-value is less than (or equal to) a predetermined level, alpha. alpha is also called the significance level, and is the probability of rejecting the null hypothesis given that it is true (a type I error). It is usually set at or below 5%.

For example, when alpha is set to 5%, the conditional probability of a type I error, given that the null hypothesis is true, is 5%, and a statistically significant result is one where the observed p-value is less than (or equal to) 5%.  When drawing data from a sample, this means that the rejection region comprises 5% of the sampling distribution. These 5% can be allocated to one side of the sampling distribution, as in a one-tailed test, or partitioned to both sides of the distribution, as in a two-tailed test, with each tail (or rejection region) containing 2.5% of the distribution.

The use of a one-tailed test is dependent on whether the research question or alternative hypothesis specifies a direction such as whether a group of objects is heavier or the performance of students on an assessment is better. A two-tailed test may still be used but it will be less powerful than a one-tailed test, because the rejection region for a one-tailed test is concentrated on one end of the null distribution and is twice the size (5% vs. 2.5%) of each rejection region for a two-tailed test. As a result, the null hypothesis can be rejected with a less extreme result if a one-tailed test was used. The one-tailed test is only more powerful than a two-tailed test if the specified direction of the alternative hypothesis is correct. If it is wrong, however, then the one-tailed test has no power.

Formulation of Hypothesis

Meaning of Hypothesis

Hypothesis is a tentative, testable statement that predicts a relationship between two or more variables. It is formulated based on existing theory, observation, and review of literature. A hypothesis provides direction to research by specifying what the researcher expects to find. It serves as a basis for data collection, analysis, and interpretation, and helps in drawing meaningful conclusions from the study.

Meaning of Formulation of Hypothesis

Formulation of hypothesis refers to the process of developing a clear, precise, and testable statement based on the research problem. It involves transforming assumptions and expectations into scientifically testable propositions. Proper formulation helps in narrowing the scope of research and defining the relationship between variables, ensuring clarity and focus throughout the study.

Need for Formulation of Hypothesis

  • Provides Clear Direction to Research

Formulation of a hypothesis provides a clear direction to the research process. It specifies what the researcher intends to study and what outcomes are expected. By defining the relationship between variables, a hypothesis narrows the scope of investigation and prevents unnecessary exploration. This clarity helps the researcher remain focused on the research problem and ensures that all activities are aligned with the study objectives.

  • Helps in Defining Research Objectives

A hypothesis assists in clearly defining research objectives. It translates the research problem into specific, measurable propositions that guide the formulation of objectives. With a well-formulated hypothesis, objectives become precise and achievable. This ensures logical consistency between the problem statement, objectives, and research design, thereby strengthening the overall structure and coherence of the research study.

  • Facilitates Selection of Research Design

The formulation of a hypothesis plays an important role in selecting an appropriate research design. It indicates whether the study should be exploratory, descriptive, or causal. Based on the hypothesis, the researcher can choose suitable methods, tools, and techniques for data collection and analysis. This ensures that the research methodology is relevant and scientifically sound.

  • Guides Data Collection Process

A hypothesis provides guidance for collecting relevant data. It helps the researcher identify what data is required, from whom it should be collected, and how it should be measured. By focusing only on variables mentioned in the hypothesis, unnecessary data collection is avoided. This targeted approach improves efficiency and enhances the accuracy and relevance of the collected data.

  • Supports Statistical Analysis

Formulation of a hypothesis is essential for statistical testing and analysis. Hypotheses provide the basis for applying statistical tools and techniques to test relationships between variables. Null and alternative hypotheses allow the researcher to objectively analyze data and draw valid conclusions. Without a hypothesis, statistical analysis lacks purpose and direction, reducing the scientific value of research.

  • Enhances Objectivity in Research

A hypothesis helps maintain objectivity by reducing researcher bias. Since hypotheses are formulated before data collection, they prevent manipulation of results to suit personal expectations. The researcher relies on empirical evidence to accept or reject the hypothesis. This ensures fairness, transparency, and scientific integrity throughout the research process.

  • Links Theory with Observation

One important need for hypothesis formulation is to connect theoretical concepts with real-world observations. Hypotheses are derived from existing theories and tested through empirical data. This linkage helps in validating theories or modifying them based on findings. Thus, hypothesis formulation plays a crucial role in theory development and advancement of knowledge.

  • Helps in Drawing Meaningful Conclusions

A hypothesis provides a framework for interpreting research findings. It helps the researcher evaluate results in a logical and systematic manner. By testing hypotheses, conclusions become evidence-based and reliable. This need ensures that research outcomes are meaningful, relevant, and useful for academic, practical, or policy-related purposes.

Types of Hypothesis

1. Null Hypothesis (H₀)

The null hypothesis states that there is no relationship, difference, or effect between the variables under study. It assumes that any observed change is due to chance or random factors. In statistical testing, the null hypothesis is the basis for analysis and is either accepted or rejected. It helps in maintaining objectivity and provides a standard for comparison in research.

2. Alternative Hypothesis (H₁ or Ha)

The alternative hypothesis is the opposite of the null hypothesis. It states that a relationship, difference, or effect does exist between variables. This hypothesis is accepted when the null hypothesis is rejected based on empirical evidence. It reflects the actual expectation of the researcher and provides direction for the study’s conclusions.

3. Simple Hypothesis

A simple hypothesis involves only one independent variable and one dependent variable. It predicts a direct relationship between these two variables. Due to its limited scope, it is easy to test and interpret. Simple hypotheses are commonly used in basic research studies where the focus is on a single cause-and-effect relationship.

4. Complex Hypothesis

A complex hypothesis involves two or more independent variables, dependent variables, or both. It predicts relationships among multiple variables simultaneously. Such hypotheses are used in advanced research where phenomena are influenced by several factors. Although complex, they provide a more comprehensive understanding of real-life situations.

5. Directional Hypothesis

A directional hypothesis clearly specifies the direction of the relationship between variables. It indicates whether the effect will be positive or negative. For example, it may state that an increase in one variable leads to an increase or decrease in another. Directional hypotheses are based on prior knowledge or strong theoretical support.

6. Non-Directional Hypothesis

A non-directional hypothesis states that a relationship or difference exists between variables but does not specify the direction. It is used when there is insufficient prior evidence to predict the nature of the relationship. This type of hypothesis allows the researcher to remain open to multiple possible outcomes.

7. Statistical Hypothesis

A statistical hypothesis is expressed in statistical terms and is tested using statistical techniques. It includes null and alternative hypotheses formulated in terms of population parameters. Statistical hypotheses provide a quantitative basis for decision-making and are essential for hypothesis testing in empirical research.

8. Research Hypothesis

A research hypothesis is a tentative statement framed in conceptual terms, indicating the expected relationship between variables. It is often converted into statistical hypotheses for testing. Research hypotheses guide the entire study by linking theory with empirical investigation and helping in drawing meaningful conclusions.

Steps in Formulation of Hypothesis

Step 1. Identification of the Research Problem

The first step in formulating a hypothesis is identifying the research problem clearly. A well-defined problem highlights the issue to be studied and provides the foundation for hypothesis development. Understanding the problem helps the researcher focus on specific aspects of the study and avoid vague assumptions. Clear problem identification ensures that the hypothesis is relevant, meaningful, and directly related to the research objective.

Step 2. Review of Relevant Literature

Review of literature is a crucial step in hypothesis formulation. Existing theories, research studies, and findings are examined to understand established relationships between variables. Literature review helps in identifying research gaps and theoretical frameworks. It ensures that the hypothesis is grounded in existing knowledge and avoids duplication of earlier research, thereby enhancing the originality and relevance of the study.

Step 3. Identification of Variables

At this stage, the researcher identifies the key variables involved in the study. These include independent variables, dependent variables, and sometimes control variables. Understanding variables helps in determining what factors are expected to influence outcomes. Clear identification of variables ensures that the hypothesis is specific, testable, and measurable, which is essential for effective data collection and analysis.

Step 4. Establishing Relationship Between Variables

Once variables are identified, the researcher establishes a logical or theoretical relationship between them. This relationship may indicate cause and effect, association, or difference. Logical reasoning, theory, and prior evidence are used to determine how variables interact. This step helps in framing a hypothesis that explains or predicts the nature of the relationship to be tested.

Step 5. Formulation of a Tentative Statement

After establishing relationships, a tentative statement is framed in the form of a hypothesis. This statement predicts the expected outcome or relationship between variables. It should be clear, simple, and specific. The hypothesis may be stated in null or alternative form, depending on the research requirement. This step transforms assumptions into a testable proposition.

Step 6. Ensuring Testability and Clarity

The formulated hypothesis is then examined to ensure that it is testable and clearly stated. It should be capable of empirical verification through observation, experimentation, or statistical analysis. Ambiguous or abstract statements are revised. This step ensures that the hypothesis can be practically tested using available research methods and data.

Step 7. Consistency with Research Objectives

The hypothesis must be consistent with the research objectives and problem statement. This step involves checking whether the hypothesis aligns with the overall purpose of the study. Consistency ensures logical flow between the problem, objectives, hypothesis, and methodology. A mismatch can lead to confusion and weak research outcomes.

Step 8. Finalization of Hypothesis

The final step is refining and finalizing the hypothesis in a precise and formal manner. It is stated in clear language, free from bias and ambiguity. Once finalized, the hypothesis guides data collection, analysis, and interpretation. A well-formulated hypothesis strengthens the scientific nature and credibility of the research study.

Characteristics of a Good Hypothesis

  • Clear and Precise

A good hypothesis must be clearly and precisely stated. It should convey its meaning without ambiguity so that the researcher and readers understand exactly what is being tested. Clear wording helps in proper interpretation and avoids confusion during data collection and analysis. Precision ensures that the hypothesis focuses only on the specific variables and relationships under study.

  • Testable and Verifiable

A good hypothesis should be capable of being tested through empirical observation, experimentation, or statistical analysis. It must allow verification using available research methods and data. Hypotheses that cannot be tested scientifically lack practical value. Testability ensures that the hypothesis can be accepted or rejected based on objective evidence.

  • Based on Existing Knowledge

A sound hypothesis is grounded in existing theories, concepts, or previous research findings. It is not based on mere assumptions or guesses. Drawing from established knowledge ensures logical consistency and increases the likelihood of meaningful results. This characteristic also helps in linking the hypothesis with the theoretical framework of the study.

  • States Relationship Between Variables

A good hypothesis clearly states the relationship between two or more variables. It specifies how one variable is expected to influence or relate to another. Clear identification of independent and dependent variables makes the hypothesis focused and measurable. This characteristic is essential for designing research methods and conducting analysis.

  • Simple and Specific

Simplicity and specificity are important characteristics of a good hypothesis. It should be expressed in simple language and focus on a limited number of variables. Overly complex hypotheses are difficult to test and interpret. Specific hypotheses provide clear guidance for research and reduce the chances of misinterpretation.

  • Consistent with Research Objectives

A good hypothesis must align with the research objectives and problem statement. Consistency ensures logical flow throughout the research process. If the hypothesis does not match the objectives, the study may lose focus and coherence. This characteristic helps in maintaining unity between problem identification, hypothesis formulation, and data analysis.

  • Objective and Free from Bias

Objectivity is a key characteristic of a good hypothesis. It should not reflect the researcher’s personal beliefs or expectations. The hypothesis must be framed in a neutral manner, allowing unbiased testing. Objectivity ensures scientific integrity and increases the credibility and reliability of research findings.

  • Limited in Scope

A good hypothesis has a limited and well-defined scope. It should not be too broad or vague, as this makes testing difficult. A limited scope ensures feasibility and allows in-depth analysis. This characteristic helps in managing time, resources, and data effectively during the research process.

  • Logical and Consistent

Logical reasoning is essential in hypothesis formulation. A good hypothesis should follow logically from the research problem and existing theory. It must be internally consistent and free from contradictions. Logical hypotheses enhance clarity, support systematic investigation, and contribute to meaningful conclusions.

Plagiarism in research

Plagiarism means presenting someone else’s work as your own. In academic writing, plagiarizing involves using words, ideas, or information from a source without including a proper citation.

Plagiarism is the representation of another author’s language, thoughts, ideas, or expressions as one’s own original work. In educational contexts, there are differing definitions of plagiarism depending on the institution. Plagiarism is considered a violation of academic integrity and a breach of journalistic ethics. It is subject to sanctions such as penalties, suspension, expulsion from school or work, substantial fines and even incarceration. Recently, cases of “extreme plagiarism” have been identified in academia. The modern concept of plagiarism as immoral and originality as an ideal emerged in Europe in the 18th century, particularly with the Romantic movement.

Generally, plagiarism is not in itself a crime, but like counterfeiting fraud can be punished in a court for prejudices caused by copyright infringement, violation of moral rights, or torts. In academia and industry, it is a serious ethical offense. Plagiarism and copyright infringement overlap to a considerable extent, but they are not equivalent concepts, and many types of plagiarism do not constitute copyright infringement, which is defined by copyright law and may be adjudicated by courts.

Plagiarism can have serious consequences for students and researchers, even when it’s done accidentally. To avoid plagiarism, it’s important to keep track of your sources and cite them correctly.

Within academia, plagiarism by students, professors, or researchers is considered academic dishonesty or academic fraud, and offenders are subject to academic censure, up to and including expulsion. Some institutions use plagiarism detection software to uncover potential plagiarism and to deter students from plagiarizing. However, plagiarism detection software does not always yield accurate results and there are loopholes in these systems. Some universities address the issue of academic integrity by providing students with thorough orientations, required writing courses, and clearly articulated honor codes. Indeed, there is a virtually uniform understanding among college students that plagiarism is wrong. Nevertheless, each year students are brought before their institutions’ disciplinary boards on charges that they have misused sources in their schoolwork. However, the practice of plagiarizing by use of sufficient word substitutions to elude detection software, known as rogeting, has rapidly evolved as students and unethical academics seek to stay ahead of detection software.

An extreme form of plagiarism, known as “contract cheating”, involves students paying someone else, such as an essay mill, to do their work for them.

Academia

No universally adopted definition of academic plagiarism exists. However, this section provides several definitions to exemplify the most common characteristics of academic plagiarism. It has been called, “The use of ideas, concepts, words, or structures without appropriately acknowledging the source to benefit in a setting where originality is expected.”

This is an abridged version of Teddi Fishman’s definition of plagiarism, which proposed five elements characteristic of plagiarism. According to Fishman, plagiarism occurs when someone:

  • Attributable to another identifiable person or source.
  • Uses words, ideas, or work products.
  • In a situation in which there is a legitimate expectation of original authorship.
  • Without attributing the work to the source from which it was obtained
  • In order to obtain some benefit, credit, or gain which need not be monetary.

Type:

Accidental Plagiarism

Accidental plagiarism occurs when a person neglects to cite their sources, or misquotes their sources, or unintentionally paraphrases a source by using similar words, groups of words, and/or sentence structure without attribution. Students must learn how to cite their sources and to take careful and accurate notes when doing research. Lack of intent does not absolve the student of responsibility for plagiarism. Cases of accidental plagiarism are taken as seriously as any other plagiarism and are subject to the same range of consequences as other types of plagiarism.

Self Plagiarism

Self-plagiarism occurs when a student submits his or her own previous work, or mixes parts of previous works, without permission from all professors involved. For example, it would be unacceptable to incorporate part of a term paper you wrote in high school into a paper assigned in a college course. Self-plagiarism also applies to submitting the same piece of work for assignments in different classes without previous permission from both professors.

Direct Plagiarism

Direct plagiarism is the word-for-word transcription of a section of someone else’s work, without attribution and without quotation marks. The deliberate plagiarism of someone else’s work is unethical, academically dishonest, and grounds for disciplinary actions, including expulsion.

Mosaic Plagiarism

Mosaic Plagiarism occurs when a student borrows phrases from a source without using quotation marks, or finds synonyms for the author’s language while keeping to the same general structure and meaning of the original. Sometimes called “patch writing,” this kind of paraphrasing, whether intentional or not, is academically dishonest and punishable even if you footnote your source.

Avoiding plagiarism

  • When you want to express an idea or information from a source, paraphrase or summarize it entirely in your own words.
  • When you want to include an exact phrase, sentence or passage from a source, use a quotation.
  • Always cite the source when you quote, paraphrase, or summarize.

Measures to overcome Plagiarism

Paraphrase your content

Do not copy–paste the text verbatim from the reference paper. Instead, restate the idea in your own words.

Use Quotations

Use quotes to indicate that the text has been taken from another paper. The quotes should be exactly the way they appear in the paper you take them from.

Cite your Sources

Identify what does and does not need to be cited.

Any words or ideas that are not your own but taken from another paper need to be cited.

Cite Your Own Material If you are using content from your previous paper, you must cite yourself. Using material you have published before without citation is called self-plagiarism.

Maintain records of the sources you refer to

Use multiple references for the background information/literature survey. For example, rather than referencing a review, the individual papers should be referred to and cited.

error: Content is protected !!