Classical and empirical probability

Classical Probability: There are ‘n’ number of events and you can find the probability of the happening of an event by applying basic probability formulae. For example – the probability of getting a head in a single toss of a coin is 1/2. This is Classical Probability.

Empirical Probability: This type of probability is based on experiments. Say, we want to know that how many times a head will turn up if we toss a coin 1000 times. According to the Traditional approach, the answer should be 500. But according to Empirical approach, we’ll first conduct an experiment in which we’ll toss a coin 1000 times and then we can draw our answer based on the observations of our experiment.

Conditional Probability, Meaning, Definition, Characteristics, Applications, Advantages and Limitations

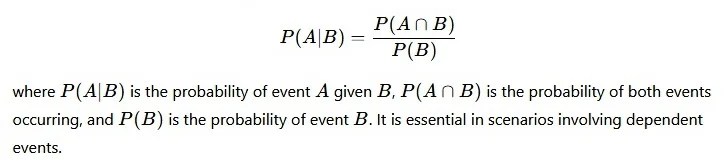
Conditional Probability refers to the probability of an event occurring given that another event has already occurred. It measures how the occurrence of one event affects the likelihood of another event. In many real-life situations, events are not independent, and the probability of one event depends on the outcome of another. Conditional probability helps analyze such relationships and provides a more accurate understanding of uncertain situations.

This concept is widely used in business, economics, finance, insurance, medicine, and statistics. It helps organizations make informed decisions by considering available information and understanding how different events are connected.

Definition

Conditional Probability is the probability of an event occurring under the condition that another related event has already taken place.

The probability of the occurrence of an event A given that an event B has already occurred is called the conditional probability of A given B:

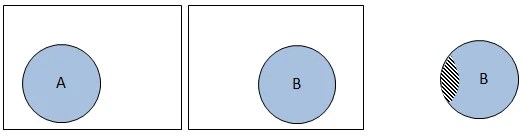
The same is explained in Figure 2.15 using the sample spaces related to the events A and B, assuming that there are few sample points common to these two events. Part 1 of the figure shows the total sample space related to the experiment as in the form of rectangle and the sample space related to the event A as a circle. Similarly part 2 of the figure shows the total sample space and the sample space related to event B. As explained earlier in conditional probability the total sample space is restrained to the sample space that is related to event B (which has already occurred). The same is shown in part 3 of Figure 2.15. Now the sample space for event A (B is the total sample space available) is nothing but the sample points related to event A and falling in the sample space. This is nothing but the intersection of the events A and B and is shown in part 3 of the figure as the hatched area.  

Figure 2.15: Representation of conditional probability using the Venn diagrams

For example, there are 100 trips per day between two places X and Y. Out of these 100 trips 50 are made by car, 25 are made by bus and the other 25 are by local train. Probabilities associated to these modes are 0.5, 0.25, and 0.25, respectively. In transportation engineering both the bus and the local train are considered as public transport so the event space associated to this is the summation of the event spaces associated to bus and local train. Probability of choosing public transportation is 0.5. Now if one is interested in finding the probability of choosing bus given public transportation is chosen the conditional probability is useful in finding that.

Characteristics of Conditional Probability

  • Depends on the Occurrence of Another Event

A key characteristic of conditional probability is that it depends on the occurrence of another event. Unlike simple probability, which measures the likelihood of an event independently, conditional probability considers additional information. The probability of an event changes when another related event has already occurred. For example, the probability of a customer purchasing a printer may increase if the customer has already purchased a laptop. This dependency makes conditional probability highly useful in analyzing real-world situations where events are interconnected and influence one another.

  • Measures Relationships Between Events

Conditional probability helps measure and understand the relationship between two or more events. It shows how the occurrence of one event affects the likelihood of another event occurring. By analyzing these relationships, businesses and researchers can identify patterns and dependencies within data. For example, a retailer may study whether customers who buy one product are more likely to buy another. This characteristic makes conditional probability valuable in market research, risk assessment, and forecasting. It provides insights into event interactions that simple probability cannot capture effectively.

  • Based on Joint Probability

Another important characteristic is that conditional probability relies on joint probability. To calculate conditional probability, the probability of both events occurring together must be known. Joint probability provides the foundation for determining how likely one event is when another has already occurred. This relationship ensures that conditional probability is mathematically consistent and accurate. By using joint probability, analysts can examine event dependencies in a systematic manner. This characteristic highlights the close connection between different probability concepts and their role in statistical analysis.

  • Applicable to Dependent Events

Conditional probability is particularly useful when dealing with dependent events. Dependent events are events where the occurrence of one influences the probability of another. In many business and real-world situations, events are not independent. For example, customer purchasing decisions may depend on previous purchases or promotional offers. Conditional probability helps quantify these dependencies and provides more realistic probability estimates. This characteristic makes it an essential tool for understanding situations where outcomes are interconnected and cannot be analyzed accurately using independent probabilities alone.

  • Provides Updated Probability Estimates

Conditional probability allows probabilities to be updated when new information becomes available. Instead of relying solely on initial estimates, it incorporates additional data to produce revised probability values. This characteristic is especially important in dynamic environments where circumstances change over time. For example, a bank may reassess the probability of loan repayment after receiving updated information about a customer’s financial status. By adjusting probabilities based on current information, conditional probability improves the accuracy and relevance of decision-making and forecasting processes.

  • Supports Better Decision-Making

A significant characteristic of conditional probability is its ability to support informed decision-making. By considering specific conditions and relevant information, it provides more accurate estimates of future outcomes. Managers, investors, and policymakers use conditional probability to evaluate alternatives and assess risks. For example, a business may determine the likelihood of achieving sales targets under certain market conditions. This information enables decision-makers to choose strategies that maximize opportunities and minimize risks. Consequently, conditional probability plays an important role in effective planning and management.

  • Forms the Foundation of Advanced Statistical Methods

Conditional probability serves as the basis for many advanced statistical and analytical techniques. Concepts such as Bayes’ Theorem, predictive modeling, machine learning, and statistical inference all rely on conditional probability principles. By understanding how probabilities change under specific conditions, analysts can develop sophisticated models for forecasting and decision support. This characteristic demonstrates the importance of conditional probability in both theoretical and applied statistics. Its role as a foundational concept makes it essential for advanced research and data analysis across numerous disciplines.

  • Widely Applicable in Real-Life Situations

Conditional probability has broad applicability in business, finance, insurance, healthcare, engineering, and many other fields. Real-world events are often dependent on specific conditions, making conditional probability highly relevant. Businesses use it to analyze customer behavior, assess risks, and forecast demand. Insurance companies use it to estimate claim probabilities based on customer profiles. Financial institutions apply it in credit risk analysis and investment decisions. This widespread applicability demonstrates its practical value and importance. As a result, conditional probability is one of the most widely used concepts in probability and statistics.

Applications of Conditional Probability in Business

  • Customer Purchase Analysis

Conditional probability is widely used to analyze customer purchasing behavior. Businesses calculate the probability that a customer will buy a product given that they have already purchased another related product. For example, a customer who buys a smartphone may also be likely to purchase accessories such as earphones or phone cases. This information helps companies design cross-selling and upselling strategies. By understanding these purchasing relationships, businesses can improve customer experience, increase sales revenue, and develop targeted promotional campaigns. As a result, conditional probability plays a significant role in consumer behavior analysis and marketing decisions.

  • Credit Risk Assessment

Banks and financial institutions use conditional probability to evaluate the likelihood of loan repayment or default under specific conditions. For example, they may calculate the probability that a borrower will default given a low credit score or unstable income. This analysis helps lenders assess creditworthiness and make informed lending decisions. By understanding the relationship between borrower characteristics and repayment behavior, financial institutions can reduce lending risks and improve profitability. Conditional probability therefore serves as an essential tool in credit risk management and financial decision-making.

  • Insurance Underwriting

Insurance companies apply conditional probability to estimate risks associated with policyholders. For example, they may calculate the probability of an accident occurring given a driver’s age, driving history, or vehicle type. These probability estimates help insurers determine premium rates and policy terms. By considering specific conditions, insurance companies can accurately assess risk and avoid financial losses. Conditional probability enables insurers to create fair pricing structures and maintain financial stability. Consequently, it is a critical component of insurance underwriting and risk evaluation processes.

  • Marketing Campaign Evaluation

Businesses use conditional probability to assess the effectiveness of marketing campaigns. They may calculate the probability that a customer makes a purchase after receiving an advertisement or promotional offer. This analysis helps marketers determine which campaigns generate the highest customer response rates. By understanding how promotional activities influence buying behavior, companies can optimize marketing strategies and allocate resources efficiently. Conditional probability also supports customer segmentation and personalized marketing efforts. Therefore, it contributes significantly to improving marketing performance and maximizing returns on investment.

  • Demand Forecasting

Conditional probability plays an important role in demand forecasting by considering specific market conditions. Businesses estimate the probability of future product demand given factors such as seasonal trends, economic conditions, or consumer preferences. This approach provides more accurate demand forecasts than relying solely on historical data. Improved forecasting helps organizations manage inventory, plan production schedules, and allocate resources effectively. By incorporating relevant conditions into predictions, conditional probability reduces uncertainty and enhances operational efficiency. As a result, businesses can better meet customer demand and improve profitability.

  • Quality Control and Production Management

Manufacturing companies use conditional probability to monitor product quality and production efficiency. For example, they may calculate the probability of a product defect occurring given a machine malfunction or a specific production condition. This information helps identify the causes of quality problems and implement corrective measures. By understanding the relationship between production factors and defects, organizations can improve quality standards and reduce waste. Conditional probability therefore supports continuous improvement initiatives and enhances overall manufacturing performance. It is an essential tool for maintaining product reliability and customer satisfaction.

  • Supply Chain and Logistics Management

Conditional probability is valuable in supply chain management because it helps evaluate risks and uncertainties. Businesses may estimate the probability of delayed deliveries given adverse weather conditions, supplier issues, or transportation disruptions. Understanding these probabilities allows organizations to develop contingency plans and improve supply chain resilience. By anticipating potential problems, businesses can reduce operational disruptions and maintain customer service levels. Conditional probability also supports inventory planning and supplier selection. Consequently, it contributes to more efficient and reliable supply chain operations.

  • Investment and Financial Decision-Making

Investors and financial managers use conditional probability to evaluate investment opportunities under specific market conditions. For example, they may calculate the probability of a stock price increase given favorable economic indicators or industry growth. This analysis helps assess investment risks and expected returns. By considering relevant conditions, investors can make more informed decisions and develop effective portfolio strategies. Conditional probability also supports financial forecasting and risk management. Therefore, it plays a crucial role in achieving investment objectives and improving financial performance.

Advantages of Conditional Probability

  • Improves Accuracy of Predictions

One of the major advantages of conditional probability is that it improves the accuracy of predictions by considering additional information. Instead of relying only on general probabilities, it takes into account specific conditions that affect outcomes. For example, a business can estimate future sales based on current market trends and customer behavior. This approach produces more realistic and reliable forecasts. Accurate predictions help organizations reduce uncertainty and make better strategic decisions. As a result, conditional probability is widely used in forecasting, planning, and analytical processes where precise estimates are essential.

  • Supports Better Decision-Making

Conditional probability provides decision-makers with more relevant information by incorporating existing conditions into probability calculations. Managers can evaluate various alternatives and assess the likelihood of different outcomes before making important decisions. For example, a company may determine the probability of a successful product launch given favorable market conditions. This helps in selecting the most effective strategy. By providing a clearer understanding of possible outcomes, conditional probability enables businesses to make informed choices, improve efficiency, and achieve organizational objectives more effectively.

  • Enhances Risk Assessment

Businesses often face risks that depend on specific circumstances. Conditional probability helps assess these risks by measuring the likelihood of an event occurring under particular conditions. For example, banks estimate the probability of loan default based on a borrower’s credit history. This analysis helps organizations identify potential threats and develop risk management strategies. By understanding conditional risks, businesses can take preventive actions and reduce potential losses. Therefore, conditional probability is an important tool for improving risk assessment and ensuring organizational stability.

  • Useful in Customer Behavior Analysis

Conditional probability helps businesses understand customer behavior more effectively. It allows companies to determine the likelihood of a customer taking a specific action given a previous action. For example, a retailer can calculate the probability that a customer purchases accessories after buying a smartphone. Such insights support targeted marketing, personalized recommendations, and cross-selling strategies. Understanding customer behavior enables organizations to improve customer satisfaction and increase sales revenue. Consequently, conditional probability contributes significantly to customer relationship management and marketing effectiveness.

  • Assists in Financial and Investment Planning

Financial institutions and investors use conditional probability to evaluate investment opportunities and financial risks. It helps estimate the probability of favorable returns under specific market conditions. Investors can analyze how economic indicators, interest rates, or industry trends influence investment outcomes. This information supports better portfolio management and resource allocation. By considering relevant conditions, conditional probability improves financial forecasting and investment decision-making. As a result, organizations can maximize returns while minimizing risks, making it an essential tool in financial planning and analysis.

  • Improves Demand Forecasting

Demand forecasting becomes more accurate when businesses consider factors that influence customer demand. Conditional probability allows organizations to estimate future demand based on conditions such as seasonal changes, promotional campaigns, or economic trends. This helps businesses prepare for fluctuations in customer requirements and adjust production accordingly. Accurate demand forecasts reduce inventory costs, prevent stock shortages, and improve operational efficiency. By incorporating relevant information into predictions, conditional probability enhances the reliability of forecasting models and supports effective business planning.

  • Supports Quality Control and Process Improvement

Manufacturing organizations use conditional probability to analyze production quality and identify factors associated with defects. For example, managers can calculate the probability of product defects given specific machine conditions or production processes. This information helps identify root causes of quality issues and implement corrective measures. Improved quality control reduces waste, lowers production costs, and increases customer satisfaction. By supporting continuous process improvement, conditional probability contributes to higher operational efficiency and better product reliability. Therefore, it plays an important role in manufacturing and production management.

  • Widely Applicable Across Different Industries

A significant advantage of conditional probability is its broad applicability. It is used in business, finance, insurance, healthcare, engineering, marketing, and many other fields. Organizations apply it to solve diverse problems involving uncertainty and decision-making. Whether assessing risks, forecasting demand, evaluating investments, or analyzing customer behavior, conditional probability provides valuable insights. Its versatility makes it one of the most important tools in probability and statistics. Because it can be adapted to various situations, conditional probability remains highly relevant in modern business and research environments.

Limitations of Conditional Probability

  • Requires Accurate and Reliable Data

One of the major limitations of conditional probability is its dependence on accurate and reliable data. The probability estimates are only as good as the information used in the calculations. If the data is incomplete, outdated, or incorrect, the resulting probabilities may be misleading. Businesses often face challenges in collecting high-quality data from customers, markets, or operational activities. Poor data quality can lead to inaccurate forecasts and ineffective decisions. Therefore, organizations must invest significant effort in data collection and verification to ensure meaningful and reliable conditional probability analysis.

  • Complex Calculations

Conditional probability calculations can become complicated, especially when multiple variables and conditions are involved. While simple examples are easy to understand, real-world business situations often require advanced statistical methods and large datasets. The complexity increases when there are numerous interrelated events or changing conditions. Managers without statistical expertise may find it difficult to perform or interpret these calculations. As a result, businesses may need specialized software or trained analysts to handle complex probability problems. This complexity can limit the practical application of conditional probability in some situations.

  • Dependent on Assumptions

Many conditional probability models rely on assumptions about the relationships between events. If these assumptions are incorrect, the probability estimates may not accurately reflect reality. For example, analysts may assume that certain factors influence customer behavior in a particular way, even though market conditions may differ. Such assumptions can affect the reliability of the results. In dynamic business environments, relationships between variables may change over time, making earlier assumptions invalid. Therefore, dependence on assumptions is a significant limitation that users must consider when interpreting conditional probability outcomes.

  • Difficult to Interpret

Conditional probability results can sometimes be difficult to interpret, particularly for individuals without a background in statistics. Understanding how one event influences another requires careful analysis and logical reasoning. In complex situations, the meaning of probability values may not be immediately obvious to managers or stakeholders. Misinterpretation can lead to poor decisions and incorrect conclusions. Businesses often need experts to explain and communicate the results effectively. This limitation reduces the accessibility of conditional probability and may create challenges in applying it to everyday business decision-making.

  • Time-Consuming Data Collection

Calculating conditional probability often requires large amounts of detailed information about related events and conditions. Collecting, organizing, and analyzing this data can be time-consuming and resource-intensive. Businesses may need to conduct surveys, monitor transactions, or gather historical records over long periods. This process can delay decision-making and increase operational costs. Small organizations with limited resources may find it particularly challenging to obtain the required information. Consequently, the time and effort involved in data collection can be a significant limitation of conditional probability analysis.

  • Sensitive to Changes in Data

Conditional probability estimates can change significantly when the underlying data changes. Even small variations in the probability of one event may affect the final conditional probability. In rapidly changing business environments, customer preferences, market conditions, and economic factors can alter probability estimates frequently. As a result, previously calculated probabilities may become outdated or less reliable. Businesses must continuously update their data and recalculate probabilities to maintain accuracy. This sensitivity to changing information can increase the complexity and cost of using conditional probability effectively.

  • Limited Predictive Power in Uncertain Situations

Although conditional probability improves prediction accuracy, it cannot guarantee future outcomes. Unexpected events such as economic crises, natural disasters, technological disruptions, or sudden changes in consumer behavior may occur without warning. These unforeseen factors can significantly affect actual results. Conditional probability is based on available information and known relationships, but it cannot account for every possible circumstance. Therefore, its predictive power is limited in highly uncertain or rapidly changing environments. Businesses should use conditional probability as a support tool rather than relying on it exclusively.

  • Cannot Eliminate Uncertainty Completely

Conditional probability helps measure uncertainty, but it cannot remove it entirely. Probability values represent likelihoods rather than certainties. Even when a conditional probability is very high, there is still a chance that the expected event will not occur. Business decisions based solely on probability estimates may overlook qualitative factors such as managerial judgment, market sentiment, or unforeseen opportunities. Therefore, conditional probability should be combined with experience, expertise, and other analytical tools. This limitation reminds decision-makers that uncertainty remains a part of all business activities despite statistical analysis.

Addition and Multiplication Theorems

Addition Theorem and Multiplication Theorem are important rules in probability that help determine the probability of combined events. The Addition Theorem is used when finding the probability that at least one of two events occurs, while the Multiplication Theorem is used when finding the probability that two events occur together. These theorems are widely used in statistics, business forecasting, insurance, risk analysis, and decision-making.

Addition Theorem of Probability

Addition Theorem is used to calculate the probability of the occurrence of either one event or another event or both events.

If A and B are any two events then the probability of happening of at least one of the events is defined as P(AUB) = P(A) + P(B)- P(A∩B)

Since events are nothing but sets,

From set theory, we have

n(AUB) = n(A) + n(B)- n(A∩B)

Dividing the above equation by n(S), (where S is the sample space)

n(AUB)/ n(S) = n(A)/ n(S) + n(B)/ n(S)- n(A∩B)/ n(S)

Then by the definition of probability,

P(AUB) = P(A) + P(B)- P(A∩B).

Example:

If the probability of solving a problem by two students George and James are 1/2 and 1/3 respectively then what is the probability of the problem to be solved.

Solution:

Let A and B be the probabilities of solving the problem by George and James respectively.

Then P(A)=1/2 and P(B)=1/3.

The problem will be solved if it is solved at least by one of them also.

So, we need to find P(AUB).

By addition theorem on probability, we have

P(AUB) = P(A) + P(B)- P(A∩B).

P(AUB) = 1/2 +.1/3 – 1/2 * 1/3 = 1/2 +1/3-1/6 = (3+2-1)/6 = 4/6 = 2/3

Note:

If A and B are any two mutually exclusive events then P(A∩B)=0.

Then P(AUB) = P(A)+P(B).

Multiplication Theorem on Probability

Multiplication Theorem is used to calculate the probability that two events occur together.

If A and B are any two events  of a sample space such that P(A) ≠0 and P(B)≠0, then

P(A∩B) = P(A) * P(B|A) = P(B) *P(A|B).

Example:  If P(A) =  1/5  P(B|A) =  1/3  then what is P(A∩B)?

Solution: P(A∩B) = P(A) * P(B|A) = 1/5 * 1/3 = 1/15

Multiplication Theorem for Independent Events

When the occurrence of one event does not affect the occurrence of another event, the events are called independent events.

Two events A and B are said to be independent if there is no change in the happening of an event with the happening of the other event.

i.e. Two events A and B are said to be independent if

P(A|B) = P(A) where P(B)≠0.

P(B|A) = P(B) where P(A)≠0.

i.e. Two events A and B are said to be independent if

P(A∩B) = P(A) * P(B).

Example:

While laying the pack of cards, let A be the event of drawing a diamond and B be the event of drawing an ace.

Then P(A) =  13/52 = 1/4 and P(B) =  4/52=1/13

Now, A∩B = drawing a king card from hearts.

Then P(A∩B) =  1/52

Now, P(A/B) = P(A∩B)/P(B) = (1/52)/(1/13) = 1/4 = P(A).

So, A and B are independent.

[Here, P(A∩B) = =    = P(A) * P(B)]

Note:

(1)    If 3 events A,B and C are independent the

P(A∩B∩C) = P(A)P(B)P(C).

(2)    If A and B are any two events, then P(AUB) = 1-P(A’)P(B’).

Probability Meaning and Approaches of Probability Theory

In our day to day life the “probability” or “chance” is very commonly used term. Sometimes, we use to say “Probably it may rain tomorrow”, “Probably Mr. X may come for taking his class today”, “Probably you are right”. All these terms, possibility and probability convey the same meaning. But in statistics probability has certain special connotation unlike in Layman’s view.

The theory of probability has been developed in 17th century. It has got its origin from games, tossing coins, throwing a dice, drawing a card from a pack. In 1954 Antoine Gornband had taken an initiation and an interest for this area.

After him many authors in statistics had tried to remodel the idea given by the former. The “probability” has become one of the basic tools of statistics. Sometimes statistical analysis becomes paralyzed without the theorem of probability. Probability of a given event is defined as the expected frequency of occurrence of the event among events of a like sort.” (Garrett)

The probability theory provides a means of getting an idea of the likelihood of occurrence of different events resulting from a random experiment in terms of quantitative measures ranging between zero and one. The probability is zero for an impossible event and one for an event which is certain to occur.

Approaches of Probability Theory

  1. Classical Probability:

The classical approach to probability is one of the oldest and simplest school of thought. It has been originated in 18th century which explains probability concerning games of chances such as throwing coin, dice, drawing cards etc.

The definition of probability has been given by a French mathematician named “Laplace”. According to him probability is the ratio of the number of favourable cases among the number of equally likely cases.

Or in other words, the ratio suggested by classical approach is:

Pr. = Number of favourable cases/Number of equally likely cases

For example, if a coin is tossed, and if it is asked what is the probability of the occurrence of the head, then the number of the favourable case = 1, the number of the equally likely cases = 2.

Pr. of head = 1/2

Symbolically it can be expressed as:

P = Pr. (A) = a/n, q = Pr. (B) or (not A) = b/n

1 – a/n = b/n = (or) a + b = 1 and also p + q = 1

p = 1 – q, and q = 1 – p and if a + b = 1 then so also a/n + b/n = 1

In this approach the probability varies from 0 to 1. When probability is zero it denotes that it is impossible to occur.

If probability is 1 then there is certainty for occurrence, i.e. the event is bound to occur.

Example:

From a bag containing 20 black and 25 white balls, a ball is drawn randomly. What is the probability that it is black.

Pr. of a black ball = 20/45 = 4/9 = p, 25 Pr. of a white ball = 25/45 = 5/9 = q

p = 4/9 and q = 5/9 (p + q= 4/9 + 5/9= 1)

  1. Relative Frequency Theory of Probability:

This approach to probability is a protest against the classical approach. It indicates the fact that if n is increased upto the ∞, we can find out the probability of p or q.

Example:

If n is ∞, then Pr. of A= a/n = .5, Pr. of B = b/n = 5

If an event occurs a times out of n its relative frequency is a/n. When n becomes ∞, is called the limit of relative frequency.

Pr. (A) = limit a/n

where n → ∞

Pr. (B) = limit bl.t. here → ∞.

Axiomatic approach

An axiomatic approach is taken to define probability as a set function where the elements of the domain are the sets and the elements of range are real numbers. If event A is an element in the domain of this function, P(A) is the customary notation used to designate the corresponding element in the range.

Probability Function

A probability function p(A) is a function mapping the event space A of a random experiment into the interval [0,1] according to the following axioms;

Axiom 1. For any event A, 0 ≤ P(A) ≤ 1

Axiom 2. P(Ω) = 1

Axiom 3. If A and B are any two mutually exclusive events then,

                              P(A ∪ B)) = P(A) + P(B)

As given in the third axiom the addition property of the probability can be extended to any number of events as long as the events are mutually exclusive. If the events are not mutually exclusive then;

P(A ∪ B) = P(A) + P(B) – P(A∩B)

P(A∩B) is Φ if both the events are mutually exclusive.

If there are two types of objects among the objects of similar or other natures then the probability of one object i.e. Pr. of A = .5, then Pr. of B = .5

Lines of Regression; Co-efficient of regression

Regression Line is the line that best fits the data, such that the overall distance from the line to the points (variable values) plotted on a graph is the smallest. In other words, a line used to minimize the squared deviations of predictions is called as the regression line.

There are as many numbers of regression lines as variables. Suppose we take two variables, say X and Y, then there will be two regression lines:

  • Regression line of Y on X: This gives the most probable values of Y from the given values of X.
  • Regression line of X on Y: This gives the most probable values of X from the given values of Y.

The algebraic expression of these regression lines is called as Regression Equations. There will be two regression equations for the two regression lines.

The correlation between the variables depend on the distance between these two regression lines, such as the nearer the regression lines to each other the higher is the degree of correlation, and the farther the regression lines to each other the lesser is the degree of correlation.

The correlation is said to be either perfect positive or perfect negative when the two regression lines coincide, i.e. only one line exists. In case, the variables are independent; then the correlation will be zero, and the lines of regression will be at right angles, i.e. parallel to the X axis and Y axis.

The regression lines cut each other at the point of average of X and Y. This means, from the point where the lines intersect each other the perpendicular is drawn on the X axis we will get the mean value of X. Similarly, if the horizontal line is drawn on the Y axis we will get the mean value of Y.

Co-efficient of Regression

The Regression Coefficient is the constant ‘b’ in the regression equation that tells about the change in the value of dependent variable corresponding to the unit change in the independent variable.

If there are two regression equations, then there will be two regression coefficients:

  • Regression Coefficient of X on Y:

The regression coefficient of X on Y is represented by the symbol bxy that measures the change in X for the unit change in Y. Symbolically, it can be represented as:

The bxy can be obtained by using the following formula when the deviations are taken from the actual means of X and Y:When the deviations are obtained from the assumed mean, the following formula is used:

  • Regression Coefficient of Y on X:

The symbol byx is used that measures the change in Y corresponding to the unit change in X. Symbolically, it can be represented as:


In case, the deviations are taken from the actual means; the following formula is used:
The byx can be  calculated by using the following formula when the deviations are taken from the assumed means:

The Regression Coefficient is also called as a slope coefficient because it determines the slope of the line i.e. the change in the independent variable for the unit change in the independent variable

Difference between Correlation and Regression

Correlation and Regression

Correlation and regression are two important statistical tools used to study the relationship between variables. Both help managers analyze data and make informed business decisions. While correlation measures the degree and direction of relationship between variables, regression explains the cause-and-effect relationship and helps in prediction. Though closely related, their objectives and applications are different.

Correlation

The term correlation is a combination of two words ‘Co’ (together) and relation (connection) between two quantities. Correlation is when, at the time of study of two variables, it is observed that a unit change in one variable is retaliated by an equivalent change in another variable, i.e. direct or indirect. Or else the variables are said to be uncorrelated when the movement in one variable does not amount to any movement in another variable in a specific direction. It is a statistical technique that represents the strength of the connection between pairs of variables.

Correlation refers to a statistical measure that indicates the extent and direction of relationship between two variables. It shows whether variables move together or in opposite directions. Correlation is expressed numerically through the correlation coefficient (r), whose value lies between –1 and +1. A positive value indicates direct relationship, a negative value indicates inverse relationship, and zero indicates no relationship. Correlation does not indicate causation; it only measures association.

On the contrary, when the two variables move in different directions, in such a way that an increase in one variable will result in a decrease in another variable and vice versa, This situation is known as negative correlation. For instance: Price and demand of a product.

The measures of correlation are given as under:

  • Karl Pearson’s Product-moment correlation coefficient
  • Spearman’s rank correlation coefficient
  • Scatter diagram
  • Coefficient of concurrent deviations

Regression

Regression analysis is a statistical technique that establishes a functional or causal relationship between a dependent variable and one or more independent variables. It helps estimate or predict the value of one variable based on the known value of another. Regression provides a mathematical equation that explains how much change in the dependent variable is caused by changes in independent variables. It is widely used in forecasting and planning.

Differences Between Correlation and Regression

1. Meaning and Concept

Correlation and regression differ fundamentally in their basic meaning and conceptual approach. Correlation is a statistical measure that shows the degree and direction of relationship between two variables. It simply answers the question of whether variables are related and how strongly they move together. It does not explain why the relationship exists.

Regression, on the other hand, is a statistical technique that establishes a functional or causal relationship between variables. It explains how one variable (dependent) is affected by changes in another variable (independent). Regression goes beyond association and attempts to quantify the impact of one variable on another. Thus, while correlation is concerned with measuring association, regression focuses on explanation and prediction, making it more powerful for business decision-making.

2. Objective of Study

The objective of correlation is to determine whether a relationship exists between variables and to measure its strength and direction. It helps analysts understand patterns and tendencies in data. Correlation answers questions like: Are sales and advertising related? or Do income and consumption move together?

The objective of regression is to predict or estimate the value of one variable based on another. It is used when a business wants to forecast outcomes, such as predicting sales based on price or estimating costs based on output. Regression analysis provides a mathematical equation that can be used for planning, control, and forecasting. Hence, correlation is mainly descriptive in nature, while regression is both descriptive and predictive, making regression more suitable for managerial decision-making

3. Nature of Relationship

Correlation measures the degree of linear relationship between variables but does not indicate any cause-and-effect connection. Even if two variables are highly correlated, one may not necessarily cause changes in the other. For example, ice cream sales and electricity consumption may show correlation due to seasonal effects, not causation.

Regression, in contrast, assumes a cause-and-effect relationship between variables. It explains how changes in the independent variable bring about changes in the dependent variable. For instance, regression can estimate how much sales will increase due to a specific increase in advertising expenditure. Thus, correlation reflects association only, whereas regression attempts to establish dependence, which is crucial for business forecasting and strategic planning.

4. Treatment of Variables

In correlation, variables are treated symmetrically. There is no distinction between dependent and independent variables. The correlation between X and Y is the same as the correlation between Y and X. Both variables are given equal importance, and the analysis does not require identifying which variable influences the other.

In regression, variables are treated asymmetrically. One variable is clearly identified as the dependent variable, and the other(s) as independent variables. The entire analysis is based on explaining or predicting the dependent variable. For example, sales may depend on price and advertising. This clear distinction is essential for regression analysis, making it more suitable for practical business applications where cause-and-effect relationships are required.

5. Numerical Measure and Output

Correlation is expressed using a single numerical value, called the correlation coefficient (r). This value ranges from –1 to +1 and indicates only the strength and direction of relationship. A single figure summarizes the entire relationship, which makes correlation easy to compute and interpret but limited in analytical depth.

Regression produces regression equations, such as Y = a + bX, where coefficients show the magnitude of change in the dependent variable due to a unit change in the independent variable. These equations provide detailed quantitative insights and allow prediction. Therefore, while correlation provides a summary measure, regression offers a complete analytical model useful for forecasting and decision-making.

6. Symmetry and Direction

Correlation is symmetric in nature, meaning that correlation between X and Y is exactly the same as correlation between Y and X. There is no concept of direction of dependence in correlation analysis. This symmetry limits its usefulness in predictive analysis.

Regression is not symmetric. Regression of Y on X is different from regression of X on Y. Each regression equation serves a specific purpose depending on which variable is treated as dependent. This directional nature makes regression a powerful analytical tool. It helps managers decide which variable should be predicted and which variables should be used as predictors, making regression more practical for real-world business problems.

7. Use in Prediction and Forecasting

Correlation is not suitable for prediction. Although it indicates the existence of a relationship, it does not provide a mechanism to estimate future values. A high correlation does not necessarily mean accurate forecasting is possible.

Regression is specifically designed for prediction and forecasting. Using regression equations, businesses can estimate future sales, costs, profits, or demand based on known values of independent variables. This makes regression extremely valuable for planning, budgeting, and policy formulation. Thus, correlation is primarily exploratory, while regression is predictive and decision-oriented.

8. Practical Application in Business

Correlation is mainly used for preliminary analysis. It helps identify whether variables are related and whether further analysis is worthwhile. For example, before performing regression, managers often check correlation to see if a relationship exists.

Regression has direct practical applications in business, including sales forecasting, demand estimation, cost control, pricing decisions, and investment analysis. It provides a scientific basis for managerial decisions. Hence, correlation serves as a starting point in analysis, while regression forms the foundation of advanced quantitative decision-making in business.

Key Differences Between Correlation and Regression

Aspect Correlation Regression
Meaning Correlation measures the degree and direction of relationship between two variables. Regression measures the functional and causal relationship between variables.
Nature It shows association only. It shows cause-and-effect relationship.
Objective To determine whether variables are related and how strongly. To predict or estimate the value of one variable from another.
Type of Relationship Indicates linear association only. Explains dependence of one variable on another.
Variables Does not distinguish between dependent and independent variables. Clearly distinguishes dependent and independent variables.
Direction of Influence No direction of influence is implied. Direction of influence is clearly defined.
Numerical Measure Expressed through a single value called correlation coefficient (r). Expressed through regression equations.
Range of Values Lies between –1 and +1. No fixed range for regression coefficients.
Symmetry Symmetric in nature (X with Y = Y with X). Asymmetric (Regression of Y on X ≠ X on Y).
Use in Prediction Not suitable for prediction. Specifically used for forecasting and prediction.
Number of Equations Only one coefficient is calculated. Two regression equations can be formed.
Dependency Assumption No assumption of dependency. Assumes dependency of one variable on another.
Effect of Change in Units Correlation coefficient is unit-free. Regression coefficients depend on measurement units.
Business Application Used mainly for preliminary analysis. Widely used for decision-making and planning.
Analytical Depth Provides limited analytical insight. Provides detailed quantitative analysis.

Rank correlation; coefficient of determination

Rank Correlation

Sometimes there doesn’t exist a marked linear relationship between two random variables but a monotonic relation (if one increases, the other also increases or instead, decreases) is clearly noticed. A Pearson’s Correlation Coefficient evaluation, in this case, would give us the strength and direction of the linear association only between the variables of interest. Herein comes the advantage of the Spearman Rank Correlation methods, which will instead, give us the strength and direction of the monotonic relation between the connected variables. This can be a good starting point for further evaluation.

The Spearman Rank Order Correlation Coefficient

The Spearman’s Correlation Coefficient, represented by ρ or by rR, is a nonparametric measure of the strength and direction of the association that exists between two ranked variables. It determines the degree to which a relationship is monotonic, i.e., whether there is a monotonic component of the association between two continuous or ordered variables.

Monotonicity is “less restrictive” than that of a linear relationship. Although monotonicity is not actually a requirement of Spearman’s correlation, it will not be meaningful to pursue Spearman’s correlation to determine the strength and direction of a monotonic relationship if we already know the relationship between the two variables is not monotonic.

On the other hand if, for example, the relationship appears linear (assessed via scatterplot) one would run a Pearson’s correlation because this will measure the strength and direction of any linear relationship.

Spearman Ranking of the Data

We must rank the data under consideration before proceeding with the Spearman’s Rank Correlation evaluation. This is necessary because we need to compare whether on increasing one variable, the other follows a monotonic relation (increases or decreases regularly) with respect to it or not.

Thus, at every level, we need to compare the values of the two variables. The method of ranking assigns such ‘levels’ to each value in the dataset so that we can easily compare it.

  • Assign number 1 to n (the number of data points) corresponding to the variable values in the order highest to lowest.
  • In the case of two or more values being identical, assign to them the arithmetic mean of the ranks that they would have otherwise occupied.

The Formula for Spearman Rank Correlation

where is the number of data points of the two variables and di is the difference in the ranks of the ith element of each random variable considered. The Spearman correlation coefficient, ρ, can take values from +1 to -1.

  • A ρ of +1 indicates a perfect association of ranks
  • A ρ of zero indicates no association between ranks and
  • ρ of -1 indicates a perfect negative association of ranks.
    The closer ρ is to zero, the weaker the association between the ranks.

Coefficient of Determination

The Coefficient of determination is the square of the coefficient of correlation r2 which is calculated to interpret the value of the correlation. It is useful because it explains the level of variance in the dependent variable caused or explained by its relationship with the independent variable.

The coefficient of determination explains the proportion of the explained variation or the relative reduction in variance corresponding to the regression equation rather than about the mean of the dependent variable. For example, if the value of r = 0.8, then r2 will be 0.64, which means that 64% of the variation in the dependent variable is explained by the independent variable while 36% remains unexplained.

Thus, the coefficient of determination is the ratio of explained variance to the total variance that tells about the strength of linear association between the variables, say X and Y. The value of r2 lies between 0 and 1 and observes the following relationship with ‘r’.

  • With the decrease in the value of ‘r’ from its maximum value of 1, the ‘r2’ also decreases much more rapidly.
  • The value of ‘r’ will always be greater than ‘r2’ unless the r2=0 or 1.

The coefficient of determination also explains that how well the regression line fits the statistical data. The closer the regression line to the points plotted on a scatter diagram, the more likely it explains all the variation and the farther the line from the points the lesser is the ability to explain the variance.

Properties of Correlation co-efficient

The following are the main properties of correlation.

  1. Coefficient of Correlation lies between -1 and +1:

The coefficient of correlation cannot take value less than -1 or more than one +1. Symbolically,

-1<=r<= + 1 or | r | <1.

  1. Coefficients of Correlation are independent of Change of Origin:

This property reveals that if we subtract any constant from all the values of X and Y, it will not affect the coefficient of correlation.

  1. Coefficients of Correlation possess the property of symmetry:

The degree of relationship between two variables is symmetric as shown below:

  1. Coefficient of Correlation is independent of Change of Scale:

This property reveals that if we divide or multiply all the values of X and Y, it will not affect the coefficient of correlation.

  1. Co-efficient of correlation measures only linear correlation between X and Y.
  2. If two variables X and Y are independent, coefficient of correlation between them will be zero.

Karl Pearson’s Coefficient of Correlation is widely used mathematical method wherein the numerical expression is used to calculate the degree and direction of the relationship between linear related variables.

Pearson’s method, popularly known as a Pearsonian Coefficient of Correlation, is the most extensively used quantitative methods in practice. The coefficient of correlation is denoted by “r”.

If the relationship between two variables X and Y is to be ascertained, then the following formula is used:

Properties of Coefficient of Correlation

  • The value of the coefficient of correlation (r) always lies between±1. Such as:
    r=+1, perfect positive correlation
    r=-1, perfect negative correlation
    r=0, no correlation
  • The coefficient of correlation is independent of the origin and scale.By origin, it means subtracting any non-zero constant from the given value of X and Y the vale of “r” remains unchanged. By scale it means, there is no effect on the value of “r” if the value of X and Y is divided or multiplied by any constant.
  • The coefficient of correlation is a geometric mean of two regression coefficient.Symbolically it is represented as:
  • The coefficient of correlation is “zero”when the variables X and Y are independent. But, however, the converse is not true.

Assumptions of Karl Pearson’s Coefficient of Correlation

  1. The relationship between the variables is “Linear”,which means when the two variables are plotted, a straight line is formed by the points plotted.
  2. There are a large number of independent causes that affect the variables under study so as to form a Normal Distribution. Such as, variables like price, demand, supply, etc. are affected by such factors that the normal distribution is formed.
  3. The variables are independent of each other.

Note: The coefficient of correlation measures not only the magnitude of correlation but also tells the direction. Such as, r = -0.67, which shows correlation is negative because the sign is “-“and the magnitude is 0.67.

Scatter Diagram

Scatter Diagram Method is the simplest method to study the correlation between two variables wherein the values for each pair of a variable is plotted on a graph in the form of dots thereby obtaining as many points as the number of observations. Then by looking at the scatter of several points, the degree of correlation is ascertained.

The degree to which the variables are related to each other depends on the manner in which the points are scattered over the chart. The more the points plotted are scattered over the chart, the lesser is the degree of correlation between the variables. The more the points plotted are closer to the line, the higher is the degree of correlation. The degree of correlation is denoted by “r”.

The following types of scatter diagrams tell about the degree of correlation between variable X and variable Y.

  1. Perfect Positive Correlation (r = +1):

The correlation is said to be perfectly positive when all the points lie on the straight line rising from the lower left-hand corner to the upper right-hand corner.

2. Perfect Negative Correlation (r = -1):

When all the points lie on a straight line falling from the upper left-hand corner to the lower right-hand corner, the variables are said to be negatively correlated.

3. High Degree of +Ve Correlation (r = + High):

The degree of correlation is high when the points plotted fall under the narrow band and is said to be positive when these show the rising tendency from the lower left-hand corner to the upper right-hand corner.

4. High Degree of –Ve Correlation (r = – High):

The degree of negative correlation is high when the point plotted fall in the narrow band and show the declining tendency from the upper left-hand corner to the lower right-hand corner.

5. Low degree of +Ve Correlation (r = + Low):

The correlation between the variables is said to be low but positive when the points are highly scattered over the graph and show a rising tendency from the lower left-hand corner to the upper right-hand corner.

6. Low Degree of –Ve Correlation (r = + Low):

The degree of correlation is low and negative when the points are scattered over the graph and the show the falling tendency from the upper left-hand corner to the lower right-hand corner.

7. No Correlation (r = 0):

The variable is said to be unrelated when the points are haphazardly scattered over the graph and do not show any specific pattern. Here the correlation is absent and hence r = 0.

Thus, the scatter diagram method is the simplest device to study the degree of relationship between the variables by plotting the dots for each pair of variable values given. The chart on which the dots are plotted is also called as a Dotogram.

Methods of Studying Correlation

The Correlation is a statistical tool used to measure the relationship between two or more variables, i.e. the degree to which the variables are associated with each other, such that the change in one is accompanied by the change in another.

The correlation is said to be linear when the change in the amount of one variable tends to bear a constant ratio to the amount of change in another variable. Whereas, the non-linear or curvilinear correlation is when the ratio of the amount of change in one variable to the amount of change in another variable is not constant.

These figures clearly show the difference between the linear and non-linear correlation. To determine the linearity and non-linearity among the variables and the extent to which these are correlated, following are the important methods used to ascertain these:

  1. Scatter Diagram Method
  2. Karl Pearson’s Coefficient of Correlation
  3. Spearman’s Rank Correlation Coefficient; and
  4. Methods of Least Squares

Among these, the first method, i.e. scatter diagram method is based on the study of graphs while the rest is mathematical methods that use formulae to calculate the degree of correlation between the variables.  The researcher may apply either of these methods on the basis of the nature of variables being considered in ascertaining the association between them.

error: Content is protected !!