 by
by Rank Correlation
Sometimes there doesn’t exist a marked linear relationship between two random variables but a monotonic relation (if one increases, the other also increases or instead, decreases) is clearly noticed. A Pearson’s Correlation Coefficient evaluation, in this case, would give us the strength and direction of the linear association only between the variables of interest. Herein comes the advantage of the Spearman Rank Correlation methods, which will instead, give us the strength and direction of the monotonic relation between the connected variables. This can be a good starting point for further evaluation.
The Spearman Rank Order Correlation Coefficient
The Spearman’s Correlation Coefficient, represented by ρ or by rR, is a nonparametric measure of the strength and direction of the association that exists between two ranked variables. It determines the degree to which a relationship is monotonic, i.e., whether there is a monotonic component of the association between two continuous or ordered variables.
Monotonicity is “less restrictive” than that of a linear relationship. Although monotonicity is not actually a requirement of Spearman’s correlation, it will not be meaningful to pursue Spearman’s correlation to determine the strength and direction of a monotonic relationship if we already know the relationship between the two variables is not monotonic.
On the other hand if, for example, the relationship appears linear (assessed via scatterplot) one would run a Pearson’s correlation because this will measure the strength and direction of any linear relationship.

Spearman Ranking of the Data
We must rank the data under consideration before proceeding with the Spearman’s Rank Correlation evaluation. This is necessary because we need to compare whether on increasing one variable, the other follows a monotonic relation (increases or decreases regularly) with respect to it or not.
Thus, at every level, we need to compare the values of the two variables. The method of ranking assigns such ‘levels’ to each value in the dataset so that we can easily compare it.
- Assign number 1 to n (the number of data points) corresponding to the variable values in the order highest to lowest.
- In the case of two or more values being identical, assign to them the arithmetic mean of the ranks that they would have otherwise occupied.
The Formula for Spearman Rank Correlation
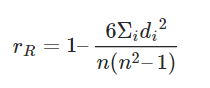
where n is the number of data points of the two variables and di is the difference in the ranks of the ith element of each random variable considered. The Spearman correlation coefficient, ρ, can take values from +1 to -1.
- A ρ of +1 indicates a perfect association of ranks
- A ρ of zero indicates no association between ranks and
- ρ of -1 indicates a perfect negative association of ranks.
The closer ρ is to zero, the weaker the association between the ranks.
Coefficient of Determination
The Coefficient of determination is the square of the coefficient of correlation r2 which is calculated to interpret the value of the correlation. It is useful because it explains the level of variance in the dependent variable caused or explained by its relationship with the independent variable.
The coefficient of determination explains the proportion of the explained variation or the relative reduction in variance corresponding to the regression equation rather than about the mean of the dependent variable. For example, if the value of r = 0.8, then r2 will be 0.64, which means that 64% of the variation in the dependent variable is explained by the independent variable while 36% remains unexplained.
Thus, the coefficient of determination is the ratio of explained variance to the total variance that tells about the strength of linear association between the variables, say X and Y. The value of r2 lies between 0 and 1 and observes the following relationship with ‘r’.
- With the decrease in the value of ‘r’ from its maximum value of 1, the ‘r2’ also decreases much more rapidly.
- The value of ‘r’ will always be greater than ‘r2’ unless the r2=0 or 1.
The coefficient of determination also explains that how well the regression line fits the statistical data. The closer the regression line to the points plotted on a scatter diagram, the more likely it explains all the variation and the farther the line from the points the lesser is the ability to explain the variance.