Convertible Debentures

The Convertible Debentures are a type of loan that can be converted into the stock of the company after a stipulated time period at the option of the holder or the issuer in special circumstances. These are issued with the intent to raise money to expand or maintain the business operations at a considerable low-interest rate.

The debentures are the long-term debt instruments on which the company is obliged to pay interest to its holders. Sometimes, the debentures are issued with an option of convertibility in which the debenture holder can get his debentures converted into the stock of the company, either fully or partly.

As per the SEBI, the following provisions apply in case the debentures are converted into the stock either fully or partly:

  1. The conversion time along with the conversion premium should be stated in the prospectus.
  2. The conversion, partial or full, must be at the disposal of the debenture holder, provided the conversion takes place at or after 18 months but before 36 months.
  3. The conversion is to be made optional with “put” or “call” option in case the debentures provide for conversion after 36 months.
  4. In case, the conversion period of fully convertible debentures exceeds 18 months; then a compulsory credit rating is required.

Through above provisions, it is clear that the convertible debentures could be of three types:

  1. Compulsory convertible debentures provide for the conversion within 18 months of the issue
  2. Optional convertible debentures provide for the conversion within 36 months of the issue.
  3. Debenture with “call “or “put” option in case the conversion exceeds 36 months.

The convertible debentures are beneficial to the investor since they get an opportunity to become the owner of the company and might leave in case the company experiences the loss. But however, the convertible debentures are unsecured and in case the company goes bankrupt, the holder gets his money only after all the secured creditors are paid.

The major disadvantage to the issuer is that, if the company makes huge profits, then the investor would like to become the shareholder or the owner which results in the dilution of ownership in the company.

Types of Convertible Debentures

Fully Convertible Debentures

Under these securities, the whole value of debentures is convertible into equity shares of the company. The ratio of conversion is determined at the time of issue of these securities.

Partly Convertible Debentures

These securities differ from fully convertible ones. Under them, only some part of the debentures is eligible for conversion into equity shares. Again, the ratio of conversion is determined at the time of issuance of these securities. A part of the debt can be converted into equity shares after the approval of debt holders.

Concept of Private Placement of Securities

A private placement is a capital raising event that involves the sale of securities to a relatively small number of select investors.

A private placement is different from a public issue in which securities are made available for sale on the open market to any type of investor.

As per the definition under Explanation II to Sub Section 1 of Section 42 of the Companies Act, 2013 Private Placement means any offer of securities or invitation to subscribe securities to a select group of persons by a Company ( other than by way of public offer) through issue of a private placement offer letter and which satisfies the conditions specified in this section.

Private Placement is governed by Section 42 of the Companies Act, 2013. As per Section 42 of the Companies Act, 2013 the maximum number of persons to which allotment can be done in a year shall not exceed 200( Excluding Qualified Institutional Buyers and Employees who have been given securities under ESOP Scheme) in a financial year. If the same exceeds the prescribed limit then in will be deemed to be a public issue and the Company has to follow the procedure of Public issue. As per the present scenario, if a Company, listed or unlisted, makes an offer of Securities to more than 200 persons during a year, whether it receives money or not, to any person whether in India or abroad and intends to get its Securities listed on a recognized stock exchange whether in India or abroad, shall be deemed to be a Public issue and the Company has to Comply with the provisions of Public issue.

Procedure

  1. Company planning to make Private Placement has to first pass a special resolution in the general meeting of the Company.

However, in case of Non Convertible Debentures(NCD) it will be sufficient if the Company passes a special resolution once in a year for all the Private Placements to be made by the for the NCD during the year.[Rule 14(2)].

  1. Next, the Company has to issue a Private Placement letter of offer to the Identified persons by the Board to whom the allotment is to be made. [ Companies Amendment Act, 2017].

However, it is to be noted that the Private Placement letter of offer shall not contain Right to Renunciation.[ Companies Amendment Act, 2017].

The Company also has to keep the records of the same and file the details with the ROC within 30 days from the date of issue of Private Placement letter of offer.[Rule 14(3)].

  1. Once the Company receives the allotment money, the Company shall allot the Securities within 60 days and if it fails to do so then refund the money within the next 15 days. If the Company fails to do so then interest @12% will be charged from the expiry of 60th day.
  2. The Company has to file return of allotment within 15 days of allotment in Form PAS-3 .Companycannot utilize the Application money until it has filed Return of allotment with the ROC[ Companies Amendment Act, 2017].

Following points are to be noted

  1. The Application money to be received shall be either through Cheque, Demand Draft or other banking channels except cash. [Section 42(5)]
  2. The minimum application size shall not be less than Rupees Twenty Thousand per person.
  3. Private Placement shall not be done unless any previous offer or invitation has been completed or withdrawn or abandoned by the Company. [Section 42(3)].
  4. The Company shall not advertise about the Private Placement to the public.
  5. If a Company makes contravenes the provisions of this Section, then the Company, Promoters and its Directors shall be liable for a penalty which may extend to the amount involved in the contravention or rupees two crores, whichever is higher. Further the Company also has to refund all monies to subscribers within 30 days of the order.
  6. Restriction of 200 is for each kind of a Security .

Private Placement Advantages

Private placements present the following advantages:

  • Long Term
    Private placements provide longer maturities than typical bank financing, at a fixed-interest rate. This is ideal for when a business is presented with a growth opportunity where they wouldn’t see the return on their investment right away; a business would have more time to pay back the private placement while having certainty of financing cost over the life of that investment.
    Also, private placements are typically “buy-and-hold,” so the company would benefit from having a long-term relationship with the same investor throughout the life of the financing.
  • Speed in Execution
    The growth and maturity of the private placement market has led to improved standardization of documentation, visibility of pricing and terms, increased capacity for financings as well as overall increase of size and depth of the market ($10MM – $1B+). Thus, the private placement market fosters an environment that allows for quick execution of an investment, generally within 6-8 weeks (for the first transaction. Follow-on financings can be executed within a shorter time frame).

    Additionally, it is typically faster to issue a private placement versus a corporate bond in the public market because the issuer is not required to expend time and resources creating a prospectus and registering with the SEC.
  • Complement to Existing Financing
    Private placements also help diversify a company’s sources of capital and capital structure. Since the terms can be customized, private placements can complement existing bank debt versus compete with it, and can allow a company to better manage its debt obligations. Diversification of funding sources is particularly important during market cycles when bank liquidity may be tight.

    Private placements enable privately-held, middle-market companies and public companies to access capital just as they would with an underwritten public debt offering, but without certain requirements, such as ratings, registrations, or minimum size. And for public companies, private placements can offer superior execution relative to the public bond market for small issuance sizes as well as greater structural flexibility.
  • Privacy and Control
    Private placement transactions are negotiated confidentially. Also, public disclosure requirements are limited, compared to those found in the public market. Companies would not be beholden to public shareholders.

Uses

Long-term capital is congruent with a company’s long-term investments. Thus, capital raised from issuing a private placement is most commonly used to support long-term initiatives versus short-term needs, such as working capital. Companies, both public and private, use the capital raised from private placements in the following ways:

  • Debt refinancing
  • Debt diversification
  • Expansion/Growth capital
  • Acquisitions
  • Stock buyback/Recapitalization
  • Taking a public company privat
  • Employee Stock Ownership Plan (ESOP)

Pricing and Payment Structure

Private placement debt is predominantly a fixed-income note that pays a set coupon, on a negotiated schedule. Private placements are priced similarly to public securities, where pricing is determined by the U.S. Treasury rate, with the addition of a credit risk premium.

Repayment of the principal can be accomplished in several ways, depending on the credit quality and needs of the issuer, such as sinking fund payments (amortization) or “bullets” as well as tailored/bespoke amortization. Interest is typically paid quarterly or semi-annually.

Working capital funds

Working Capital is basically an indicator of the short-term financial position of an organization and is also a measure of its overall efficiency. Working Capital is obtained by subtracting the current liabilities from the current assets. This ratio indicates whether the company possesses sufficient assets to cover its short-term debt.

Working Capital indicates the liquidity levels of companies for managing day-to-day expenses and covers inventory, cash, accounts payable, accounts receivable and short-term debt that is due. Working capital is derived from several company operations such as debt and inventory management, supplier payments and collection of revenues.

The sources for working capital can either be long term, short term or even spontaneous. Spontaneous working capital are majorly derived from trade credit including notes payable and bills payable while short term working capital sources include dividend or tax provisions, cash credit, public deposits, trade deposits, short-term loans, bills discounting, inter-corporate loans and also commercial paper.

For the long-term, working capital sources include long-term loans, provision for depreciation, retained profits, debentures and share capital. These are major working capital sources for organizations based on their requirements.

Types of Working Capital

There are several types of working capital based on the balance sheet or operating cycle view. The balance sheet view classifies working capital into net (current liabilities subtracted from current assets featuring in the company’s balance sheet) and gross working capital (current assets in the balance sheet).

On the other hand, operating cycle view classifies working capital into temporary (difference between net working capital & permanent working capital) and permanent (fixed assets) working capital. Temporary working capital can be further broken down into reserve.

Working Capital Cycle

The Working Capital Cycle or WCC means the time period that is taken to convert net current liabilities and assets into cash by any organization. This is an indicator of the organizational efficiency in terms of effectively managing liquidity position in the short-term and the cycle, which is calculated in days, is basically the time period between the generation of revenue through cash by selling products and the buying of materials for producing these products.

The shorter this working capital cycle, the swifter will the company be able to free up its cash, which is blocked. In case the cycle is long, the capital usually gets stuck without earning returns in the operational cycle. Businesses always strive to lower this working capital cycle with a view towards enhancing liquidity in the short-term.

Working Capital Formula

The formula for working capital is the following:

Working Capital = Current Assets – Current Liabilities

The working capital ratio is the indicator of whether ample short-term assets are possessed by an organization for taking care of short-term debt. A ratio lower than 1 is an indicator of negative working capital while positive/sufficient working capital is usually indicated by a ratio between 1.2 and 2.0. Anything exceeding 2 usually indicates there are excess assets that are not being invested by the company and therefore represents missed opportunity.

The organization may be in trouble if the current assets do not exceed the liabilities at present. Working capital also provides a picture of the efficiency of the organization. Money that is locked in the market, inventory or in the hands of customers-who have not paid up yet, will not be considered viable when it comes to settling obligations.

Funding Working Capital

  • Zero collateral requirements
  • Loans up to Rs. Crore within 24 hours
  • Flexi Interest-only Loans where EMIs could consist of only interest, with principal payable at the end of the tenor
  • Doorstep document pick-up for faster processing
  • Swift online application & approval process
  • Minimal Documentation: Only KYC documents, business vintage, passport-sized photo and financial documents are required.
  • Easy-to-meet eligibility criteria for SMEs and business-owners

Introduction to Capital Structure Theories

Capital Structure means a combination of all long-term sources of finance. It includes Equity Share Capital, Reserves and Surplus, Preference Share capital, Loan, Debentures and other such long-term sources of finance. A company has to decide the proportion in which it should have its own finance and outsider’s finance particularly debt finance. Based on the proportion of finance, WACC and Value of a firm are affected. There are four capital structure theories for this, viz. net income, net operating income, traditional and M&M approach.

Net income

Net income approach and net operating income approach were proposed by David Durand. According to NI approach, there exists positive relationship between capital structure and valuation of firm and change in the pattern of capitalisation brings about corresponding change in the overall cost of capital and total value of the firm.

Thus, with an increase in the ratio of debt to equity overall cost of capital will decline and market price of equity stock as well as value of the firm will rise. The converse will hold true if ratio of debt to equity tends to decline.

This approach is based on three following assumptions:

(1) There are no taxes;

(2) Cost of debt is less than cost of equity;

(3) The use of debt does not change the risk perception of investors. This implies that there will be no change in cost of debt and cost of equity even if degree of financial leverages changes.

On the basis of the above assumptions, it has been held in the NI approach that increased use of debt will magnify the shareholders’ earnings (because cost of debt and cost of equity will remain constant) and thereby result in rise in share values of equity and so also value of the firm.

Thus, a firm can achieve optimal capital structure by making judicious use of debt and equity and attempt to maximise the market price of its stock.

According to NI approach a firm may increase the total value of the firm by lowering its cost of capital.

When cost of capital is lowest and the value of the firm is greatest, we call it the optimum capital structure for the firm and, at this point, the market price per share is maximised.

The same is possible continuously by lowering its cost of capital by the use of debt capital. In other words, using more debt capital with a corresponding reduction in cost of capital, the value of the firm will increase.

The same is possible only when:

(i) Cost of Debt (Kd) is less than Cost of Equity (Ke);

(ii) There are no taxes; and

(iii) The use of debt does not change the risk perception of the investors since the degree of leverage is increased to that extent.

Since the amount of debt in the capital structure increases, weighted average cost of capital decreases which leads to increase the total value of the firm. So, the increased amount of debt with constant amount of cost of equity and cost of debt will highlight the earnings of the shareholders.

Net Operating Income Approach (NOI):

According to Net Operating Income Approach which is just opposite to NI approach, the overall cost of capital and value of firm are independent of capital structure decision and change in degree of financial leverage does not bring about any change in value of firm and cost of capital.

The market value of the firm is determined by the following formula:

The crucial assumptions of the NOI approach are:

(1) The firm is evaluated as a whole by the market. Accordingly, overall capitalisation rate is used to calculate the value of the firm. The split of capitalisation between debt and equity is not significant.

(2) Overall capitalisation rate remains constant regardless of any change in degree of financial leverage.

(3) Use of debt as cheaper source of funds would increase the financial risk to shareholders who demand higher cost on their funds to compensate for the additional risk. Thus, the benefits of lower cost of debt are offset by the higher cost of equity.

(4) The cost of debt would stay constant.

(5) The firm does not pay income taxes.

Thus, under the NOI approach the total value of the firm as stated above is determined by dividing the net operating income (EBIT) by the overall capitalisation rate and market value of equity (S) can be found out by subtracting the market value of debt (B) from the overall value of the firm (V). In other words.

Now we want to highlight the Net Operating Income (NOI) Approach which was advocated by David Durand based on certain assumptions.

They are:

(i) The overall capitalisation rate of the firm Kw is constant for all degree of leverages;

(ii) Net operating income is capitalised at an overall capitalisation rate in order to have the total market value of the firm.

Thus, the value of the firm, V, is ascertained at overall cost of capital (Kw):

V = EBIT/Kw (since both are constant and independent of leverage)

(iii) The market value of the debt is then subtracted from the total market value in order to get the market value of equity.

S – V – T 

(iv) As the Cost of Debt is constant, the cost of equity will be

Ke = EBIT – I/S

The NOI Approach can be illustrated with the help of the following diagram

Under this approach, the most significant assumption is that the Kw is constant irrespective of the degree of leverage. The segregation of debt and equity is not important here and the market capitalises the value of the firm as a whole.

Thus, an increase in the use of apparently cheaper debt funds is offset exactly by the corresponding increase in the equity- capitalisation rate. So, the weighted average Cost of Capital Kw and Kd remain unchanged for all degrees of leverage. Needless to mention here that, as the firm increases its degree of leverage, it becomes more risky proposition and investors are to make some sacrifice by having a low P/E ratio.

Traditional Approach:

While the above two approaches represent extreme views about the impact of financial leverage on value of firm and cost of capital, traditional approach offers an intermediate view which is a compromise between the NOI and NI approaches.

This approach resembles the NI approach when it argues that the value of the firm can be increased and cost of capital can be reduced by the judicious mix of debt and equity share capital but it does not subscribe to the view of NI approach that the value of the firm will increase and cost of capital will decrease for all the degrees of financial leverage.

Further, the traditional approach differs from the NOI approach because it does not hold the view that the overall cost of capital will remain constant whatever be the degree of financial leverage. Traditional theorists believe that up to certain point a firm can by increasing proportion of debt in its capital structure reduce cost of capital and raise market value of the stock.

Beyond the point further induction of debt will lead the cost of capital to rise and market value of the stock to fall. Thus, through a judicious mix of debt and equity a firm can minimise overall cost of capital to maximise value of stock. They opine that optimal point in capital structure is one where overall cost of capital begins to rise faster than the increase in earnings per share as a result of application of additional debt.

Traditional view regarding optimal capital structure can be appreciated by categorizing the market reaction to leverage in following three stages:

Stage I:

The first stage starts with introduction of debt in the firm’s capital structure. As a result of the use of low cost debt the firm’s net income tends to rise; cost of equity capital (Ke) rises with addition of debt but the rate of increase will be less than the increase in net earnings rate. Cost of debt (Ki,) remains constant or rises only modestly. Combined effect of all these will be reflected in increase in market value of the firm and decline in overall cost of capital (K0).

Stage II:

In the second stage further application of debt will raise costs of debt and equity capital so sharply as to offset the gains in net income. Hence the total market value of the firm would remain unchanged.

Stage III:

After a critical turning point any further dose of debt to capital structure will prove fatal. The costs of both debt and equity rise as a result of the increasing riskiness of each resulting in an increase in overall cost of capital which will be faster than the rise in earnings from the introduction of additional debt. As a consequence of this market value of the firm will tend to depress.

The overall effect of these stages suggests that the capital structure decision has relevance to valuation of firm and cost of capital. Up to favorably affects the value of a firm. Beyond that point value of the firm will be adversely affected by use of debt. 

The traditional view of optimal structure is set forth graphically in figure 14.3.

It may be noted from figure 14.3 that the cost of capital curve (Ke) is saucer shaped where an optimal range is extended over the range of leverage. But cost of capital curve need not always be saucer shaped. It is possible that stage 2 may not exist at all and instead of optimal range we may have optimal point in capital structure. This possibility is shown in figure 14.4.

Thus, cost of capital curve may be V shaped which yudecdes that applications of additional debt in capital structure beyond a point will result in an increase in total cost of capital and fall in market value of the firm. This is an optimal level of debt and equity mix which every firm must endeavour to attain.

Modigliani-Miller (M-M) Approach:

Modigliani-Miller’ (MM) advocated that the relationship between the cost of capital, capital structure and the valuation of the firm should be explained by NOI (Net Operating Income Approach) by making an attack on the Traditional Approach.

The Net Operating Income Approach, supplies proper justification for the irrelevance of the capital structure. In Income Approach, supplies proper justification for the irrelevance of the capital structure.

In this context, MM support the NOI approach on the principle that the cost of capital is not dependent on the degree of leverage irrespective of the debt-equity mix. In the words, according to their thesis, the total market value of the firm and the cost of capital are independent of the capital structure.

They advocated that the weighted average cost of capital does not make any change with a proportionate change in debt-equity mix in the total capital structure of the firm.

The same can be shown with the help of the following diagram

Proposition:

The following propositions outline the MM argument about the relationship between cost of capital, capital structure and the total value of the firm:

(i) The cost of capital and the total market value of the firm are independent of its capital structure. The cost of capital is equal to the capitalisation rate of equity stream of operating earnings for its class, and the market is determined by capitalising its expected return at an appropriate rate of discount for its risk class.

(ii) The second proposition includes that the expected yield on a share is equal to the appropriate capitalisation rate of a pure equity stream for that class, together with a premium for financial risk equal to the difference between the pure-equity capitalisation rate (Ke) and yield on debt (Kd). In short, increased Ke is offset exactly by the use of cheaper debt.

(iii) The cut-off point for investment is always the capitalisation rate which is completely independent and unaffected by the securities that are invested.

Assumptions:

The MM proposition is based on the following assumptions:

(a) Existence of Perfect Capital Market It includes:

(i) There is no transaction cost;

(ii) Flotation costs are neglected;

(iii) No investor can affect the market price of shares;

(iv) Information is available to all without cost;

(v) Investors are free to purchase and sale securities.

(b) Homogeneous Risk Class/Equivalent Risk Class:

It means that the expected yield/return have the identical risk factor i.e., business risk is equal among all firms having equivalent operational condition.

(c) Homogeneous Expectation:

All the investors should have identical estimate about the future rate of earnings of each firm.

(d) The Dividend pay-out Ratio is 100%:

It means that the firm must distribute all its earnings in the form of dividend among the shareholders/investors, and

(e) Taxes do not exist:

That is, there will be no corporate tax effect (although this was removed at a subsequent date).

Interpretation of MM Hypothesis:

The MM Hypothesis reveals that if more debt is included in the capital structure of a firm, the same will not increase its value as the benefits of cheaper debt capital are exactly set-off by the corresponding increase in the cost of equity, although debt capital is less expensive than the equity capital. So, according to MM, the total value of a firm is absolutely unaffected by the capital structure (debt-equity mix) when corporate tax is ignored.

Proof of MM Hypothesis: The Arbitrage Mechanism:

MM have suggested an arbitrage mechanism in order to prove their argument. They argued that if two firms differ only in two points viz. (i) the process of financing, and (ii) their total market value, the shareholders/investors will dispose-off share of the over-valued firm and will purchase the share of under-valued firms.

Naturally, this process will be going on till both attain the same market value. As such, as soon as the firms will reach the identical position, the average cost of capital and the value of the firm will be equal. So, total value of the firm (V) and Average Cost of Capital, (Kw) are independent.

EBIT-EPS analysis for Capital Structure Decision

EBIT-EPS Analysis is a financial tool used to determine the impact of different financing options (debt and equity) on a company’s Earnings Per Share (EPS) at various levels of Earnings Before Interest and Taxes (EBIT). It helps in capital structure decision-making, allowing firms to choose between debt financing (which increases financial leverage) and equity financing (which avoids fixed interest costs but dilutes ownership). The analysis involves computing EPS for different EBIT levels to identify the indifference point, where EPS remains the same regardless of financing choice. Companies aim to maximize EPS while managing financial risk and shareholder value.

Meaning of EBIT

Earnings Before Interest and Taxes (EBIT) refers to the operating profit of the firm.
It is the income earned from business operations before deducting interest on loans and income tax.

EBIT = OperatingRevenue – OperatingExpenses

It measures the earning capacity of the firm independent of financing decisions.

Meaning of EPS

Earnings Per Share (EPS) represents the earnings available to each equity shareholder.
It indicates the profitability of the company from the shareholders’ point of view.

EPS = Earnings available to equity shareholders / Number of equity shares

Higher EPS means higher return to shareholders and increased market value of shares.

Financial Leverage and EBIT–EPS

The analysis is closely related to financial leverage.

Financial leverage means the use of debt in capital structure to increase return to equity shareholders.

  • If EBIT is high → Debt financing increases EPS

  • If EBIT is low → Debt financing decreases EPS

Therefore, proper use of debt can increase shareholders’ wealth.

Advantages of EBIT-EPS Analysis

  • Helps in Selecting Optimum Capital Structure

EBIT–EPS analysis helps management compare different financing alternatives such as equity shares, preference shares and debt. By calculating earnings per share under each plan, the company can identify the most profitable financing option. The plan that provides higher EPS at a particular level of EBIT is selected. Thus, it guides the finance manager in designing an optimum capital structure that balances cost and return while improving the financial performance of the organization.

  • Maximizes Shareholders’ Earnings

The main objective of financial management is to maximize the wealth of equity shareholders. EBIT–EPS analysis directly focuses on earnings available to shareholders. It shows how different financing plans affect EPS and helps management select the alternative that produces higher earnings per share. By choosing the plan with the highest EPS, the firm increases returns to shareholders, enhances investor confidence and improves the market value of shares.

  • Measures the Effect of Financial Leverage

EBIT–EPS analysis clearly explains the effect of financial leverage on shareholders’ earnings. It shows how the use of borrowed funds can increase EPS when operating profits are high. At the same time, it also reveals the negative impact when profits decline. Therefore, it helps management understand both benefits and dangers of debt financing. This knowledge assists in maintaining a proper balance between risk and return while planning the capital structure.

  • Useful in Financial Planning

The analysis is very helpful in financial planning and forecasting. It enables the company to estimate the level of operating profit required to meet interest and dividend obligations. Management can predict future earnings and evaluate the financial viability of proposed financing plans. This makes planning more systematic and reduces uncertainty in financial decision-making. As a result, the company can arrange funds in advance and avoid financial difficulties.

  • Facilitates Comparison of Financing Alternatives

A company often has several alternatives for raising funds, such as issuing shares or taking loans. EBIT–EPS analysis provides a numerical comparison of these alternatives. It presents the impact of each option on EPS in a clear and measurable form. This makes decision-making logical and objective rather than based on assumptions. Hence, management can select the most beneficial financing source after evaluating all possible alternatives.

  • Identifies the Indifference Point

EBIT–EPS analysis helps determine the indifference point, which is the level of EBIT where EPS remains the same under two financing plans. This point guides management in understanding the level of operating income required for debt financing to become advantageous. Above this level, debt financing is preferable, while below it equity financing is safer. Therefore, the indifference point provides a clear basis for selecting suitable financial strategies.

  • Improves Decision-Making

The technique promotes scientific and rational financial decision-making. Instead of relying on guesswork, management uses calculated figures of EPS to choose financing sources. It provides a clear picture of expected returns and financial obligations. This reduces uncertainty and improves confidence in financial decisions. Consequently, the organization can adopt policies that are more effective, practical and aligned with long-term business goals.

  • Assists in Profit Planning

EBIT–EPS analysis also helps in profit planning. By analyzing different EBIT levels, the firm can set profit targets required to achieve desired EPS. Management can evaluate whether expected operating profits are sufficient to cover fixed financial charges. This enables better budgeting and performance evaluation. Therefore, the analysis acts as a useful tool for planning profitability and monitoring the financial performance of the business.

Limitations of EBIT-EPS Analysis

Although EBIT–EPS analysis is a useful technique for selecting an appropriate financing plan and capital structure, it is not free from defects. The analysis mainly concentrates on earnings per share and ignores several practical aspects of financial decision-making. Therefore, it should not be used as the only basis for financing decisions.

The major limitations of EBIT–EPS analysis are explained below:

  • Ignores Business Risk

EBIT–EPS analysis assumes that the operating income (EBIT) is known and stable. In reality, business earnings fluctuate due to changes in demand, competition, economic conditions and technology. If EBIT decreases unexpectedly, the company may not be able to meet interest obligations on debt. Hence, the analysis does not properly consider business risk, which is an important factor in financial planning.

  • Focuses Only on EPS

The technique gives importance only to earnings per share. However, maximizing EPS does not always mean maximizing shareholders’ wealth. Shareholders are also concerned with share price, dividends, safety of investment and future growth. A plan with higher EPS may involve higher risk and may reduce the market value of shares. Therefore, EPS alone is not a complete measure of financial performance.

  • Neglects Financial Risk

EBIT–EPS analysis encourages the use of debt because it often increases EPS at higher levels of EBIT. However, excessive debt increases financial risk and the possibility of insolvency. The company must pay interest regardless of profit. The analysis does not give adequate weight to the risk arising from heavy borrowing, which may endanger the long-term stability of the firm.

  • Assumes Constant Interest and Tax Rates

The analysis assumes that interest rates and tax rates remain constant. In actual business conditions, interest rates change due to market fluctuations and government policies. Similarly, tax rates may also vary. Changes in these rates directly affect EPS and the cost of capital. Hence, results of the analysis may become unrealistic or misleading.

  • Ignores Market Conditions

EBIT–EPS analysis does not consider the condition of the capital market. Sometimes it may not be possible to issue shares or debentures due to unfavorable market situations. Investor preferences, economic recession and stock market trends also affect financing decisions. Since these practical aspects are ignored, the analysis may not always be applicable in real situations.

  • No Consideration of Control

Issue of equity shares reduces the ownership control of existing shareholders. Many companies avoid issuing new shares to maintain management control. EBIT–EPS analysis does not consider this important aspect. It only compares EPS and ignores the effect of financing decisions on voting rights and managerial control.

  • Unrealistic Assumption of Fixed EBIT Levels

The technique compares financing plans at different EBIT levels, but predicting exact EBIT in advance is difficult. Business profits are uncertain and affected by several external factors. If the actual EBIT differs from estimated EBIT, the selected financing plan may not be suitable. Therefore, the analysis may lead to wrong decisions when profit estimates are inaccurate.

  • Does Not Consider Cash Flow Position

EBIT–EPS analysis is based on accounting profits rather than cash flows. However, interest and loan repayments require actual cash payments. A firm may show high EPS but may still face cash shortage. Ignoring liquidity position may create financial difficulties and even bankruptcy.

  • Short-Term Perspective

The analysis mainly focuses on immediate effect on EPS and does not consider long-term consequences such as growth opportunities, financial flexibility and sustainability. A financing plan beneficial in the short run may harm the company in the long run. Therefore, it provides only a partial view of financial decision-making.

Indifference Points:

The indifference point, often called as a breakeven point, is highly important in financial planning because, at EBIT amounts in excess of the EBIT indifference level, the more heavily levered financ­ing plan will generate a higher EPS. On the other hand, at EBIT amounts below the EBIT indifference points the financing plan involving less leverage will generate a higher EPS.

Indifference points refer to the EBIT level at which the EPS is same for two alternative financial plans. According to J. C. Van Home, ‘Indifference point refers to that EBIT level at which EPS remains the same irrespective of debt equity mix’. The management is indifferent in choosing any of the alternative financial plans at this level because all the financial plans are equally desirable. The indifference point is the cut-off level of EBIT below which financial leverage is disadvanta­geous. Beyond the indifference point level of EBIT the benefit of financial leverage with respect to EPS starts operating.

The indifference level of EBIT is significant because the financial planner may decide to take the debt advantage if the expected EBIT crosses this level. Beyond this level of EBIT the firm will be able to magnify the effect of increase in EBIT on the EPS.

In other words, financial leverage will be favorable beyond the indifference level of EBIT and will lead to an increase in the EPS. If the expected EBIT is less than the indifference point then the financial planners will opt for equity for financing projects, because below this level, EPS will be more for less levered firm.

  • Computation

We have seen that indifference point refers to the level of EBIT at which EPS is the same for two different financial plans. So the level of that EBIT can easily be computed. There are two approaches to calculate indifference point: Mathematical approach and graphical approach.

  • Graphical Approach

The indifference point may also be obtained using a graphical approach. In Figure 5.1 we have measured EBIT along the horizontal axis and EPS along the vertical axis. Suppose we have two financial plans before us: Financing by equity only and financing by equity and debt. Dif­ferent combinations of EBIT and EPS may be plotted against each plan. Under Plan-I the EPS will be zero when EBIT is nil so it will start from the origin.

The curve depicting Plan I in Figure 5.1 starts from the origin. For Plan-II EBIT will have some positive figure equal to the amount of interest to make EPS zero. So the curve depicting Plan-II in Figure 5.1 will start from the positive intercept of X axis. The two lines intersect at point E where the level of EBIT and EPS both are same under both the financial plans. Point E is the indifference point. The value corresponding to X axis is EBIT and the value corresponding to 7 axis is EPS.

These can be found drawing two perpendiculars from the indifference point—one on X axis and the other on Taxis. Similarly we can obtain the indifference point between any two financial plans having various financing options. The area above the indifference point is the debt advantage zone and the area below the indifference point is equity advantage zone.

Above the indifference point the Plan-II is profitable, i.e. financial leverage is advantageous. Below the indifference point Plan I is advantageous, i.e. financial leverage is not profitable. This can be found by observing Figure 5.1. Above the indifference point EPS will be higher for same level of EBIT for Plan II. Below the indifference point EPS will be higher for same level of EBIT for Plan I. The graphical approach of indifference point gives a better understanding of EBIT-EPS analysis.

Financial Breakeven Point

In general, the term Breakeven Point (BEP) refers to the point where the total cost line and sales line intersect. It indicates the level of production and sales where there is no profit and no loss because here the contribution just equals to the fixed costs. Similarly financial breakeven point is the level of EBIT at which after paying interest, tax and preference dividend, nothing remains for the equity shareholders.

In other words, financial breakeven point refers to that level of EBIT at which the firm can satisfy all fixed financial charges. EBIT less than this level will result in negative EPS. Therefore EPS is zero at this level of EBIT. Thus financial breakeven point refers to the level of EBIT at which financial profit is nil.

Financial Break Even Point (FBEP) is expressed as ratio with the following equation:

Cost of Debt, Functions, Theories, Applications, Challenges

Cost of debt represents the effective rate a firm pays on its borrowed funds, including loans, bonds, and debentures, reflecting the return required by lenders for providing capital. Unlike cost of equity, cost of debt is generally more straightforward to determine, as it is often based on the contractual interest rate specified in borrowing agreements, adjusted for any associated issuance costs or premiums. Since interest payments are typically tax-deductible, firms usually calculate the after-tax cost of debt to reflect the actual cost borne after accounting for tax benefits, making debt a relatively cheaper source of financing compared to equity. Cost of debt plays a crucial role in determining a firm’s overall weighted average cost of capital and influences capital structure decisions significantly.

Functions of Cost of Debt:

1. Determinant of Weighted Average Cost of Capital

Cost of debt serves as a critical input in calculating a firm’s Weighted Average Cost of Capital, as it represents one of the primary components of the overall capital structure alongside cost of equity. Since debt is generally cheaper than equity due to its tax-deductible interest payments and lower risk to lenders, the proportion and cost of debt significantly influence the blended overall cost of capital used for investment appraisal. An accurate estimation of cost of debt ensures that the WACC reflects the true cost of financing, enabling firms to make sound decisions regarding project acceptance, rejection, and overall capital budgeting processes.

2. Basis for Capital Structure Decisions

Cost of debt plays a central role in guiding a firm’s capital structure decisions, as management compares the relative costs of debt and equity financing to determine the optimal mix that minimizes the overall cost of capital while balancing financial risk. A lower cost of debt, especially after accounting for tax shields, often makes borrowing an attractive financing option compared to equity, which carries no tax deductibility on returns paid to shareholders. However, firms must weigh this cost advantage against the increased financial risk and potential distress costs associated with higher leverage, making cost of debt a key factor in structuring the firm’s financing decisions.

3. Tool for Evaluating Financing Alternatives

Cost of debt enables firms to systematically compare different borrowing options, such as bank loans, debentures, bonds, or commercial paper, each carrying different interest rates, terms, and associated costs. By calculating and comparing the effective cost of each financing alternative, management can select the most cost-efficient source of debt capital for a given financing need. This function is particularly important when firms have access to multiple funding sources with varying risk profiles, maturities, and covenants, as understanding the true cost of each option allows for more informed and financially sound borrowing decisions across different market conditions.

4. Influences Investment Appraisal and Project Selection

Cost of debt directly affects the discount rate used in evaluating projects financed partly or wholly through borrowed funds, influencing key investment appraisal metrics such as net present value and internal rate of return. Since debt-financed projects must generate returns sufficient to cover the cost of servicing that debt, an accurate cost of debt calculation ensures that project evaluation reflects the true financial burden of the chosen financing method. This function helps firms avoid accepting projects that fail to generate adequate returns to justify the cost of the debt capital used to fund them, protecting long-term financial stability.

5. Reflects Firm’s Credit Risk and Market Perception

The cost of debt a firm faces serves as an indicator of how lenders and credit markets perceive its overall creditworthiness and financial risk, with higher costs signaling greater perceived risk of default. Firms with strong credit ratings and stable cash flows typically secure debt at lower interest rates, while those with weaker financial positions face higher borrowing costs. This function makes cost of debt a useful external signal, allowing management, investors, and analysts to gauge market confidence in the firm’s financial health and stability based on the terms at which the firm is able to raise debt capital.

Theories of Cost of Debt:

1. Yield to Maturity Theory

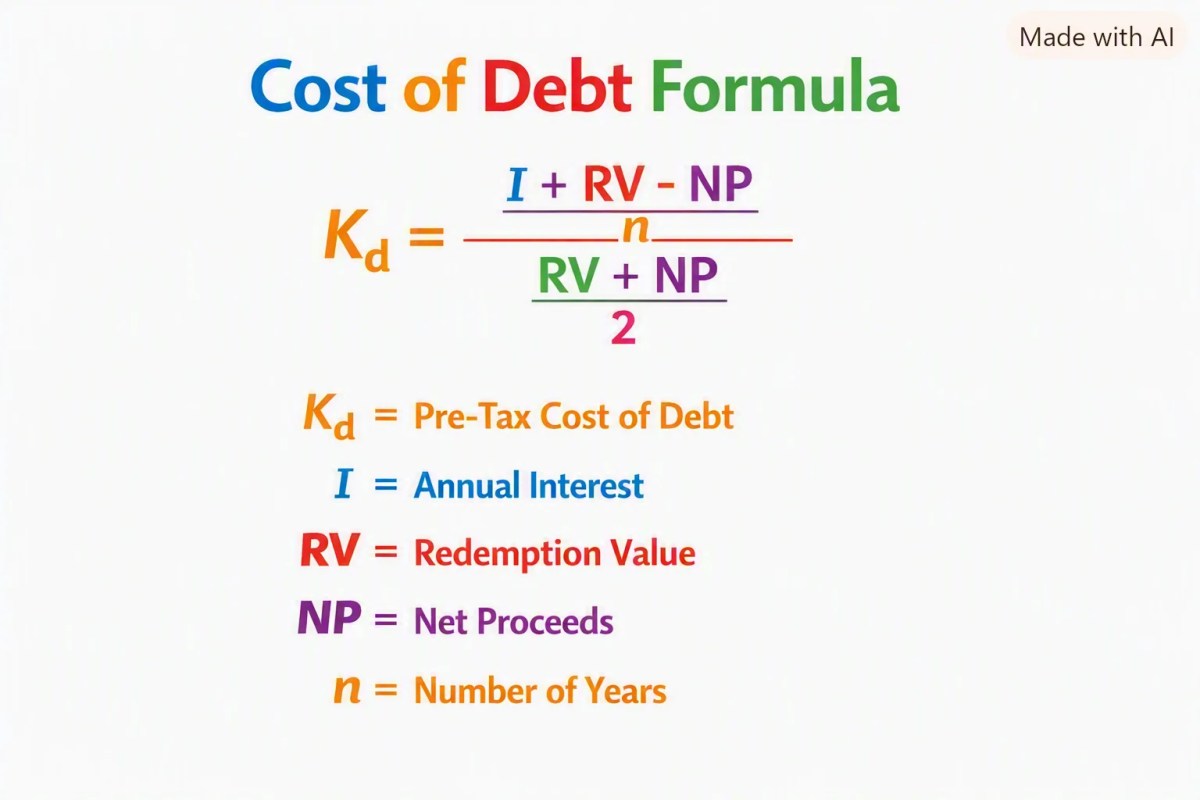
The Yield to Maturity approach estimates the cost of debt by considering the return required by lenders on a debt instrument until its maturity. It considers the current market price of the debt, annual interest payments, redemption value and remaining maturity period. This approach provides a market based estimate of the borrowing cost, particularly for market traded bonds and debentures. When the debt is issued at a discount or premium, the effective cost may differ from the stated interest rate. Therefore, Yield to Maturity provides a comprehensive measure of the actual pre tax cost of debt.

2. Net Proceeds Approach

The Net Proceeds Approach calculates the cost of debt by comparing the annual interest and repayment obligations with the actual amount of funds received by the company. It is particularly useful when debt is issued at a discount or when flotation and issue expenses are involved. The approach provides an effective borrowing cost rather than simply considering the stated interest rate. If issue expenses or discounts reduce the amount received, the effective cost of borrowing increases. Therefore, this approach helps management evaluate the actual cost associated with raising debt finance.

3. Present Value Approach

The Present Value Approach determines the cost of debt by finding the discount rate that equates the present value of future debt cash outflows with the net proceeds received by the company. Future interest payments and redemption amounts are discounted at the rate representing the effective cost of debt. This approach is more accurate because it considers the timing and amount of all relevant cash flows. It is especially useful when debt has different payment patterns or when the simple approximation method may not provide a sufficiently accurate estimate.

4. After Tax Cost of Debt Theory

The After Tax Cost of Debt approach recognises that interest expense on debt may provide a tax benefit to the company, subject to applicable tax rules. Since interest is generally deductible for corporate tax purposes under applicable conditions, the effective cost of debt after tax is lower than its pre tax cost. This makes debt financing relatively attractive compared with equity in many situations. However, the actual tax benefit depends on the company’s taxable income and applicable tax provisions. Therefore, after tax cost of debt is widely used in calculating the company’s overall cost of capital.

5. Cost of Irredeemable Debt Theory

For irredeemable or perpetual debt, the company does not have a fixed redemption date. Therefore, the cost of debt is calculated by relating the annual interest payment to the current market price or net proceeds of the debt. Since the principal is not repaid during the life of the instrument, the interest payments continue indefinitely. This method is relatively simple and is suitable for perpetual debentures and similar instruments. The after tax cost can also be calculated when the tax effect of interest is considered.

6. Cost of Redeemable Debt Theory

The Cost of Redeemable Debt approach considers both periodic interest payments and the amount payable when the debt is redeemed. Unlike irredeemable debt, redeemable debt has a specified maturity date. The effective cost therefore depends on the interest payments, redemption value, issue price or net proceeds and maturity period. This approach provides a more realistic estimate of borrowing cost because it considers the complete cash flow pattern of the debt instrument. It is commonly applied to redeemable debentures, bonds and other fixed maturity debt instruments.

Applications of Cost of Debt:

1. Capital Structure Decisions

Cost of debt is an important factor in determining the appropriate mix of debt and equity in a company’s capital structure. Management compares the cost of debt with the cost of equity to identify a suitable financing combination. Debt may be attractive because interest expenses can provide a tax benefit, subject to applicable tax rules. However, excessive borrowing increases financial risk and repayment obligations. Therefore, cost of debt helps management evaluate the benefits and risks of debt financing and select a capital structure that balances financing cost, financial risk and shareholder interests.

2. Capital Budgeting

Cost of debt is used in capital budgeting to assess the financing cost associated with investment projects. When a project is financed through debt, management needs to consider the cost of borrowing while evaluating the project’s expected returns and cash flows. The after tax cost of debt may also be considered where applicable. Cost of debt can form part of the discount rate through the Weighted Average Cost of Capital. Therefore, it helps determine whether the expected returns from an investment are sufficient to cover the cost of funds used for financing the project.

3. Calculation of WACC

Cost of debt is an essential component of the Weighted Average Cost of Capital. WACC combines the costs of different sources of finance according to their proportion in the company’s capital structure. The after tax cost of debt is generally used when interest provides a tax benefit. Accurate estimation of debt cost is therefore necessary for calculating WACC correctly. WACC is widely used in investment appraisal and business valuation. Hence, cost of debt directly affects the company’s overall financing cost and influences investment and valuation decisions.

4. Debt Financing Decisions

Cost of debt helps management evaluate whether borrowing is an appropriate source of finance for a particular financial requirement. Before obtaining a loan or issuing bonds, the company can estimate the interest cost, issue expenses and other borrowing charges. Management can then compare the effective cost with alternative sources such as equity and retained earnings. This helps identify the most economical financing option while considering risk and repayment capacity. Therefore, cost of debt provides an important basis for selecting suitable debt instruments and financing arrangements.

5. Company Valuation

Cost of debt is used in company valuation because it contributes to the calculation of the overall discount rate, particularly through WACC. Future operating cash flows of a business may be discounted using WACC to determine their present value. Since debt is one component of the financing structure, its cost affects the overall discount rate. A higher cost of debt may increase WACC and reduce the estimated value of future cash flows. Therefore, accurate estimation of cost of debt is important for business valuation and investment analysis.

6. Loan and Bond Evaluation

Cost of debt helps companies evaluate different loan and bond financing options. Borrowing arrangements may differ in terms of interest rates, maturity periods, issue prices, processing charges and other costs. Management can calculate the effective cost of each alternative rather than comparing only the stated interest rates. This allows the company to identify the financing option that provides funds at a suitable overall cost. Therefore, cost of debt is useful when selecting between different debt instruments and negotiating borrowing arrangements with financial institutions and investors.

7. Financial Risk Management

Cost of debt is relevant to financial risk management because borrowing creates fixed financial obligations such as interest and principal repayment. A company with a high cost of debt may face greater pressure on cash flows, especially when operating performance declines. Management can therefore use cost of debt to evaluate the affordability and risk associated with additional borrowing. Monitoring borrowing costs also helps the company assess whether refinancing or restructuring existing debt may be beneficial. Thus, cost of debt supports decisions aimed at controlling financial risk and maintaining adequate debt servicing capacity.

8. Refinancing Decisions

Cost of debt is useful when a company considers replacing existing debt with new borrowing. Management can compare the cost of existing debt with the cost of new financing after considering interest rates, transaction costs, penalties and other charges. If new debt can reduce the effective financing cost without creating excessive risk, refinancing may improve financial efficiency. However, the complete cash flow impact must be considered before making the decision. Therefore, cost of debt provides an important benchmark for evaluating refinancing opportunities and managing the company’s long term borrowing costs.

9. Dividend and Retention Decisions

Cost of debt can indirectly influence dividend and retained earnings decisions. If borrowing is relatively expensive, management may prefer to use internal funds rather than take additional debt, provided sufficient funds are available. Conversely, when borrowing costs are favourable and the company has profitable investment opportunities, debt may be considered as an additional financing source. Management must also consider the effect of borrowing on financial risk and future cash flows. Therefore, cost of debt helps determine whether internal funds, debt or a combination of financing sources should be used to meet investment requirements.

10. Investment and Financing Planning

Cost of debt supports long term financial planning by helping management estimate future borrowing costs and financing requirements. Companies can use the estimated cost of debt while preparing financial projections, investment plans and capital expenditure budgets. It helps determine the likely cost of financing expansion, acquisition, replacement of assets and other major investments. By considering expected interest rates, tax effects and repayment obligations, management can develop a more realistic financing plan. Therefore, cost of debt is an important input in coordinating investment decisions with the company’s overall financing strategy.

Challenges of Cost of Debt:

1. Fluctuation in Interest Rates

One major challenge in determining the cost of debt is the fluctuation in market interest rates. Companies with variable rate loans may experience changes in interest payments when market rates increase or decrease. Even fixed rate debt may become relatively expensive if market interest rates fall after borrowing. Changes in interest rates therefore affect the actual financing cost and future cash flows of the company. Management must monitor interest rate movements and consider refinancing, hedging or suitable debt structures where appropriate. Hence, changing interest rates make accurate long term estimation of cost of debt difficult.

2. Difficulty in Estimating Effective Cost

The stated interest rate does not always represent the actual cost of debt. Companies may incur processing fees, issue expenses, underwriting charges, discounts, premiums and other borrowing costs. These additional amounts affect the net proceeds received and therefore change the effective cost of borrowing. Calculating the true cost requires consideration of all relevant cash flows throughout the debt’s life. This can become complicated when repayment schedules or interest payments vary. Therefore, management must carefully analyse the complete terms of a debt instrument rather than relying only on its stated interest rate.

3. Tax Rate Changes

The after tax cost of debt depends partly on the applicable tax rate and the tax treatment of interest expenses. Changes in tax laws, tax rates or restrictions on interest deductions can alter the effective cost of borrowing. A company may initially estimate a particular tax benefit, but changes in regulations may reduce or modify that benefit. Differences in the company’s taxable income can also affect the actual usefulness of tax deductions. Therefore, uncertainty regarding future taxation creates challenges when estimating the long term after tax cost of debt.

4. Credit Rating Changes

A company’s credit rating can significantly affect its borrowing cost. Companies with strong credit ratings are generally able to borrow at relatively favourable rates because lenders perceive lower default risk. If the company’s financial position deteriorates, its credit rating may decline and lenders may demand a higher interest rate. This can increase the cost of new borrowing and refinancing. Therefore, changes in creditworthiness create uncertainty in estimating future debt costs. Management must monitor financial performance, debt levels and repayment capacity to maintain a favourable credit position.

5. Debt Maturity Period

The maturity period of debt creates challenges in estimating its cost because longer maturity generally involves greater uncertainty about future interest rates and economic conditions. Long term debt may also carry different interest rates compared with short term borrowing. For redeemable debt, the calculation must consider interest payments, issue price, redemption value and the period until maturity. Changes in market conditions during this period can affect refinancing requirements. Therefore, management must carefully consider maturity structure when estimating and managing the company’s overall cost of debt.

6. Market Conditions

Overall financial market conditions influence the cost at which companies can obtain debt. Economic growth, inflation, monetary policy, liquidity conditions and investor sentiment can affect interest rates and credit spreads. During periods of economic uncertainty or tight liquidity, lenders may demand higher returns for providing funds. Conversely, favourable market conditions may allow companies to borrow at lower rates. Since market conditions can change unexpectedly, estimating future borrowing costs can be difficult. Therefore, management must consider both current market conditions and possible future changes while planning debt financing.

7. Credit Risk

Credit risk represents the possibility that a borrower may fail to meet its interest or principal repayment obligations. Lenders consider the financial strength, profitability, cash flow position and existing debt of the company when determining the interest rate. Companies perceived as having higher default risk may have to pay higher interest rates, increasing their cost of debt. Changes in business performance can also affect perceived credit risk over time. Therefore, accurately estimating cost of debt requires careful assessment of the company’s creditworthiness and ability to service its financial obligations.

8. Complex Debt Instruments

Modern companies may use various debt instruments with different interest structures, conversion features, repayment terms and embedded options. Bonds, convertible debentures, floating rate loans and other instruments may require different methods for calculating their effective cost. The presence of discounts, premiums, transaction costs and special repayment conditions can make calculations more complicated. Management must carefully identify all relevant cash flows before estimating the cost of such instruments. Therefore, the complexity of debt contracts can make accurate measurement and comparison of borrowing costs difficult.

9. Refinancing Risk

Refinancing risk arises when a company needs to replace existing debt with new borrowing after maturity. The future cost of refinancing may be higher than the original borrowing cost because market interest rates, credit conditions or the company’s financial position may have changed. This creates uncertainty regarding future financing expenses. A company may also face difficulty obtaining new funds during adverse market conditions. Therefore, management should consider refinancing requirements when evaluating the cost of long term debt and avoid relying solely on the current borrowing rate.

10. Excessive Dependence on Debt

Excessive dependence on debt can increase financial risk and indirectly raise the company’s cost of borrowing. As debt levels increase, lenders may perceive greater risk of financial distress and demand higher interest rates. Higher debt also creates larger fixed payment obligations, which can place pressure on cash flows during periods of weak profitability. Although debt may provide tax benefits, excessive borrowing can reduce financial flexibility. Therefore, management must balance the potential advantages of debt financing with its effect on credit risk, repayment capacity and the overall cost of capital.

Cost of Preference Shares

Cost of Preference Share Capital: An amount paid by company as dividend to preference shareholder is known as Cost of Preference Share Capital.

Preference share is a small unit of a company’s capital which bears fixed rate of dividend and holder of it gets dividend when company earn profit. Dividend payable is not a tax deductible amount. So, there is no tax adjustments required for comparing with cost of debt.

Formula for Cost of Preference Share:

Irredeemable Preference Share

Redeemable Preference Share

Kp = Dp/NP

Kp = Dp+((RV-NP)/n )/ (RV+NP)/2

Where,

Kp = Cost of Preference Share

Dp = Dividend on preference share

NP = Net proceeds from issue of preference share

(Issue price – Flotation cost)

RV = Redemption Value

N = Period of preference share

Example: A preference share issues at 12% worth Rs 60,000 at 5% discount and after 6 years it redeem at 10% premium. The flotation cost is 5% and tax rate is 20%. Find out the cost of preference share capital.

Solution:

Dividend on preference share (Dp) = 60,000*12/100 = Rs.7200

Discount = 60,000*5/100 = Rs.3000

Flotation Cost = 60,000*5/100 = Rs.3000

Net Proceeds (NP) = Rs. (60,000-3000-3000) = Rs. 54,000

Premium amount = 60,000*10/100 =Rs. 6000

Redemption Value = Rs. (60,000+6000) = Rs. 66,000

Kp = Dp+ ((RV-NP)/n)/ (RV+NP)/2

= 7200+ ((66,000-54,000)/6) / (66,000+54,000)/2

= 9200/60,000

= 15.33%

Cost of Equity, Importance, Theories, Significance, Factors Affecting, Applications

Cost of equity represents the return that shareholders require on their investment in a company, compensating them for the risk of holding equity capital, which carries no guaranteed returns unlike debt instruments. It reflects the opportunity cost of investing in a particular firm’s shares rather than alternative investments of comparable risk. Cost of equity is a critical component in determining a firm’s overall cost of capital and is widely used in investment appraisal, valuation, and capital structure decisions. It is commonly estimated using models such as the Capital Asset Pricing Model or the Dividend Discount Model, both of which incorporate risk and expected return considerations to arrive at an appropriate required rate.

Importance of Cost of Equity:

1. Investment Decision Making

Cost of equity is important in evaluating investment projects because it represents the return expected by equity shareholders for the risk they bear. It can be used as a benchmark for determining whether a proposed investment is likely to generate sufficient returns. If the expected return from a project is higher than the cost of equity, the investment may be financially attractive. Therefore, cost of equity helps management assess investment opportunities and make appropriate capital budgeting decisions while considering shareholders’ required return.

2. Capital Structure Decisions

Cost of equity plays an important role in determining the appropriate mix of equity and debt financing. Equity does not require fixed interest payments, but shareholders expect a return for providing capital and bearing business risk. Management compares the cost of equity with the cost of debt when deciding the financing structure of the company. A suitable combination can help control the overall cost of capital and improve financial efficiency. Therefore, cost of equity is an important factor in making long term capital structure decisions.

3. Calculation of WACC

Cost of equity is an essential component of the Weighted Average Cost of Capital (WACC). WACC represents the overall required return of a company based on the costs of different sources of finance, including equity and debt. Since equity may form a significant part of the company’s financing, an accurate estimate of its cost is necessary for calculating WACC correctly. WACC is widely used for investment appraisal and valuation. Therefore, cost of equity directly influences the company’s overall cost of capital and financial decision making.

Formula:

WACC = (E/V × Ke) + (D/V × Kd × (1 − T))

Where Ke = Cost of Equity.

4. Company Valuation

Cost of equity is important in determining the value of a company because it represents the required return of equity investors. It is commonly used as a discount rate for valuing future equity cash flows, particularly in equity valuation models. A higher cost of equity results in a higher discount rate and generally lowers the present value of expected future cash flows. Conversely, a lower cost of equity can increase the estimated value. Therefore, accurate estimation of cost of equity is essential for assessing the fair value of shares and businesses.

5. Shareholder Return Expectations

Cost of equity reflects the return that shareholders expect from investing in a company’s shares. Investors provide capital with the expectation of receiving adequate compensation for the time value of money and the risks associated with the investment. Management needs to understand these expectations when making financial decisions. If the company consistently earns returns below its cost of equity, shareholders may consider the investment unattractive. Therefore, cost of equity serves as an important benchmark for evaluating whether the company is generating sufficient returns for its equity investors.

6. Performance Evaluation

Cost of equity can be used as a benchmark for evaluating the financial performance of a company. Management can compare the return generated by the business with the return required by equity shareholders. If the return on equity exceeds the cost of equity, the company may be creating value for shareholders. If it remains below the cost of equity, shareholder value may be reduced. Therefore, cost of equity helps management assess whether the company’s resources are being used effectively and whether business operations are generating adequate returns for investors.

7. Dividend Policy Decisions

Cost of equity is relevant when management makes dividend policy decisions. Shareholders expect an appropriate return from their investment through dividends and capital appreciation. When deciding whether to distribute profits as dividends or retain them for future investment, management should consider the return that retained earnings can generate compared with the cost of equity. If retained earnings can earn returns above the cost of equity, retaining profits may create value. Therefore, cost of equity provides a useful benchmark for making decisions regarding dividend distribution and retained earnings.

8. Risk Assessment

Cost of equity incorporates the level of risk associated with investing in a company’s shares. Companies with higher business or financial risk generally require higher returns to compensate equity investors. Models such as the Capital Asset Pricing Model consider systematic risk through beta while estimating the required return. Therefore, changes in business risk, market conditions and investor expectations can influence the cost of equity. Management can use this information to understand how risk affects financing costs and investment decisions. Thus, cost of equity is an important indicator of the risk perceived by equity investors.

9. Financing Decisions

Cost of equity is important when a company considers raising funds through issuing new equity shares. Before obtaining equity finance, management needs to determine the return expected by potential investors. If the cost of equity is high, raising equity may become relatively expensive compared with other financing sources. Management can therefore compare equity financing with debt, retained earnings and other alternatives. This comparison helps the company select a suitable source of funds. Hence, cost of equity supports financing decisions by showing the economic cost of using shareholders’ capital.

Theories of Cost of Equity:

1. Dividend Growth Model Theory

The Dividend Growth Model states that the cost of equity is based on the expected dividend yield and the expected growth rate of dividends. It assumes that investors value shares according to the present value of future dividends. The model is particularly useful for companies that pay regular dividends and have a reasonably stable growth rate. A higher expected dividend growth rate generally reduces the required cost of equity, while a higher current market price reduces the dividend yield. Therefore, the model provides a simple approach to estimating shareholders’ required return.

Formula:

Ke = (D₁ ÷ P₀) + g

Where:

Ke = Cost of Equity
D₁ = Expected dividend per share
P₀ = Current market price per share
g = Expected dividend growth rate

2. Capital Asset Pricing Model Theory

The Capital Asset Pricing Model (CAPM) explains the cost of equity in relation to the risk free rate and the systematic risk of a company’s shares. It assumes that investors require compensation for the time value of money and the risk that cannot be eliminated through diversification. Beta measures the sensitivity of the company’s share returns to market movements. A higher beta indicates greater systematic risk and generally results in a higher required return. CAPM is widely used in financial management for estimating the cost of equity and evaluating investment projects.

Formula:

Ke = Rf + β(Rm − Rf)

Where:

Rf = Risk free rate
β = Beta of the share
Rm = Expected market return

3. Earnings Price Ratio Theory

The Earnings Price Ratio approach estimates the cost of equity by relating the company’s expected earnings per share to the current market price per share. It assumes that investors’ required return is reflected in the relationship between earnings generated by the company and the price they pay for its shares. This method is relatively simple and may be useful when dividend information is unavailable or dividends do not reflect the company’s earning capacity. However, it does not explicitly consider future dividend growth or systematic risk. Therefore, it is mainly used as a simple earnings based approach.

Formula:

Ke = E₁ ÷ P₀

Where:

E₁ = Expected Earnings per Share
P₀ = Current Market Price per Share

4. Bond Yield Plus Risk Premium Theory

The Bond Yield Plus Risk Premium approach estimates the cost of equity by adding an equity risk premium to the company’s existing or estimated cost of debt. Equity investors generally require a higher return than lenders because equity shareholders bear greater risk and do not have a fixed contractual return. The additional premium compensates shareholders for this higher risk. This method can be useful when a company’s beta or reliable market data is unavailable. However, the appropriate equity risk premium involves managerial judgement and may differ between companies and market conditions.

Formula:

Ke = Kd + Equity Risk Premium

Where:

Kd = Cost of Debt

Equity Risk Premium = Additional return required by equity shareholders

5. Realised Return Approach

The Realised Return Approach estimates the cost of equity by analysing the historical returns earned by shareholders on the company’s shares. Past returns may include dividend income and changes in the market price of the shares. The average historical return is used as an indication of the return investors may require in the future. This approach is relatively simple when sufficient historical market data is available. However, past performance may not accurately represent future returns because business conditions, market risk and investor expectations can change. Therefore, historical returns should be used carefully when estimating cost of equity.

Formula:

Historical Return = [(P₁ − P₀) + D] ÷ P₀

Where:

P₀ = Beginning share price
P₁ = Ending share price
D = Dividend per share

6. Arbitrage Pricing Theory

Arbitrage Pricing Theory (APT) explains the cost of equity through exposure to multiple systematic risk factors rather than relying on a single market risk factor. These factors may include inflation, interest rates, economic growth and other relevant market influences. Each factor has a corresponding risk premium, and the required return is determined by combining the risk free rate with the premiums associated with the company’s exposure to these factors. APT provides greater flexibility than CAPM because it can consider several sources of systematic risk. However, identifying relevant factors and estimating their risk premiums can be difficult.

Formula:

Ke = Rf + β₁RP₁ + β₂RP₂ + … + βₙRPₙ

Where:

Rf = Risk free rate
βₙ = Sensitivity to risk factor
RPₙ = Risk premium for that factor

Significance of Cost of Equity in Capital Structure Decisions:

1. Determines Financing Cost

Cost of equity represents the return expected by equity shareholders for providing capital to the company. It is therefore an important component of the overall cost of financing. Management compares the cost of equity with the cost of debt and other sources of finance when selecting an appropriate capital structure. A lower cost of equity can make equity financing relatively attractive, while a higher cost may encourage consideration of alternative sources. Thus, understanding the cost of equity helps management evaluate the financial cost of different financing choices and develop a suitable capital structure.

2. Helps Determine Optimal Capital Structure

Cost of equity plays an important role in determining the optimal combination of debt and equity. The objective is generally to select a financing mix that minimises the overall cost of capital while maintaining an acceptable level of financial risk. As debt increases, financial leverage may initially reduce the overall cost of capital, but excessive debt can increase financial risk and consequently raise the cost of equity. Therefore, management must consider the effect of financing decisions on both debt costs and equity shareholders’ required returns while determining an appropriate capital structure.

3. Influences WACC

Cost of equity is a major component of the Weighted Average Cost of Capital. Any change in the cost of equity can affect the company’s overall cost of capital, depending on the proportion of equity in the capital structure. A lower WACC generally increases the present value of future cash flows and may make investment projects more attractive. Conversely, a higher WACC can reduce project values. Therefore, management must carefully estimate the cost of equity when evaluating changes in the financing mix and their effect on the company’s overall cost of capital.

4. Helps Compare Debt and Equity

Cost of equity enables management to compare the cost of raising funds through equity with the cost of borrowing through debt. Debt generally involves contractual interest payments, while equity investors expect returns through dividends and capital appreciation. Although debt may appear cheaper because interest can provide a tax benefit, excessive borrowing increases financial risk and may raise the cost of equity. Therefore, comparing these financing costs helps management balance the benefits and risks of different sources of capital and select an appropriate combination of debt and equity.

5. Controls Financial Risk

Cost of equity is closely related to the level of financial risk associated with a company’s capital structure. When a company increases debt, fixed interest and repayment obligations increase its financial risk. Equity shareholders may then demand a higher return to compensate for the additional risk, causing the cost of equity to rise. Therefore, management should consider how changes in debt levels affect shareholders’ required returns. Maintaining a suitable balance between debt and equity can help control financial risk while allowing the company to obtain the benefits of financial leverage.

6. Supports Financing Decisions

Cost of equity provides an important benchmark when management decides how to raise additional funds. A company may consider issuing equity shares, retaining earnings or obtaining debt. The expected return required by equity investors must be considered when evaluating these alternatives. If the cost of equity is relatively high, management may examine whether debt or retained earnings provide a more suitable source of finance, subject to risk and other factors. Therefore, cost of equity helps management make informed financing decisions and select sources that support the company’s long term financial objectives.

7. Affects Shareholder Value

Cost of equity influences shareholder value because investors expect the company to generate returns that compensate them for the risk of ownership. If the company earns a return greater than its cost of equity, it may create value for shareholders. If returns remain below the cost of equity, shareholder value may decline. Capital structure decisions can influence this relationship by changing financial risk and the company’s overall cost of capital. Therefore, management should consider cost of equity when selecting a financing mix that aims to support sustainable profitability and shareholder wealth creation.

8. Guides Use of Retained Earnings

Cost of equity is also relevant when deciding whether to retain profits or distribute them as dividends. Retained earnings represent an internal source of equity finance, but they still have an opportunity cost because shareholders could have received the profits as dividends and invested them elsewhere. Management should therefore compare the expected return from reinvesting retained earnings with the cost of equity. If reinvested funds can generate returns above the cost of equity, retention may be justified. Thus, cost of equity helps guide decisions regarding retained earnings and internal financing.

9. Supports Capital Structure Stability

A proper understanding of cost of equity helps management maintain a stable capital structure over time. Changes in debt levels, business risk, market conditions and investor expectations can influence shareholders’ required return. Excessive dependence on either debt or equity may create financial or ownership related concerns. By monitoring the cost of equity along with other financing costs, management can assess whether the existing financing mix remains appropriate. Therefore, cost of equity provides useful information for maintaining a balanced and sustainable capital structure consistent with the company’s long term financial needs.

Factors Affecting Cost of Equity Shares:

1. Business Risk

Business risk refers to the uncertainty associated with a company’s operating performance and profits. Companies operating in unstable industries or facing uncertain demand generally have higher business risk. Equity shareholders bear this risk because their returns depend on the company’s profitability and market performance. When business risk increases, investors usually demand a higher return as compensation. Consequently, the cost of equity rises. Conversely, companies with stable demand, predictable revenues and consistent operating performance may have lower business risk and therefore a lower cost of equity. Thus, business risk is an important determinant of shareholders’ required return.

2. Financial Risk

Financial risk arises from the use of debt and other fixed financial obligations in a company’s capital structure. Higher debt increases interest and repayment commitments, which can make equity returns more uncertain. Since equity shareholders bear the residual risk after meeting fixed obligations, they may demand higher returns when financial leverage increases. Therefore, excessive use of debt can increase the cost of equity. A company with moderate financial leverage and manageable debt obligations may have comparatively lower financial risk and cost of equity. Hence, capital structure decisions directly influence shareholders’ required return.

3. Market Risk

Market risk refers to the risk arising from movements in the overall financial market. Factors such as economic conditions, interest rates, inflation, investor sentiment and market fluctuations can affect share prices and returns. Equity investors require compensation for bearing systematic risk that cannot be eliminated through diversification. Companies whose shares are more sensitive to market movements generally have higher required returns. The level of market risk is often reflected through beta in the Capital Asset Pricing Model. Therefore, changes in market conditions and systematic risk can significantly influence the cost of equity shares.

4. Interest Rate

Interest rates influence the cost of equity because changes in market interest rates affect investors’ required returns and investment choices. When interest rates increase, relatively safer investments may offer higher returns, causing investors to demand higher returns from equity investments as compensation for their additional risk. This can increase the company’s cost of equity. Conversely, lower interest rates may reduce the required return on equity, depending on market conditions. Interest rates also influence borrowing costs and economic activity. Therefore, changes in prevailing interest rates can affect both investor expectations and the cost of equity.

5. Expected Dividend

Expected dividends influence the cost of equity because shareholders consider dividend income when deciding the return required from their investment. If investors expect higher future dividends, the required return may be influenced by the relationship between expected dividends and the current market price of shares. Under the Dividend Growth Model, expected dividend per share is an important component of the cost of equity. Stable and predictable dividend payments may also improve investor confidence. Therefore, dividend expectations, dividend policy and expected dividend growth can significantly affect the return required by equity shareholders.

6. Dividend Growth Rate

The expected growth rate of dividends is an important factor affecting the cost of equity, particularly under the Dividend Growth Model. When investors expect dividends to grow consistently, the required return is influenced by this expected growth. According to the model, a higher expected dividend growth rate generally increases the estimated cost of equity when other factors remain unchanged. Growth expectations depend on profitability, retained earnings, investment opportunities and business prospects. Therefore, changes in expected dividend growth can influence shareholders’ return requirements and consequently affect the company’s cost of equity.

7. Market Price of Shares

The current market price of equity shares affects the cost of equity, especially when dividend based valuation methods are used. Under the Dividend Growth Model, the expected dividend is compared with the current market price to estimate the dividend yield. A higher market price, with other factors unchanged, generally reduces the dividend yield and may reduce the estimated cost of equity. A lower market price can have the opposite effect. Therefore, changes in the market valuation of a company’s shares can influence the estimated return required by equity investors.

8. Company Size

Company size can influence the cost of equity because larger and well established companies may have more stable operations, diversified activities and better access to financial markets. These characteristics can reduce certain business uncertainties and increase investor confidence. Smaller companies may face greater uncertainty due to limited resources, narrower markets or greater dependence on a few products or customers. Investors may therefore demand higher returns from smaller or less established companies. However, company size alone does not determine the cost of equity. It should be considered together with business, financial and market risks.

9. Economic Conditions

Overall economic conditions significantly influence the cost of equity. Factors such as economic growth, inflation, employment, consumer demand and industrial activity affect corporate profitability and investor expectations. During periods of strong economic growth, companies may experience better sales and earnings prospects, potentially reducing perceived business risk. During economic slowdowns or recessions, uncertainty may increase and investors may demand higher returns. Therefore, changes in the economic environment can influence both expected returns and market risk. Companies must consider prevailing economic conditions when assessing their cost of equity and financing decisions.

10. Tax Policy

Changes in tax policy can indirectly affect the cost of equity by influencing company profitability, investor returns and capital structure. Higher corporate taxes may reduce the profits available to shareholders, while changes in taxes on dividends or capital gains may affect investors’ after tax returns. Tax rules also influence the relative attractiveness of debt because interest expenses may receive tax treatment that differs from equity distributions. As financing decisions affect financial risk, they can also influence the cost of equity. Therefore, changes in taxation can have an important indirect effect on shareholders’ required return.

Applications of Cost of Equity in Investment and Valuation Decisions:

1. Capital Budgeting

Cost of equity is used as a benchmark for evaluating investment projects that are financed partly or wholly through equity. It represents the minimum return expected by equity shareholders for the risk undertaken. Management can compare the expected return from a project with the cost of equity. If the expected return exceeds the required return, the project may be considered financially attractive. Cost of equity is particularly relevant when assessing projects from the shareholders’ perspective. Therefore, it helps management determine whether proposed investments are capable of generating adequate returns to compensate equity investors for the risk involved.

2. Company Valuation

Cost of equity is widely used in equity valuation to determine the present value of future cash flows available to shareholders. Future dividends or free cash flows to equity can be discounted using the required return on equity. A higher cost of equity results in a higher discount rate and generally reduces the estimated present value of future cash flows. A lower cost of equity can increase the estimated value. Therefore, accurate estimation of cost of equity is essential for determining the intrinsic value of shares and assessing whether a company’s market price appears reasonable.

3. Discounted Cash Flow Valuation

In discounted cash flow valuation, cost of equity is used as the discount rate when valuing cash flows specifically available to equity shareholders. These may include dividends or Free Cash Flow to Equity. The future cash flows are discounted to their present value using the required return of equity investors. This ensures that the valuation reflects the risk and return expectations of shareholders. Therefore, cost of equity is an important input in equity based DCF models and helps determine the present value of expected future benefits received by shareholders.

4. Investment Project Selection

Cost of equity helps management compare alternative investment opportunities according to the return required by equity investors. Projects expected to generate returns significantly above the cost of equity may be more attractive, while projects generating returns below the required return may not adequately compensate shareholders for the risk undertaken. Management can therefore use cost of equity as a hurdle rate or benchmark while evaluating investment proposals. This supports efficient allocation of capital and helps the company select projects that are expected to contribute positively to shareholder wealth.

5. Share Valuation

Cost of equity is an important factor in estimating the fair value of equity shares. Under dividend based valuation models, expected dividends and dividend growth are considered along with the shareholders’ required return. A higher cost of equity reduces the present value of expected dividends, while a lower cost increases it. Investors and analysts can therefore use cost of equity to estimate the intrinsic value of shares and compare it with the current market price. This helps in assessing whether a share may be relatively undervalued or overvalued.

6. Mergers and Acquisitions

Cost of equity is useful in mergers and acquisitions when determining the value of the target company or assessing the financial attractiveness of a proposed transaction. Future cash flows expected from the target business can be discounted using an appropriate cost of equity when an equity based valuation is required. The rate should reflect the risk associated with the target company’s operations and future cash flows. Therefore, cost of equity helps acquiring companies and financial advisers estimate business value, assess potential returns and make informed decisions regarding acquisition opportunities.

7. Performance Evaluation

Cost of equity can be used as a benchmark for evaluating whether a company generates sufficient returns for its shareholders. Management can compare the return earned on equity with the cost of equity. If the return exceeds the cost of equity, the company may be creating value for shareholders. If the return remains below the cost of equity, the company may not be adequately compensating investors for the risk they bear. Therefore, cost of equity provides a useful standard for assessing financial performance and determining whether corporate resources are being used effectively.

8. Capital Structure Decisions

Cost of equity is applied when deciding the appropriate combination of equity and debt financing. Management compares the cost of equity with the after tax cost of debt to determine how different financing choices affect the overall cost of capital. Increasing debt may initially lower the overall cost because of the tax benefit of interest, but excessive debt increases financial risk and may raise the cost of equity. Therefore, cost of equity helps management evaluate financing alternatives and develop a capital structure that balances financing cost, financial risk and shareholder interests.

9. Dividend Policy Decisions

Cost of equity is relevant when deciding whether profits should be distributed as dividends or retained for future investment. Retained earnings have an opportunity cost because shareholders could have received the funds as dividends and invested them elsewhere at a return comparable to their required return. Management can compare the expected return on retained funds with the cost of equity. If reinvested earnings are expected to generate returns above the cost of equity, retaining profits may support value creation. Therefore, cost of equity provides a useful benchmark for dividend and retention decisions.

10. Strategic Investment Decisions

Cost of equity supports strategic decisions involving long term investments such as expansion, diversification, new product development and entry into new markets. These decisions require substantial capital and involve uncertainty about future returns. Management can compare the expected return from such investments with the cost of equity to determine whether they are likely to compensate shareholders adequately. Projects generating returns above the required equity return may contribute to shareholder value. Therefore, cost of equity helps integrate investor return expectations into major strategic investment and valuation decisions.

Cost of Retained Shares

The cost of retained earnings is the cost to a corporation of funds that it has generated internally. If the funds were not retained internally, they would be paid out to investors in the form of dividends. Therefore, the cost of retained earnings approximates the return that investors expect to earn on their equity investment in the company, which can be derived using the capital asset pricing model (CAPM). The CAPM combines the risk-free rate and a stock’s beta to arrive at the cost of equity capital.

Retained Earnings (RE) are the portion of a business’s profits that are not distributed as dividends to shareholders but instead are reserved for reinvestment back into the business. Normally, these funds are used for working capital and fixed asset purchases (capital expenditures) or allotted for paying off debt obligations.

The Purpose of Retained Earnings

Retained earnings represent a useful link between the income statement and the balance sheet, as they are recorded under shareholders’ equity, which connects the two statements. The purpose of retaining these earnings can be varied and includes buying new equipment and machines, spending on research and development, or other activities that could potentially generate growth for the company. This reinvestment into the company aims to achieve even more earnings in the future.

If a company does not believe it can earn a sufficient return on investment from those retained earnings (i.e., earn more than their cost of capital), then they will often distribute those earnings to shareholders as dividends or share buybacks.

Retained Earnings Formula

The RE formula is as follows:

RE = Beginning Period RE + Net Income/Loss – Cash Dividends – Stock Dividends

Where RE = Retained Earnings

Beginning of Period Retained Earnings

At the end of each accounting period, retained earnings are reported on the balance sheet as the accumulated income from the prior year (including the current year’s income), minus dividends paid to shareholders. In the next accounting cycle, the RE ending balance from the previous accounting period will now become the retained earnings beginning balance.

The RE balance may not always be a positive number, as it may reflect that the current period’s net loss is greater than that of the RE beginning balance. Alternatively, a large distribution of dividends that exceed the retained earnings balance can cause it to go negative.

How Net Income Impacts Retained Earnings

Any changes or movement with net income will directly impact the RE balance. Factors such as an increase or decrease in net income and incurrence of net loss will pave the way to either business profitability or deficit. The Retained Earnings account can be negative due to large, cumulative net losses.  Naturally, the same items that affect net income affect RE.

How Dividends Impact Retained Earnings

Distribution of dividends to shareholders can be in the form of cash or stock. Both forms can reduce the value of RE for the business. Cash dividends represent a cash outflow and are recorded as reductions in the cash account. These reduce the size of a company’s balance sheet and asset value as the company no longer owns part of its liquid assets. Stock dividends, however, do not require a cash outflow. Instead, they reallocate a portion of the RE to common stock and additional paid-in capital accounts. This allocation does not impact the overall size of the company’s balance sheet, but it does decrease the value of stocks per share.

End of Period Retained Earnings

At the end of the period, you can calculate your final Retained Earnings balance for the balance sheet by taking the beginning period, adding any net income or net loss, and subtracting any dividends.

Example Calculation

In this example, the amount of dividends paid by XYZ is unknown to us, so using the information from the Balance Sheet and the Income Statement, we can derive it remembering the formula Beginning RE – Ending RE + Net income (-loss) = Dividends

Weighted Average Cost of Capital, Concepts, Definition, Formula, Calculation, Features, Components, Advantages and Limitations

Weighted Average Cost of Capital (WACC) is the average cost of all sources of capital used by a company, weighted according to their proportion in the capital structure. It represents the minimum rate of return that a company must earn on its investments to satisfy all providers of capital, including equity shareholders, preference shareholders, debenture holders, and lenders.

WACC is an important concept in financial management because it serves as a benchmark for evaluating investment projects, business valuation, and financial decision-making. It combines the specific costs of different sources of finance into a single overall cost of capital.

Definition of WACC

Weighted Average Cost of Capital is defined as the average cost of all sources of long-term funds employed by a company, where each source is assigned a weight according to its proportion in the total capital structure.

It reflects the overall required rate of return expected by investors and creditors.

Formula of WACC

General Formula

WACC = (We × Ke) + (Wp × Kp) + (Wd × Kd) + (Wr × Kr)

Where:

  • We = Weight of Equity
  • Ke = Cost of Equity
  • Wp = Weight of Preference Shares
  • Kp = Cost of Preference Capital
  • Wd = Weight of Debt
  • Kd = Cost of Debt
  • Wr = Weight of Retained Earnings
  • Kr = Cost of Retained Earnings

Calculation of WACC

Example

A company has the following capital structure:

Source Amount (₹) Cost (%)
Equity Shares 5,00,000 15%
Preference Shares 2,00,000 10%
Debt 3,00,000 8%

Step 1: Calculate Total Capital

Total Capital = 5,00,000 + 2,00,000 + 3,00,000

= ₹10,00,000

Step 2: Calculate Weights

Equity Weight = 5,00,000 / 10,00,000

= 0.50

Preference Weight = 2,00,000 / 10,00,000

= 0.20

Debt Weight = 3,00,000 / 10,00,000

= 0.30

Step 3: Calculate Weighted Costs

Equity Contribution: = 0.50 × 15%

= 7.50%

Preference Contribution: = 0.20 × 10%

= 2.00%

Debt Contribution: = 0.30 × 8%

= 2.40%

Step 4: Calculate WACC

WACC = 7.50% + 2.00% + 2.40%

WACC = 11.90%

Answer: Weighted Average Cost of Capital = 11.90%

Features of Weighted Average Cost of Capital (WACC)

  • Composite Cost of Capital

Weighted Average Cost of Capital is a composite measure that combines the costs of all sources of long-term finance used by a company. These sources include equity shares, preference shares, debentures, loans, and retained earnings. Instead of analyzing each source separately, WACC provides a single overall cost of financing. This feature helps management understand the total cost incurred for raising capital from different providers. Since every source contributes to financing business operations, WACC presents a comprehensive picture of the company’s financing cost and serves as an important benchmark for financial decision-making.

  • Based on Weighted Proportions

A key feature of WACC is that each source of capital is assigned a weight according to its proportion in the total capital structure. Sources contributing a larger share of funds receive greater weight in the calculation. This weighted approach ensures that the overall cost reflects the actual financing pattern of the company. By considering the relative importance of each source, WACC provides a realistic measure of the average cost of capital. This feature makes WACC more accurate and meaningful than a simple arithmetic average of individual financing costs.

  • Represents Minimum Required Return

WACC indicates the minimum rate of return that a company must earn on its investments to satisfy all providers of capital. If a project’s return exceeds the WACC, it generally adds value to the business and increases shareholder wealth. Conversely, projects earning less than WACC may reduce firm value. This feature makes WACC an important benchmark for evaluating investment proposals. Financial managers use it to determine whether a project is financially viable and capable of covering the cost of funds employed. Therefore, WACC plays a vital role in investment and financing decisions.

  • Reflects Capital Structure

WACC is directly influenced by the composition of a company’s capital structure. Changes in the proportion of equity, debt, preference shares, or retained earnings affect the overall weighted average cost. Since debt and equity have different costs and risk characteristics, any adjustment in their mix will alter the WACC. This feature enables management to analyze the impact of financing decisions on the overall cost of capital. By carefully managing capital structure, companies can attempt to minimize WACC and maximize their market value and profitability.

  • Important Tool for Capital Budgeting

One of the most significant features of WACC is its use in capital budgeting decisions. It serves as the discount rate for evaluating investment projects through techniques such as Net Present Value (NPV) and Discounted Cash Flow (DCF) analysis. Projects generating returns greater than WACC are generally accepted because they create value for investors. This feature helps businesses allocate resources efficiently and select projects that contribute to long-term growth. As a result, WACC is considered an essential tool for investment appraisal and strategic financial planning.

  • Considers Cost and Risk Together

WACC incorporates both the cost and risk associated with different financing sources. Equity shareholders demand higher returns because they bear greater risk, while debt holders generally accept lower returns due to fixed interest payments. By combining these costs according to their proportions, WACC reflects the overall risk-return relationship of the company’s financing structure. This feature helps financial managers understand how risk influences financing costs and investment decisions. It also assists in balancing risk and return to achieve optimal financial performance and sustainable business growth.

  • Dynamic in Nature

WACC is not a fixed figure and changes over time due to variations in market conditions, interest rates, investor expectations, and capital structure. For example, an increase in borrowing costs or a change in shareholder return expectations can affect the overall WACC. Similarly, issuing new equity or debt can alter the weighting of financing sources. This dynamic nature requires companies to regularly review and update their WACC calculations. By doing so, management can ensure that investment decisions remain relevant and consistent with current financial and market conditions.

  • Supports Shareholder Wealth Maximization

The ultimate objective of financial management is to maximize shareholder wealth, and WACC contributes significantly to this goal. By providing a benchmark for evaluating investments and financing decisions, WACC helps management select projects that generate returns above the overall cost of capital. Such projects increase company value and enhance shareholder wealth. WACC also encourages efficient allocation of financial resources and promotes the selection of an optimal capital structure. Therefore, this feature makes WACC a valuable tool for achieving long-term profitability, financial stability, and sustainable growth.

Components of Weighted Average Cost of Capital (WACC)

1. Cost of Equity Capital (Ke)

Cost of equity capital is the return required by equity shareholders for investing their funds in a company. Equity investors bear the highest risk because they receive returns only after all other obligations have been met. Therefore, they expect a higher rate of return than other providers of capital. The cost of equity is usually calculated using methods such as the Dividend Discount Model (DDM) or Capital Asset Pricing Model (CAPM). Since equity often forms a major portion of a company’s capital structure, it significantly influences WACC. A higher cost of equity generally increases the overall cost of capital and affects investment decisions.

Example:

Suppose a company has:

  • Market Price per Share = ₹100
  • Expected Dividend = ₹8
  • Growth Rate = 5%

Ke = (8/100) + 5%

Ke = 13%

Thus, the cost of equity capital is 13%.

2. Cost of Preference Share Capital (Kp)

Cost of preference share capital refers to the return expected by preference shareholders. Preference shares provide a fixed dividend and have priority over equity shares in dividend payments and repayment of capital. Since preference shareholders face less risk than equity shareholders, their required return is usually lower. The cost of preference capital is calculated by dividing the annual preference dividend by the net proceeds from the issue. This component forms part of WACC whenever preference shares are included in the capital structure. It helps management evaluate the overall cost of financing and select appropriate funding sources.

Example:

A company issues preference shares of ₹100 each with a dividend rate of 10%.

Net Proceeds = ₹95

Annual Dividend = ₹10

Kp = 10 / 95 × 100

Kp = 10.53%

Therefore, the cost of preference capital is 10.53%.

3. Cost of Debt Capital (Kd)

Cost of debt capital represents the effective cost of borrowing funds through debentures, bonds, or long-term loans. Debt financing requires fixed interest payments, and because interest is tax-deductible, the after-tax cost of debt is generally lower than its nominal interest rate. This tax advantage makes debt an economical source of finance. The cost of debt is an important component of WACC because many companies rely on borrowed funds for expansion and operations. However, excessive debt can increase financial risk despite its lower cost.

Example:

A company issues debentures worth ₹1,000 carrying 12% interest.

Tax Rate = 30%

Interest = ₹120

After-tax Interest = ₹120 × (1 − 0.30)

= ₹84

Kd = 84 / 1000 × 100

Kd = 8.4%

Thus, the after-tax cost of debt is 8.4%.

4. Cost of Retained Earnings (Kr)

Cost of retained earnings refers to the opportunity cost of profits retained in the business instead of being distributed as dividends. Although retained earnings do not involve direct payments, they are not free because shareholders could have invested those funds elsewhere and earned returns. Therefore, the cost of retained earnings is generally considered equal to the cost of equity capital. This component is important in WACC because retained earnings often finance expansion, modernization, and development projects. Financial managers must ensure that investments financed through retained earnings generate returns at least equal to this cost.

Example:

Suppose shareholders expect a return of 14% on their investments.

The company retains profits instead of paying dividends.

Kr = Ke

Kr = 14%

Therefore, the cost of retained earnings is 14%.

5. Weight of Equity Capital (We)

The weight of equity capital represents the proportion of equity funds in the total capital structure. In WACC calculations, each source of finance is assigned a weight according to its contribution to total financing. The weight of equity helps determine how much influence the cost of equity has on the overall cost of capital. A higher equity proportion increases the impact of equity cost on WACC. Accurate determination of weights is essential because WACC is based on weighted contributions rather than simple averages.

Example:

Equity Capital = ₹5,00,000

Total Capital = ₹10,00,000

We = 5,00,000 / 10,00,000

We = 0.50

Thus, the weight of equity capital is 50%.

6. Weight of Preference Share Capital (Wp)

The weight of preference share capital indicates the proportion of preference shares in the company’s total capital structure. This weight is multiplied by the cost of preference shares to determine its contribution to WACC. The greater the proportion of preference capital, the more influence it has on the overall weighted average cost. Since preference shares provide fixed dividends and limited ownership rights, companies often use them as a supplementary source of long-term finance. Proper calculation of preference share weight ensures accurate WACC estimation.

Example:

Preference Share Capital = ₹2,00,000

Total Capital = ₹10,00,000

Wp = 2,00,000 / 10,00,000

Wp = 0.20

Therefore, the weight of preference share capital is 20%.

7. Weight of Debt Capital (Wd)

The weight of debt capital measures the proportion of debt financing in the company’s capital structure. It plays a crucial role in WACC because debt is usually cheaper than equity due to tax benefits. The weight of debt determines how much influence the cost of debt has on the overall cost of capital. While increasing debt may reduce WACC initially, excessive borrowing can increase financial risk. Therefore, companies must carefully balance debt and equity while determining their capital structure.

Example:

Debt Capital = ₹3,00,000

Total Capital = ₹10,00,000

Wd = 3,00,000 / 10,00,000

Wd = 0.30

Thus, the weight of debt capital is 30%.

8. Total Weighted Cost Contribution

The final component of WACC is the weighted cost contribution of each source of finance. This is obtained by multiplying the cost of each source by its respective weight. The sum of all weighted costs gives the overall WACC. This component integrates all financing sources into a single measure, making it easier for management to evaluate investment projects and financing decisions. The weighted contribution approach ensures that each source influences WACC according to its importance in the capital structure.

Example:

Source Weight Cost
Equity 0.50 15%
Preference 0.20 10%
Debt 0.30 8%

Weighted Costs:

  • Equity = 0.50 × 15 = 7.5%
  • Preference = 0.20 × 10 = 2.0%
  • Debt = 0.30 × 8 = 2.4%

WACC = 7.5 + 2.0 + 2.4

WACC = 11.9%

Therefore, the company’s Weighted Average Cost of Capital is 11.9%. This is the minimum return that projects must generate to create value for investors.

Advantages of Weighted Average Cost of Capital (WACC)

  • Provides a Comprehensive Measure of Capital Cost

WACC combines the costs of all sources of long-term finance, including equity, preference shares, debt, and retained earnings, into a single measure. This provides management with a complete picture of the overall cost of financing business operations. Instead of analyzing each source separately, financial managers can use WACC as a unified benchmark. It reflects the actual financing structure of the company and helps in evaluating the total cost of raising funds. Therefore, WACC serves as a comprehensive and practical tool for financial planning and decision-making.

  • Useful in Capital Budgeting Decisions

WACC is widely used as a discount rate in capital budgeting techniques such as Net Present Value (NPV) and Discounted Cash Flow (DCF) analysis. It helps managers determine whether a proposed investment project will generate sufficient returns to cover the cost of capital. Projects with returns higher than WACC are generally accepted, while those with lower returns are rejected. This ensures efficient allocation of resources and prevents investment in unprofitable ventures. As a result, WACC contributes significantly to sound investment decisions and long-term business growth.

  • Assists in Business Valuation

WACC plays an important role in business valuation by serving as the discount rate for estimating the present value of future cash flows. Investors, analysts, and corporate managers use it to determine the intrinsic value of a company. A lower WACC generally increases the present value of future earnings, thereby increasing company value. Accurate valuation is essential during mergers, acquisitions, restructuring, and investment analysis. Therefore, WACC provides a reliable basis for estimating business worth and making strategic financial decisions related to corporate valuation.

  • Helps in Determining Optimal Capital Structure

One of the major advantages of WACC is that it helps companies identify the most economical mix of debt, equity, and other financing sources. By comparing different financing combinations, management can determine the capital structure that minimizes overall financing costs. A lower WACC generally indicates a more efficient financing arrangement. This helps businesses balance risk and return while maximizing shareholder value. Consequently, WACC serves as an important tool in capital structure planning and assists firms in achieving long-term financial stability and profitability.

  • Facilitates Financial Planning

Financial planning requires accurate information about financing costs and future capital requirements. WACC helps management estimate the average cost of funds and evaluate various financing alternatives. It provides a benchmark for forecasting profitability, assessing investment opportunities, and planning future growth strategies. By incorporating the costs of all financing sources, WACC ensures that financial plans are realistic and aligned with shareholder expectations. This advantage enables businesses to make informed decisions regarding expansion, diversification, and resource allocation while maintaining financial efficiency.

  • Supports Shareholder Wealth Maximization

The primary objective of financial management is to maximize shareholder wealth, and WACC contributes directly to this goal. By serving as a benchmark for investment appraisal, WACC ensures that only projects generating returns above the overall cost of capital are accepted. Such projects create value for investors and increase company profitability. It also helps management avoid investments that could reduce shareholder wealth. Therefore, WACC supports value-creating decisions and promotes efficient use of financial resources, ultimately enhancing the long-term prosperity of shareholders.

  • Reflects the Actual Financing Pattern

Unlike simple average cost calculations, WACC assigns appropriate weights to different financing sources based on their proportion in the capital structure. This weighted approach reflects the actual financing pattern of the company and produces more realistic results. Sources contributing a larger share of funds have a greater impact on the overall cost of capital. This advantage improves the accuracy of financial analysis and decision-making. By considering the relative importance of each financing source, WACC provides a true representation of the company’s financing costs.

  • Easy to Understand and Widely Accepted

WACC is a well-established and widely accepted concept in financial management. Its calculation method is systematic, logical, and easy to understand once the costs and weights of financing sources are known. Financial analysts, investors, corporate managers, and academic researchers frequently use WACC in practice. Its widespread acceptance makes it a standard benchmark for evaluating investments, financing strategies, and company performance. Because of its simplicity and practical usefulness, WACC remains one of the most important tools in corporate finance and investment decision-making.

Limitations of Weighted Average Cost of Capital (WACC)

  • Difficulty in Estimating Component Costs

One of the major limitations of WACC is the difficulty involved in accurately estimating the cost of each source of capital. Calculating the cost of equity, retained earnings, preference shares, and debt often requires assumptions and forecasts. Different methods may produce different results, leading to variations in WACC. For example, the cost of equity can be estimated using CAPM or the Dividend Discount Model, each yielding different values. Inaccurate estimation of component costs can affect investment decisions and reduce the reliability of WACC as a financial management tool.

  • Capital Structure May Change Over Time

WACC is generally calculated using the existing capital structure of a company. However, the proportions of debt, equity, and other financing sources may change in the future due to new financing decisions, market conditions, or business expansion. As a result, the current WACC may not accurately represent future financing costs. Investment projects often have long-term implications, and relying on a WACC based on present capital structure may lead to incorrect evaluations. Therefore, changing capital structures reduce the accuracy and usefulness of WACC in long-term financial planning.

  • Assumes Constant Business Risk

WACC assumes that the risk profile of the company remains constant over time and that all investment projects have a similar level of risk. In reality, different projects involve different levels of uncertainty and business risk. A project operating in a new market or industry may be riskier than the company’s existing operations. Applying the same WACC to all projects can result in inaccurate investment decisions. Consequently, WACC may not provide a suitable discount rate for projects with risk characteristics that differ significantly from the company’s average risk.

  • Sensitive to Market Conditions

The calculation of WACC is highly influenced by market conditions such as interest rates, inflation, and investor expectations. Changes in these factors can alter the cost of debt and equity, thereby affecting the overall WACC. During periods of economic instability, market fluctuations can cause significant variations in financing costs. As a result, WACC may change frequently, making it difficult for management to rely on a single estimate for long-term decision-making. This sensitivity reduces the stability and predictability of WACC as a financial evaluation tool.

  • Dependence on Assumptions

WACC calculations rely heavily on assumptions regarding future returns, growth rates, tax rates, and market performance. These assumptions may not always reflect actual conditions. Small changes in assumptions can lead to significant differences in the calculated WACC. For example, an incorrect estimate of the market risk premium can affect the cost of equity and the overall weighted average cost. Because WACC is assumption-based, its accuracy depends on the quality of forecasts and estimates. This limitation may reduce confidence in investment appraisal and valuation results.

  • Difficult to Apply in Large Companies

Large organizations often have complex capital structures consisting of multiple classes of shares, bonds, loans, and hybrid securities. Calculating the cost and weight of each financing source can be time-consuming and complicated. Differences in maturity periods, interest rates, and financing conditions further increase the complexity. As a result, determining an accurate WACC for large corporations becomes challenging. The complexity of calculations may lead to errors and inconsistencies, reducing the effectiveness of WACC as a decision-making tool in diversified and multinational organizations.

  • Ignores Flotation and Transaction Costs

WACC calculations often focus on the explicit cost of financing sources and may not fully account for flotation costs, underwriting expenses, legal fees, and other transaction costs associated with raising capital. These costs can significantly affect the actual cost of obtaining funds, especially when issuing new securities. Ignoring such expenses may lead to an underestimation of the true cost of capital. Consequently, investment projects evaluated using WACC may appear more profitable than they actually are, resulting in potentially misleading financial decisions.

  • Not Suitable for All Investment Decisions

Although WACC is widely used in financial management, it may not be appropriate for every investment decision. Projects with unique risks, international operations, or special financing arrangements may require separate discount rates rather than the company’s average cost of capital. Using a single WACC for all projects can lead to acceptance of overly risky investments or rejection of profitable opportunities. Therefore, WACC should be used with caution and supplemented with other financial analysis techniques when evaluating projects that differ significantly from the company’s normal operations.

error: Content is protected !!