Sinking Fund, Purpose, Structure, Benefits, Applications

Sinking Fund is a financial mechanism used to set aside money over time for the purpose of repaying debt or replacing a significant asset. It acts as a savings plan that allows an organization or individual to accumulate funds for a specific future obligation, ensuring that they have enough resources to meet that obligation without straining their financial situation.

Purpose of a Sinking Fund:

The primary purpose of a sinking fund is to manage debt repayment or asset replacement efficiently.

  • Reduce Default Risk:

By setting aside funds regularly, borrowers can reduce the risk of default on their obligations. This practice assures lenders that the borrower is financially responsible and prepared to meet repayment terms.

  • Facilitate Large Purchases:

For organizations, sinking funds can help manage significant future expenditures, such as replacing machinery, vehicles, or technology. This ensures that funds are available when needed, mitigating the impact on cash flow.

  • Enhance Financial Planning:

Establishing a sinking fund encourages better financial planning and discipline. Organizations can forecast their future cash requirements, making it easier to allocate resources appropriately.

Structure of a Sinking Fund:

  • Regular Contributions:

The entity responsible for the sinking fund makes regular contributions, typically monthly or annually. The amount of these contributions can be fixed or variable based on a predetermined plan.

  • Interest Earnings:

The contributions are usually invested in low-risk securities or interest-bearing accounts. This investment allows the sinking fund to grow over time through interest earnings, ultimately increasing the amount available for future obligations.

  • Target Amount:

The sinking fund is established with a specific target amount that reflects the total debt or asset replacement cost. The time frame for reaching this target is also defined, ensuring that contributions align with the due date for the obligation.

Benefits of a Sinking Fund:

  • Financial Stability:

By accumulating funds over time, sinking funds contribute to financial stability, reducing the pressure to secure large amounts of money at once.

  • Improved Creditworthiness:

A well-managed sinking fund can enhance an organization’s credit rating. Lenders view sinking funds as a positive indicator of an entity’s ability to manage its debts responsibly.

  • Cost Management:

Sinking funds help manage the cost of large purchases or debt repayments by spreading the financial burden over time, reducing the impact on cash flow.

  • Flexibility:

The structure of a sinking fund can be adjusted based on changing financial circumstances. Contributions can be increased or decreased as needed, providing flexibility in financial planning.

  • Risk Mitigation:

By setting aside funds in advance, entities can mitigate the risks associated with sudden financial obligations, ensuring they are prepared for unexpected expenses or economic downturns.

Practical Applications of Sinking Funds:

  • Corporate Bonds:

Many corporations issue bonds that require a sinking fund to be established. The company sets aside money regularly to repay bondholders at maturity or periodically throughout the life of the bond.

  • Municipal Bonds:

Local governments often use sinking funds to repay municipal bonds. This practice ensures that they can meet their obligations without significantly impacting their budgets.

  • Asset Replacement:

Businesses may establish sinking funds for replacing equipment or vehicles. By planning ahead, they can avoid large capital outlays and maintain operations without disruption.

  • Real Estate:

Property management companies may set up sinking funds for the maintenance and eventual replacement of common areas or amenities within residential complexes.

  • Educational Institutions:

Schools and universities may use sinking funds to save for future building projects or major renovations, ensuring they can finance these endeavors without resorting to debt.

Perpetuity, Function

Perpetuity refers to a financial instrument or cash flow that continues indefinitely without an end. In simpler terms, it is a stream of cash flows that occurs at regular intervals for an infinite duration. The present value of a perpetuity can be calculated using the formula:

PV = C/ r

Where,

C is the cash flow per period

r is the discount rate.

The concept of perpetuity has several important functions in finance and investment analysis. Here are eight key functions of perpetuity:

  • Valuation of Investments:

Perpetuity provides a method for valuing investments that generate constant cash flows over an indefinite period. This is particularly useful in valuing companies, real estate, and other assets that are expected to generate steady income streams indefinitely. By calculating the present value of these cash flows, investors can determine the fair value of such assets.

  • Determining Fixed Income Securities:

Perpetuities are often used in valuing fixed income securities like preferred stocks and bonds that pay a constant dividend or interest indefinitely. Investors can assess the attractiveness of these securities by comparing their present value to the market price, thus aiding investment decisions.

  • Simplifying Financial Analysis:

The concept of perpetuity simplifies complex financial models by allowing analysts to consider cash flows that extend indefinitely. This simplification is particularly valuable in scenarios where cash flows are expected to remain constant over a long period, providing a clearer picture of an investment’s worth.

  • Corporate Valuation:

In corporate finance, perpetuity is a critical component of valuation models, such as the Gordon Growth Model, which estimates the value of a company based on its expected future dividends. By considering dividends as a perpetuity, analysts can derive a more accurate valuation for firms with stable dividend policies.

  • Real Estate Investment:

In real estate, perpetuity helps in evaluating properties that generate consistent rental income. Investors can use the perpetuity formula to estimate the present value of future rental cash flows, facilitating better decision-making regarding property purchases or investments.

  • Retirement Planning:

Perpetuity can assist individuals in planning for retirement. By understanding how much they can withdraw from their retirement savings while maintaining a sustainable income level indefinitely, retirees can ensure financial security throughout their retirement years.

  • Life Insurance Valuation:

Perpetuities play a role in life insurance products that provide lifelong benefits. The present value of future benefits can be calculated using the perpetuity concept, aiding insurers in pricing their products and ensuring they can meet future obligations.

  • Evaluating Charitable Donations:

Nonprofit organizations can benefit from the concept of perpetuity when structuring endowments or perpetual funds. These funds are designed to provide a steady stream of income for ongoing operations, scholarships, or charitable initiatives. By understanding the present value of these perpetual cash flows, organizations can make informed decisions about resource allocation and fund management.

Business Quantitative Analysis 1st Semester BU B.Com SEP Notes

Unit 1,2,3,4 Pl. Refer Books Book


Unit 5 [Book]
Definition of Interest and Other Terms: Simple Interest and Compound Interest VIEW
Effective rate of Interest:
Present Value VIEW
Future Value VIEW
Perpetuity VIEW
Annuity VIEW
Sinking Fund VIEW
Valuation of Bonds VIEW
Calculating of EMI VIEW


Frequency Distribution, Meaning, Principles, Types, Steps and Advantages

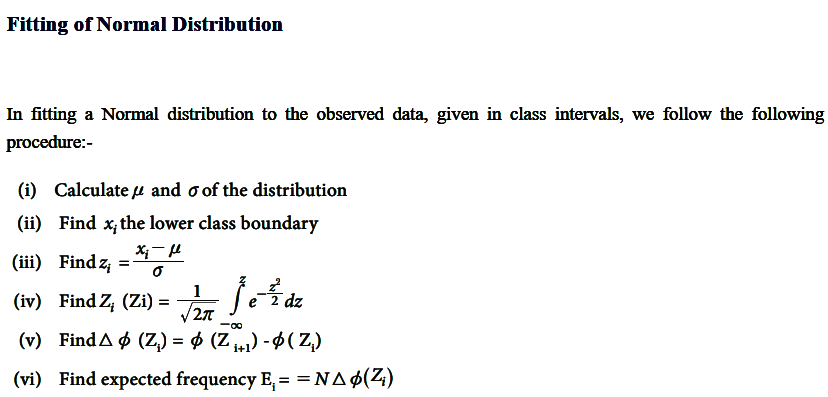
Frequency distribution is a systematic arrangement of data showing the number of times each value or group of values occurs in a dataset. It is one of the most important methods of organizing statistical data. Frequency distribution simplifies a large volume of raw data by grouping observations into classes and showing their respective frequencies. This makes the data easier to understand, analyze, and interpret.

The construction of a frequency distribution involves arranging data into class intervals and recording the number of observations falling within each interval.

Principles for Constructing Frequency Distribution

1. Principle of Clearly Defined Class Intervals

Class intervals should be clearly defined so that every observation can be placed in the correct class without confusion. Ambiguous or overlapping class limits may lead to incorrect classification and inaccurate results. Clear intervals improve the reliability and usefulness of the frequency distribution. The lower and upper limits of each class should be specified precisely. Readers should easily understand the scope of every class interval. Well-defined classes ensure consistency in data organization and make statistical analysis more accurate. Therefore, clarity in class interval definition is a fundamental principle of constructing an effective frequency distribution.

2. Principle of Mutual Exclusiveness

The classes in a frequency distribution should be mutually exclusive. This means that an observation must belong to only one class and not fit into multiple classes simultaneously. Overlapping class intervals create confusion and may result in double counting. For example, intervals such as 10–20 and 20–30 can create ambiguity regarding the value 20. To avoid this problem, class limits should be designed carefully. Mutual exclusiveness ensures accuracy and consistency in classification. It allows each observation to be counted only once, thereby improving the reliability of the frequency distribution.

3. Principle of Continuity

Class intervals should be continuous without gaps between successive classes. Every possible observation within the range of data should have a place in the distribution. Continuous classes ensure smooth classification and prevent the omission of observations. If gaps exist between intervals, some values may remain unclassified, reducing the completeness of the distribution. Continuous class intervals are especially important in grouped frequency distributions involving measurable variables. By maintaining continuity, statisticians can ensure that all data values are represented properly and that the frequency distribution provides a complete picture of the dataset.

4. Principle of Exhaustiveness

A frequency distribution should be exhaustive, meaning that it must include all observations in the dataset. Every data value should fit into one of the class intervals. No observation should be left out of the distribution. Exhaustiveness ensures completeness and accuracy in data presentation. If certain observations remain unclassified, the frequency totals will not match the total number of observations collected. This can lead to incorrect conclusions and statistical errors. Therefore, class intervals should be designed in such a way that they cover the entire range of data and accommodate every observation.

5. Principle of Appropriate Number of Classes

The number of classes should be chosen carefully. Too many classes make the frequency distribution lengthy and complicated, while too few classes may hide important details and variations. A reasonable number of classes provides a balance between simplicity and completeness. Generally, frequency distributions contain between five and fifteen classes, depending on the size of the dataset. The objective is to present information clearly without losing significant details. Proper selection of the number of classes improves readability, facilitates analysis, and ensures that the distribution effectively summarizes the data.

6. Principle of Suitable Class Width

Class width refers to the size of each class interval. The width should be neither too large nor too small. Very wide intervals may conceal important variations within the data, while very narrow intervals may create an excessive number of classes and make the table difficult to interpret. Uniform class widths are generally preferred because they simplify analysis and comparison. Appropriate class width ensures meaningful grouping of observations and enhances the usefulness of the frequency distribution. Therefore, selecting a suitable class width is essential for effective data presentation and statistical interpretation.

7. Principle of Simplicity and Clarity

A frequency distribution should be simple and easy to understand. The arrangement of class intervals and frequencies should be logical and straightforward. Complex classifications and unnecessary details should be avoided because they may confuse readers. Simplicity improves readability and allows users to interpret the information quickly. Clear headings, properly arranged classes, and accurate frequencies contribute to effective communication. A simple frequency distribution is more useful for statistical analysis and decision-making. Therefore, maintaining simplicity and clarity is an important principle in the construction of frequency distributions.

8. Principle of Accuracy

Accuracy is one of the most important principles in constructing a frequency distribution. Frequencies must be counted carefully, and observations should be classified correctly. Errors in tallying, counting, or classifying data can distort the distribution and lead to incorrect statistical analysis. Every step, from data collection to frequency calculation, should be performed with precision. Accurate frequency distributions provide reliable information for research, business analysis, and decision-making. Since statistical conclusions depend on the correctness of the data presented, maintaining accuracy is essential for ensuring the credibility and usefulness of the frequency distribution.

Types of Frequency Distribution

1. Simple Frequency Distribution

Simple frequency distribution is the most basic type of frequency distribution. It presents each value of a variable along with the number of times it occurs in the dataset. This method is suitable when the data contains a limited number of distinct values. It helps organize raw data into a concise and understandable form. Simple frequency distribution is widely used in educational and business studies to summarize information efficiently. It allows researchers to identify the occurrence of each value and understand the overall distribution of observations without dealing with complex classifications.

Example:

Number of Defects Frequency
0 5
1 8
2 6
3 4
4 2

2. Grouped Frequency Distribution

Grouped frequency distribution arranges data into class intervals and records the frequency of observations within each interval. This type is used when the dataset contains a large number of observations or continuous values. Grouping reduces complexity and makes data easier to analyze. It helps identify trends, patterns, and concentration of observations. Grouped frequency distributions are commonly used in business, economics, and research studies. By organizing data into intervals, they provide a compact summary of large datasets and facilitate statistical calculations such as averages and measures of dispersion.

Example:

Marks Frequency
0–10 4
10–20 8
20–30 12
30–40 10
40–50 6

3. Ungrouped Frequency Distribution

An ungrouped frequency distribution lists every individual value separately along with its frequency. Unlike grouped distributions, no class intervals are used. This type is suitable for small datasets where observations can be displayed individually without making the table lengthy. Ungrouped frequency distributions provide exact information about each value and its occurrence. They are useful in situations where detailed analysis of individual observations is required. However, they become less practical when the dataset is large. Therefore, they are generally applied in small-scale studies and introductory statistical exercises.

Example:

Number of Books Sold Frequency
5 2
6 4
7 5
8 3
9 1

4. Cumulative Frequency Distribution

Cumulative frequency distribution shows the running total of frequencies. Instead of presenting individual frequencies alone, it accumulates frequencies from one class to the next. This type helps determine the number of observations below or above a particular value. Cumulative frequency distributions are useful for calculating median, quartiles, percentiles, and for constructing ogives. They provide insights into the cumulative position of observations within the dataset. There are two forms: less-than cumulative frequency and more-than cumulative frequency distributions.

Example (Less Than Type):

Marks Less Than Cumulative Frequency
10 4
20 12
30 24
40 34
50 40

5. Relative Frequency Distribution

Relative frequency distribution expresses frequencies as fractions or proportions of the total number of observations. It shows the relative importance of each class within the dataset. Relative frequencies are calculated by dividing class frequencies by the total frequency. This distribution helps compare different datasets, especially when they differ in size. It provides a clearer understanding of the proportion represented by each category. Relative frequency distributions are widely used in market research, quality control, and business analysis where percentage comparisons are important.

Example:

Product Type Frequency Relative Frequency
A 20 0.40
B 15 0.30
C 10 0.20
D 5 0.10

Total Frequency = 50

6. Percentage Frequency Distribution

A percentage frequency distribution is similar to a relative frequency distribution, but frequencies are expressed as percentages rather than proportions. This format is easy to understand and interpret because percentages are familiar to most users. It helps compare categories effectively and is widely used in business reports, surveys, and demographic studies. Percentage frequency distributions simplify communication and make statistical findings more accessible. They are particularly useful when presenting data to audiences who may not have extensive statistical knowledge.

Example:

Customer Preference Frequency Percentage
Product A 40 40%
Product B 30 30%
Product C 20 20%
Product D 10 10%

7. Discrete Frequency Distribution

Discrete frequency distribution is used for variables that take distinct and countable values. Each value is listed separately along with its corresponding frequency. Examples include the number of employees, number of children, number of products sold, or number of defects. Since discrete variables cannot take fractional values, frequencies are assigned to individual observations. This distribution provides precise information and helps analyze count-based data. It is commonly used in business operations, production management, and social science research where variables are measured in whole numbers.

Example:

Number of Children Frequency
1 6
2 10
3 8
4 4
5 2

8. Continuous Frequency Distribution

Continuous frequency distribution is used for variables that can take any value within a specified range. Data is grouped into continuous class intervals, and frequencies are recorded for each interval. Examples include age, income, height, weight, and sales revenue. This type of distribution is suitable for large datasets involving measurable quantities. Continuous frequency distributions simplify complex information and facilitate statistical analysis. They are also essential for constructing histograms, frequency polygons, and other graphical representations used in business and research.

Example:

Income (₹) Frequency
0–10,000 5
10,000–20,000 12
20,000–30,000 18
30,000–40,000 10
40,000–50,000 5

Steps in the Construction of Frequency Distribution

Step 1. Collection of Raw Data

The first step in constructing a frequency distribution is the collection of raw data. Raw data refers to the original facts and figures gathered from surveys, observations, experiments, questionnaires, or records. At this stage, the information is usually unorganized and arranged randomly. Since raw data is difficult to analyze directly, it must first be collected accurately and systematically. The quality of the frequency distribution depends on the reliability of the collected data. Any errors during collection may affect the final results. Therefore, proper collection of data is essential for meaningful statistical analysis and interpretation.

Example: Marks of 15 students:

25, 30, 45, 50, 35, 40, 55, 60, 65, 70, 75, 80, 45, 50, 55

Step 2. Determination of Range

After collecting the raw data, the next step is determining the range. The range measures the spread of the data and is calculated by subtracting the smallest value from the largest value. It helps in deciding suitable class intervals and class widths. A larger range generally requires more classes, whereas a smaller range may require fewer classes. Determining the range gives a preliminary understanding of data distribution and assists in organizing observations effectively. It is an important step because the entire frequency distribution is based on the extent of variation present in the dataset.

Formula: Range = Highest Value − Lowest Value

Example:

Highest value = 80

Lowest value = 25

Range = 80 − 25 = 55

Step 3. Determination of Number of Classes

The third step involves deciding the number of class intervals into which the data will be grouped. The number of classes should be reasonable because too many classes make the table complex, while too few classes may hide important information. Generally, between 5 and 15 classes are used depending on the size of the dataset. Statisticians often use Sturges’ Formula to determine an appropriate number of classes. Proper selection of classes improves clarity, comparability, and usefulness of the frequency distribution. This step ensures that the data is grouped in a balanced and meaningful manner.

Formula: k = 1 + 3.322 log N

Where:

k = Number of classes

N = Total observations

Example:

If N = 50,

k = 1 + 3.322 log (50)

k ≈ 7 classes

Step 4. Calculation of Class Width

Class width refers to the size of each class interval. After determining the range and number of classes, the class width is calculated by dividing the range by the number of classes. The result is generally rounded to a convenient whole number. Appropriate class width is important because very narrow intervals create too many classes, while very wide intervals may hide significant variations. A suitable class width ensures that the frequency distribution remains clear, balanced, and informative. This step provides the basis for creating meaningful class intervals that adequately represent the data.

Formula: Class Width = Range ÷ Number of Classes

Example:

Range = 55

Number of Classes = 6

Class Width = 55 ÷ 6 ≈ 9.17

Rounded Class Width = 10

Step 5. Formation of Class Intervals

Once the class width is determined, class intervals are formed. Class intervals are groups into which observations are categorized. These intervals should be mutually exclusive, continuous, and exhaustive. Every observation should belong to one and only one class. Properly formed intervals make the frequency distribution easier to understand and analyze. The intervals may follow the inclusive or exclusive method depending on the nature of the data. The formation of suitable class intervals is crucial because it directly affects the accuracy and usefulness of the frequency distribution.

Example:

Class Interval
20–29
30–39
40–49
50–59
60–69
70–79
80–89

These intervals cover all observations and maintain equal width.

Step 6. Tallying the Observations

After forming class intervals, each observation is examined and placed into its appropriate class using tally marks. Tally marks are simple counting symbols used to record frequencies accurately. Every observation falling within a class interval is represented by a tally mark. Groups of five tally marks are usually shown with the fifth mark crossing the previous four. Tallying helps avoid counting errors and provides an easy method of organizing observations before calculating frequencies. This step acts as a bridge between raw data and frequency counting, ensuring accuracy and completeness in the frequency distribution process.

Example:

Class Interval Tally Marks
20–29 |
30–39 ||
40–49 |||
50–59 ||||
60–69 |||
70–79 ||
80–89 |

Step 7. Counting Frequencies

Once tallying is completed, the tally marks in each class interval are counted to determine the frequency. Frequency refers to the number of observations that fall within a particular class. This step converts tally marks into numerical values and provides a summarized picture of the data. Accurate frequency counting is essential because it forms the basis for statistical analysis, graphs, and interpretation. Frequencies reveal how data is distributed across different classes and help identify concentration, patterns, and trends. This step transforms raw observations into meaningful statistical information.

Example:

Class Interval Frequency
20–29 1
30–39 2
40–49 3
50–59 4
60–69 3
70–79 2
80–89 1

Step 8. Preparation of the Final Frequency Distribution Table

The final step is preparing the frequency distribution table. In this table, class intervals and their corresponding frequencies are arranged systematically. The table should include a suitable title, properly labeled columns, and accurate totals. It provides a concise summary of the entire dataset and serves as the basis for further statistical analysis and graphical presentation. A well-prepared frequency distribution table helps readers understand data patterns quickly and facilitates interpretation. This final presentation converts scattered raw data into an organized and meaningful statistical form suitable for business and research purposes.

Example: Frequency Distribution of Students’ Marks

Marks Frequency
20–29 1
30–39 2
40–49 3
50–59 4
60–69 3
70–79 2
80–89 1
Total 16

This table clearly summarizes the distribution of marks and makes analysis simple and effective.

Advantages of Frequency Distribution

  • Simplifies Large Volumes of Data

One of the greatest advantages of frequency distribution is that it simplifies large and complex datasets. Raw data often contains numerous observations that are difficult to understand and analyze. Frequency distribution organizes this information into classes and frequencies, making it more manageable and meaningful. Instead of examining each individual observation, users can study summarized information. This saves effort and improves understanding. By presenting data in a structured form, frequency distribution enables researchers, managers, and students to grasp the overall nature of the dataset quickly and efficiently without being overwhelmed by excessive details.

  • Facilitates Statistical Analysis

Frequency distribution provides a strong foundation for statistical analysis. Various statistical measures such as mean, median, mode, standard deviation, and variance can be calculated more easily when data is organized into a frequency distribution. The arrangement of observations into classes simplifies computations and reduces complexity. Researchers can identify patterns and relationships more effectively. Without frequency distribution, statistical calculations involving large datasets would be cumbersome and time-consuming. Therefore, frequency distribution serves as an essential tool for conducting accurate and efficient statistical analysis in business, economics, and research studies.

  • Improves Understanding of Data

Frequency distribution enhances the understanding of data by presenting information in a clear and organized manner. Raw data often appears confusing because observations are scattered randomly. By grouping similar observations into classes, frequency distribution provides a concise summary of the dataset. Readers can quickly understand how data is distributed and where observations are concentrated. This organized presentation improves comprehension and reduces the possibility of misunderstanding. As a result, students, researchers, and decision-makers can interpret information more effectively and draw meaningful conclusions from the data presented.

  • Reveals Patterns and Trends

A frequency distribution helps identify patterns, trends, and characteristics within the data. It shows how observations are distributed across different classes, making it easier to detect concentrations, gaps, and variations. Researchers can observe whether data is evenly distributed or clustered around certain values. Trends that may not be visible in raw data become more apparent through frequency distribution. This advantage is particularly useful in business forecasting, market research, and performance evaluation. By revealing important patterns, frequency distributions assist organizations in understanding situations and making informed decisions based on statistical evidence.

  • Facilitates Comparison

Frequency distribution makes comparison easier by presenting data in a structured format. Different groups, categories, or datasets can be compared by examining their frequencies. For example, sales performance across regions or customer age groups can be compared effectively using frequency distributions. Comparisons help identify similarities, differences, strengths, and weaknesses. Such information is valuable for business planning and evaluation. Without organized frequency data, comparisons would require examining individual observations, which is both difficult and time-consuming. Therefore, the comparative advantage of frequency distribution significantly enhances its usefulness in statistical studies.

  • Supports Graphical Presentation

Frequency distribution serves as the basis for various graphical presentations such as histograms, frequency polygons, ogives, and bar charts. Graphs require organized frequency data for accurate construction. By summarizing observations into class intervals and frequencies, frequency distributions provide the necessary information for visual representation. Graphical presentations make data more attractive, understandable, and accessible to a wider audience. Visual displays also help identify patterns and trends quickly. Therefore, frequency distribution plays a vital role in transforming numerical information into graphical forms that facilitate effective communication and interpretation.

  • Saves Time and Space

Another important advantage of frequency distribution is that it saves both time and space. Large datasets can be summarized in a compact table instead of presenting every individual observation. This reduces the amount of space required for data presentation and makes information easier to handle. Analysts and decision-makers can quickly review summarized data rather than spending time examining extensive raw information. The concise nature of frequency distributions improves efficiency and productivity. Consequently, they are widely used in business reports, research studies, and statistical publications where clear and economical presentation is essential.

  • Assists Decision-Making

Frequency distribution provides valuable information for decision-making by presenting data in a clear and meaningful form. Managers, researchers, and policymakers can use frequency distributions to evaluate performance, identify trends, and assess alternatives. Organized data enables them to understand situations accurately and make informed decisions. For example, businesses can analyze customer preferences, sales patterns, and production levels through frequency distributions. Reliable statistical information reduces uncertainty and improves planning. Therefore, frequency distribution is an important tool that supports effective decision-making and contributes to the success of business and research activities.

Business Mathematics & Statistics Bangalore University B.com 3rd Semester NEP Notes

Unit 1 Commercial Arithmetic [Book]
Percentage VIEW
Cost, Profit and Selling price VIEW
Ratio Proportion VIEW
Problems on Speed and Time VIEW
Interest-Simple interest and Compound interest VIEW
Annuity VIEW


Unit 2 Theory of Equations [Book] No Update


Unit 3 Matrices and Determinants [Book] No Update


Unit 4 Measures of Central Tendency and Dispersion [Book]
Introduction Meaning and Definition, Objectives of measures of Central tendency VIEW
Types of averages: Arithmetic mean (Simple average only) VIEW
Median VIEW
Mode VIEW
Meaning and Objectives of measures of Dispersion VIEW
VIEW VIEW
Standard deviation and coefficient of Variation VIEW
Skewness VIEW VIEW
Problems on Direct method only VIEW


Unit 5 Correlation and Regression [Book]
Correlation: Meaning and definition-uses VIEW VIEW
VIEW
Karl Pearson’s coefficient of correlation (deviation from actual mean only) VIEW
Spearman’s Rank Correlation Coefficient VIEW
Regression Meaning VIEW
Regression Equations, Estimating x and y values VIEW
Finding correlation coefficient with Regression coefficient VIEW VIEW

Normal Distribution: Importance, Central Limit Theorem

Normal distribution, or the Gaussian distribution, is a fundamental probability distribution that describes how data values are distributed symmetrically around a mean. Its graph forms a bell-shaped curve, with most data points clustering near the mean and fewer occurring as they deviate further. The curve is defined by two parameters: the mean (μ) and the standard deviation (σ), which determine its center and spread. Normal distribution is widely used in statistics, natural sciences, and social sciences for analysis and inference.

The general form of its probability density function is:

The parameter μ is the mean or expectation of the distribution (and also its median and mode), while the parameter σ is its standard deviation. The variance of the distribution is σ^2. A random variable with a Gaussian distribution is said to be normally distributed, and is called a normal deviate.

Normal distributions are important in statistics and are often used in the natural and social sciences to represent real-valued random variables whose distributions are not known. Their importance is partly due to the central limit theorem. It states that, under some conditions, the average of many samples (observations) of a random variable with finite mean and variance is itself a random variable whose distribution converges to a normal distribution as the number of samples increases. Therefore, physical quantities that are expected to be the sum of many independent processes, such as measurement errors, often have distributions that are nearly normal.

A normal distribution is sometimes informally called a bell curve. However, many other distributions are bell-shaped (such as the Cauchy, Student’s t, and logistic distributions).

Importance of Normal Distribution:

  1. Foundation of Statistical Inference

The normal distribution is central to statistical inference. Many parametric tests, such as t-tests and ANOVA, are based on the assumption that the data follows a normal distribution. This simplifies hypothesis testing, confidence interval estimation, and other analytical procedures.

  1. Real-Life Data Approximation

Many natural phenomena and datasets, such as heights, weights, IQ scores, and measurement errors, tend to follow a normal distribution. This makes it a practical and realistic model for analyzing real-world data, simplifying interpretation and analysis.

  1. Basis for Central Limit Theorem (CLT)

The normal distribution is critical in understanding the Central Limit Theorem, which states that the sampling distribution of the sample mean approaches a normal distribution as the sample size increases, regardless of the population’s actual distribution. This enables statisticians to make predictions and draw conclusions from sample data.

  1. Application in Quality Control

In industries, normal distribution is widely used in quality control and process optimization. Control charts and Six Sigma methodologies assume normality to monitor processes and identify deviations or defects effectively.

  1. Probability Calculations

The normal distribution allows for the easy calculation of probabilities for different scenarios. Its standardized form, the z-score, simplifies these calculations, making it easier to determine how data points relate to the overall distribution.

  1. Modeling Financial and Economic Data

In finance and economics, normal distribution is used to model returns, risks, and forecasts. Although real-world data often exhibit deviations, normal distribution serves as a baseline for constructing more complex models.

Central limit theorem

In probability theory, the central limit theorem (CLT) establishes that, in many situations, when independent random variables are added, their properly normalized sum tends toward a normal distribution (informally a bell curve) even if the original variables themselves are not normally distributed. The theorem is a key concept in probability theory because it implies that probabilistic and statistical methods that work for normal distributions can be applicable to many problems involving other types of distributions. This theorem has seen many changes during the formal development of probability theory. Previous versions of the theorem date back to 1810, but in its modern general form, this fundamental result in probability theory was precisely stated as late as 1920, thereby serving as a bridge between classical and modern probability theory.

Characteristics Fitting a Normal Distribution

Poisson Distribution: Importance Conditions Constants, Fitting of Poisson Distribution

Poisson distribution is a probability distribution used to model the number of events occurring within a fixed interval of time, space, or other dimensions, given that these events occur independently and at a constant average rate.

Importance

  1. Modeling Rare Events: Used to model the probability of rare events, such as accidents, machine failures, or phone call arrivals.
  2. Applications in Various Fields: Applicable in business, biology, telecommunications, and reliability engineering.
  3. Simplifies Complex Processes: Helps analyze situations with numerous trials and low probability of success per trial.
  4. Foundation for Queuing Theory: Forms the basis for queuing models used in service and manufacturing industries.
  5. Approximation of Binomial Distribution: When the number of trials is large, and the probability of success is small, Poisson distribution approximates the binomial distribution.

Conditions for Poisson Distribution

  1. Independence: Events must occur independently of each other.
  2. Constant Rate: The average rate (λ) of occurrence is constant over time or space.
  3. Non-Simultaneous Events: Two events cannot occur simultaneously within the defined interval.
  4. Fixed Interval: The observation is within a fixed time, space, or other defined intervals.

Constants

  1. Mean (λ): Represents the expected number of events in the interval.
  2. Variance (λ): Equal to the mean, reflecting the distribution’s spread.
  3. Skewness: The distribution is skewed to the right when λ is small and becomes symmetric as λ increases.
  4. Probability Mass Function (PMF): P(X = k) = [e^−λ*λ^k] / k!, Where is the number of occurrences, is the base of the natural logarithm, and λ is the mean.

Fitting of Poisson Distribution

When a Poisson distribution is to be fitted to an observed data the following procedure is adopted:

Binomial Distribution: Importance Conditions, Constants

The binomial distribution is a probability distribution that summarizes the likelihood that a value will take one of two independent values under a given set of parameters or assumptions. The underlying assumptions of the binomial distribution are that there is only one outcome for each trial, that each trial has the same probability of success, and that each trial is mutually exclusive, or independent of each other.

In probability theory and statistics, the binomial distribution with parameters n and p is the discrete probability distribution of the number of successes in a sequence of n independent experiments, each asking a yes, no question, and each with its own Boolean-valued outcome: success (with probability p) or failure (with probability q = 1 − p). A single success/failure experiment is also called a Bernoulli trial or Bernoulli experiment, and a sequence of outcomes is called a Bernoulli process; for a single trial, i.e., n = 1, the binomial distribution is a Bernoulli distribution. The binomial distribution is the basis for the popular binomial test of statistical significance.

The binomial distribution is frequently used to model the number of successes in a sample of size n drawn with replacement from a population of size N. If the sampling is carried out without replacement, the draws are not independent and so the resulting distribution is a hypergeometric distribution, not a binomial one. However, for N much larger than n, the binomial distribution remains a good approximation, and is widely used

The binomial distribution is a common discrete distribution used in statistics, as opposed to a continuous distribution, such as the normal distribution. This is because the binomial distribution only counts two states, typically represented as 1 (for a success) or 0 (for a failure) given a number of trials in the data. The binomial distribution, therefore, represents the probability for x successes in n trials, given a success probability p for each trial.

Binomial distribution summarizes the number of trials, or observations when each trial has the same probability of attaining one particular value. The binomial distribution determines the probability of observing a specified number of successful outcomes in a specified number of trials.

The binomial distribution is often used in social science statistics as a building block for models for dichotomous outcome variables, like whether a Republican or Democrat will win an upcoming election or whether an individual will die within a specified period of time, etc.

Importance

For example, adults with allergies might report relief with medication or not, children with a bacterial infection might respond to antibiotic therapy or not, adults who suffer a myocardial infarction might survive the heart attack or not, a medical device such as a coronary stent might be successfully implanted or not. These are just a few examples of applications or processes in which the outcome of interest has two possible values (i.e., it is dichotomous). The two outcomes are often labeled “success” and “failure” with success indicating the presence of the outcome of interest. Note, however, that for many medical and public health questions the outcome or event of interest is the occurrence of disease, which is obviously not really a success. Nevertheless, this terminology is typically used when discussing the binomial distribution model. As a result, whenever using the binomial distribution, we must clearly specify which outcome is the “success” and which is the “failure”.

The binomial distribution model allows us to compute the probability of observing a specified number of “successes” when the process is repeated a specific number of times (e.g., in a set of patients) and the outcome for a given patient is either a success or a failure. We must first introduce some notation which is necessary for the binomial distribution model.

First, we let “n” denote the number of observations or the number of times the process is repeated, and “x” denotes the number of “successes” or events of interest occurring during “n” observations. The probability of “success” or occurrence of the outcome of interest is indicated by “p”.

The binomial equation also uses factorials. In mathematics, the factorial of a non-negative integer k is denoted by k!, which is the product of all positive integers less than or equal to k. For example,

  • 4! = 4 x 3 x 2 x 1 = 24,
  • 2! = 2 x 1 = 2,
  • 1!=1.
  • There is one special case, 0! = 1.

Conditions

  • The number of observations n is fixed.
  • Each observation is independent.
  • Each observation represents one of two outcomes (“success” or “failure”).
  • The probability of “success” p is the same for each outcome

Constants

Fitting of Binomial Distribution

Fitting of probability distribution to a series of observed data helps to predict the probability or to forecast the frequency of occurrence of the required variable in a certain desired interval.

To fit any theoretical distribution, one should know its parameters and probability distribution. Parameters of Binomial distribution are n and p. Once p and n are known, binomial probabilities for different random events and the corresponding expected frequencies can be computed. From the given data we can get n by inspection. For binomial distribution, we know that mean is equal to np hence we can estimate p as = mean/n. Thus, with these n and p one can fit the binomial distribution.

There are many probability distributions of which some can be fitted more closely to the observed frequency of the data than others, depending on the characteristics of the variables. Therefore, one needs to select a distribution that suits the data well.

Constructing Index Numbers

An index number is a statistical tool used to measure changes in the value of money. It indicates the average price level of a selected group of commodities at a specific point in time compared to the average price level of the same group at another time.

It represents the average of various items expressed in different units. Additionally, an index number reflects the overall increase or decrease in the average prices of the group being studied. For example, if the Consumer Price Index rises from 100 in 1980 to 150 in 1982, it indicates a 50 percent rise in the prices of the commodities included. Furthermore, an index number shows the degree of change in the value of money (or the price level) over time, based on a chosen base year. If the base year is 1970, we can evaluate the change in the average price level for both earlier and later years.

Construction of Index Number:

1. Define the Objective and Scope

The first step in constructing an index number is to define its purpose clearly. The objective may be to measure changes in prices, quantities, or values over time or between regions. This determines whether a price index, quantity index, or value index is required. Additionally, the scope must be outlined—whether it’s for a particular sector (like retail or wholesale prices) or a specific group (such as urban consumers). Defining the objective ensures relevance, appropriate selection of items, and accurate interpretation of the index in practical use.

2. Selection of the Base Year

The base year is the reference year against which changes are compared. It is assigned a value of 100, and all subsequent values are calculated in relation to it. The base year should be a “normal” year—free from major economic disruptions like inflation, war, or natural disasters. A poorly chosen base year may distort the index. Additionally, it should be recent enough to reflect current trends but stable enough to serve as a benchmark. Periodic updating of the base year is essential for long-term accuracy.

3. Selection of Commodities

Next, a representative basket of goods and services must be selected. These commodities should reflect the consumption habits or production patterns of the population or sector under study. Items should be commonly used, available throughout the period, and consistent in quality. Too many items can complicate calculations, while too few may result in an unrepresentative index. For example, the Consumer Price Index includes food, clothing, fuel, and transportation. Proper selection ensures the index accurately reflects real economic conditions and consumer behavior.

4. Collection of Price Data

Prices for the selected commodities must be collected for both the base year and the current year. This data should be gathered from reliable sources such as retail shops, wholesale markets, or government reports. Consistency in quality, unit, and location is crucial to ensure accuracy. Prices may vary by region, seller, or time, so care must be taken to eliminate anomalies. Regular and systematic price collection—monthly or quarterly—is often used in official indices. Errors or inconsistencies in this stage can significantly affect the results.

5. Assigning Weights

Weights represent the relative importance of each commodity in the index. Heavier weights are given to items with a larger share in total expenditure or production. For instance, in a household index, food items may carry more weight than luxury goods. Assigning correct weights helps the index reflect real economic behavior. Weights can be based on surveys, national accounts, or expenditure studies. There are unweighted indices (equal importance to all items) and weighted indices (varying importance), with weighted indices offering greater precision and realism.

6. Selection of the Index Formula

Different formulas are used to calculate the index number. The most common are:

  • Laspeyres’ Index: Uses base year quantities as weights.

  • Paasche’s Index: Uses current year quantities.

  • Fisher’s Ideal Index: Geometric mean of Laspeyres and Paasche indices.

Each formula has its pros and cons. Laspeyres is easier to calculate but may overstate inflation, while Paasche may understate it. Fisher’s index balances both but is more complex. The choice depends on available data and desired accuracy. The selected formula must ensure consistency and logical interpretation.

7. Computation and Interpretation

Once the prices, quantities, weights, and formula are determined, the index number is computed. The resulting figure indicates the level of change compared to the base year. If the index is above 100, it shows a price rise; below 100 indicates a fall. The index is then interpreted in the context of economic conditions and published for use by policymakers, businesses, and researchers. Proper interpretation helps in understanding inflation trends, making wage adjustments, or planning fiscal and monetary policies effectively.

Simple Average or Price Relative Method, Weighted index method

Simple Average or Price Relatives Method

In this method, we find out the price relative of individual items and average out the individual values. Price relative refers to the percentage ratio of the value of a variable in the current year to its value in the year chosen as the base.

Price relative (R) = (P1÷P2) × 100

Here, P1= Current year value of item with respect to the variable and P2= Base year value of the item with respect to the variable. Effectively, the formula for index number according to this method is:

 P = ∑[(P1÷P2) × 100] ÷N

Here, N= Number of goods and P= Index number.

Weighted index method

Weighted Aggregate Method

Here different goods are assigned weight according to the quantity bought. There are three well-known sub-methods based on the different views of economists as mentioned below:

Laspeyre’s Method

Laspeyre was of the view that base year quantities must be chosen as weights. Therefore the formula is :

P = (∑P1Q0÷∑P0Q0)×100

Here,  ∑P1Q0= Summation of prices of current year multiplied by quantities of the base year taken as weights and ∑P0Q0= Summation of, prices of base year multiplied by quantities of the base year taken as weights.

Paasche Index Number

The Paasche Price Index is a consumer price index used to measure the change in the price and quantity of a basket of goods and services relative to a base year price and observation year quantity. Developed by German economist Hermann Paasche, the Paasche Price Index is commonly referred to as the “current weighted index.”

Formula for the Paasche Price Index

The formula for the index is as follows:

Where:

  • Pi,0 is the price of the individual item at the base period and Pi,t is the price of the individual item at the observation period.
  • Qi,t is the quantity of the individual item at the observation period.

Marshall Edgeworth Index Number

error: Content is protected !!