Standard deviation with co-efficient of Variance
18/04/2020As the name suggests, this quantity is a standard measure of the deviation of the entire data in any distribution. Usually represented by s or σ. It uses the arithmetic mean of the distribution as the reference point and normalizes the deviation of all the data values from this mean.
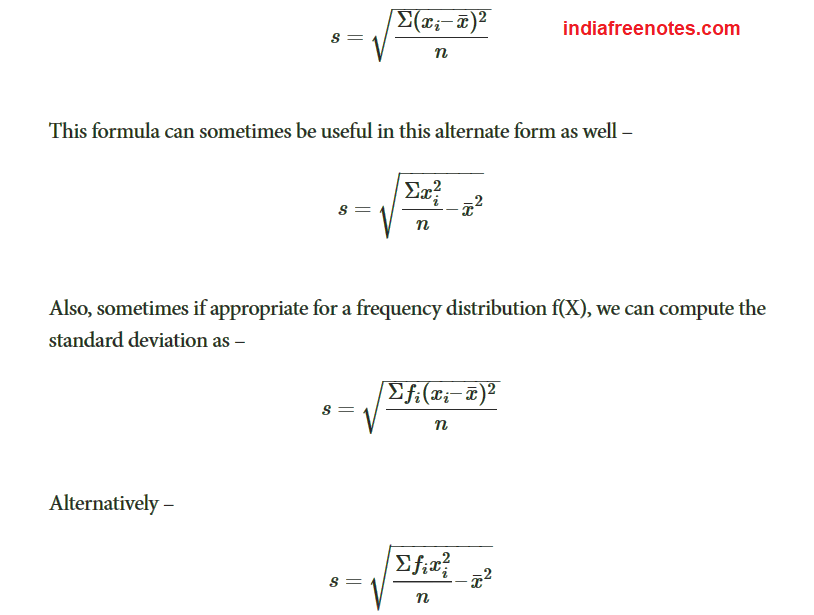
Therefore, we define the formula for the standard deviation of the distribution of a variable X with n data points as:

Variance
Another statistical term that is related to the distribution is the variance, which is the standard deviation squared (variance = SD² ). The SD may be either positive or negative in value because it is calculated as a square root, which can be either positive or negative. By squaring the SD, the problem of signs is eliminated. One common application of the variance is its use in the F-test to compare the variance of two methods and determine whether there is a statistically significant difference in the imprecision between the methods.
In many applications, however, the SD is often preferred because it is expressed in the same concentration units as the data. Using the SD, it is possible to predict the range of control values that should be observed if the method remains stable. As discussed in an earlier lesson, laboratorians often use the SD to impose “gates” on the expected normal distribution of control values.
Coefficient of Variation
Another way to describe the variation of a test is calculate the coefficient of variation, or CV. The CV expresses the variation as a percentage of the mean, and is calculated as follows:
CV% = (SD/Xbar)100
In the laboratory, the CV is preferred when the SD increases in proportion to concentration. For example, the data from a replication experiment may show an SD of 4 units at a concentration of 100 units and an SD of 8 units at a concentration of 200 units. The CVs are 4.0% at both levels and the CV is more useful than the SD for describing method performance at concentrations in between. However, not all tests will demonstrate imprecision that is constant in terms of CV. For some tests, the SD may be constant over the analytical range.
The CV also provides a general “feeling” about the performance of a method. CVs of 5% or less generally give us a feeling of good method performance, whereas CVs of 10% and higher sound bad. However, you should look carefully at the mean value before judging a CV. At very low concentrations, the CV may be high and at high concentrations the CV may be low. For example, a bilirubin test with an SD of 0.1 mg/dL at a mean value of 0.5 mg/dL has a CV of 20%, whereas an SD of 1.0 mg/dL at a concentration of 20 mg/dL corresponds to a CV of 5.0%.
[…] VIEW […]
[…] VIEW […]
[…] VIEW […]