Investors attitude towards Risk and Return

Investors’ Attitudes towards risk and return are foundational elements in the study and practice of finance, particularly in the realm of investment decisions. These attitudes significantly influence individual investment choices, portfolio construction, and risk management strategies. Understanding the nuanced relationship between risk and return and how different investors react to this dynamic is crucial for both personal finance and institutional investment management.

Risk-Return TradeOff

The risk-return trade-off is a fundamental principle in finance that asserts higher potential returns are associated with higher levels of risk. This means that to achieve greater returns on investments, investors must be willing to accept greater volatility and uncertainty in the performance of their investments. Conversely, lower-risk investments typically offer lower potential returns. The challenge for investors is to find the balance between risk and return that aligns with their financial goals, risk tolerance, and investment horizon.

Investors’ Risk Tolerance

Investors’ attitudes towards risk, or risk tolerance, can vary widely based on individual circumstances, preferences, and objectives. Risk tolerance is influenced by several factors:

  • Financial Goals:

The nature and timeframe of an investor’s financial objectives (e.g., saving for retirement, generating income, capital preservation) can significantly impact their willingness to take on risk.

  • Investment Horizon:

Longer investment horizons often allow investors to take on more risk, as there is more time to recover from potential market downturns.

  • Financial Situation:

An investor’s current and expected future financial situation, including income, wealth, and liabilities, affects their ability to absorb losses.

  • Past Experiences:

Personal experiences with investments, including losses or gains made during market fluctuations, can shape an investor’s risk perception and tolerance.

  • Psychological Factors:

Personality traits, such as propensity for risk-taking, fear of loss, and confidence in decision-making, also play roles in determining risk tolerance.

Adjusting Portfolios Based on Risk Tolerance

Based on their risk tolerance, investors might adopt different investment strategies and construct their portfolios accordingly:

  • Conservative (Low Risk-Tolerance):

Investors with low risk-tolerance or a need for capital preservation tend to favor safer investments, such as bonds, fixed deposits, and high-quality dividend-paying stocks. These investors prioritize the protection of capital over high returns.

  • Moderate (Medium Risk-Tolerance):

Investors comfortable with moderate levels of risk often build diversified portfolios that include a mix of equities, bonds, and other asset classes. This approach seeks to balance the potential for moderate growth with risk management.

  • Aggressive (High Risk-Tolerance):

High risk-tolerance investors aim for higher returns and are willing to accept significant volatility. Their portfolios may heavily feature stocks, including those of start-ups and growth-oriented companies, along with alternative investments and speculative assets.

Behavioral Finance

Behavioral finance studies how psychological influences and cognitive biases affect the financial behaviors of investors and financial practitioners. Key concepts include:

  • Overconfidence:

Overestimating one’s ability to predict market movements can lead to taking excessive risks.

  • Loss Aversion:

The fear of losses can cause investors to be overly conservative or to sell assets hastily during downturns.

  • Herd Behavior:

Following the investment choices of others without independent analysis can lead to suboptimal risk-taking.

Risk Preference of investors

Risk preference is a fundamental determinant of investment behavior, shaping individuals’ and organizations’ attitudes towards risk and influencing their investment decisions. By understanding their risk preferences, investors can construct portfolios that align with their financial goals, time horizon, and comfort level with uncertainty. Financial advisors and investment professionals play a vital role in assessing clients’ risk preferences, providing personalized advice, and helping clients navigate the complex landscape of risk and return. Ultimately, effective risk management requires a balanced approach that considers both the potential for returns and the tolerance for risk, ensuring investors can achieve their financial objectives while maintaining peace of mind.

Understanding risk preference is essential in finance and investment as it shapes individuals’ and organizations’ decisions regarding asset allocation, portfolio construction, and investment strategies. Risk preference refers to an individual’s or entity’s attitude towards risk, indicating their willingness to accept uncertainty and potential losses in pursuit of higher returns. Different investors have varying risk preferences influenced by factors such as financial goals, time horizon, wealth, personality traits, and past experiences.

Types of Risk Preference:

  • Risk-Averse:

Risk-averse investors prioritize capital preservation and prefer investments with lower volatility and assured returns, even if it means sacrificing potential gains. They tend to favor safer assets like bonds, fixed deposits, and blue-chip stocks, avoiding speculative or high-risk ventures.

  • RiskNeutral:

Risk-neutral investors are indifferent to risk and solely focus on maximizing expected returns. They are willing to accept any level of risk as long as the potential returns outweigh it. Their investment choices are guided by rational analysis of expected returns and probabilities, without being influenced by risk aversion or risk-seeking behavior.

  • Risk-Seeking (RiskLoving):

Risk-seeking investors are inclined towards investments with higher risk and volatility in pursuit of potentially higher returns. They are comfortable with uncertainty and view risk as an opportunity rather than a threat. Risk-seeking behavior is often associated with younger investors, entrepreneurs, and speculators.

Measurement of Risk Preference:

  1. Psychometric Tests:

Psychometric tests assess individual personality traits, attitudes, and behaviors towards risk. These tests measure risk preference indirectly by evaluating factors such as risk tolerance, loss aversion, and sensation-seeking tendencies.

  1. Questionnaires and Surveys:

Questionnaires and surveys are commonly used tools to gauge investors’ risk preferences. These instruments ask investors about their willingness to take risks, investment goals, time horizon, and past experiences to determine their risk tolerance levels.

  1. Investment Behavior Analysis:

Investment behavior analysis involves observing investors’ actual investment decisions, portfolio composition, and trading patterns to infer their risk preferences. This method provides insights into investors’ risk-taking behavior in real-world scenarios.

  1. Utility Theory:

Utility theory quantifies investors’ risk preferences by measuring their utility or satisfaction derived from various investment outcomes. By analyzing the trade-offs between risk and return, utility theory models investors’ risk preferences mathematically.

Factors Influencing Risk Preference:

  1. Financial Goals:

Investors’ risk preferences are influenced by their financial objectives, such as wealth accumulation, income generation, capital preservation, or funding retirement. Goals that require long-term growth may necessitate higher risk tolerance.

  1. Time Horizon:

The time horizon over which investors plan to hold investments affects their risk preference. Longer time horizons provide more opportunity to recover from short-term losses, allowing investors to tolerate higher risk.

  1. Wealth and Income Levels:

High-net-worth individuals and institutions may have higher risk tolerance due to their ability to absorb losses. Conversely, individuals with limited financial resources may exhibit more risk-averse behavior.

  1. Age and Life Stage:

Younger investors often have a higher risk appetite as they have more time to recover from losses and can afford to take on greater risk in pursuit of higher returns. As investors approach retirement, they tend to become more risk-averse to protect their accumulated wealth.

  1. Personality Traits:

Individual personality traits, such as optimism, overconfidence, fear of regret, and loss aversion, significantly influence risk preference. These traits shape investors’ perceptions of risk and their willingness to accept it.

  1. Past Experiences:

Previous investment experiences, successes, and failures play a crucial role in shaping investors’ risk preferences. Positive experiences may increase risk tolerance, while negative experiences can lead to risk aversion and loss aversion behavior.

Implications of Risk Preference in Investment Decision-Making:

  1. Asset Allocation:

Risk preference guides asset allocation decisions, determining the proportion of investments allocated to different asset classes such as stocks, bonds, real estate, and commodities. Risk-averse investors typically allocate more to safer assets, while risk-seeking investors may favor equities and alternative investments.

  1. Portfolio Construction:

Investors construct portfolios aligned with their risk preferences, diversifying across assets with varying risk-return profiles to achieve a balance between risk and return. Conservative portfolios may include more fixed-income securities, while aggressive portfolios may have higher allocations to equities and growth-oriented assets.

  1. Investment Strategy:

Risk preference influences investment strategies, including buy-and-hold, value investing, growth investing, and momentum trading. Risk-averse investors may prefer passive strategies with lower turnover, while risk-seeking investors may engage in active trading and speculative ventures.

  1. Risk Management:

Understanding risk preference is essential for effective risk management. Investors implement risk management techniques such as stop-loss orders, hedging strategies, and diversification to mitigate risk exposure and protect against adverse market movements.

  1. Financial Planning:

Financial advisors consider clients’ risk preferences when developing personalized financial plans, ensuring investments align with clients’ goals, time horizon, and risk tolerance. This helps manage expectations and reduces the likelihood of investor dissatisfaction or panic during market downturns.

Meaning of Return, Measures of Return, Holding period of Return, Annualized return, Expected Return

Return in finance refers to the profit or loss generated on an investment over a specific period, typically expressed as a percentage of the initial investment amount. It represents the financial gains or losses an investor realizes from their investment activity and is a key measure of investment performance. Understanding the concept of return is essential for investors as it helps assess the effectiveness of investment decisions, evaluate the performance of investment portfolios, and make informed decisions about future investment opportunities.

Returns can be classified into two main categories: absolute returns and relative returns.

  1. Absolute Returns:

Absolute returns measure the actual monetary gain or loss generated by an investment over a specific period. It represents the difference between the final value of the investment and its initial cost, irrespective of external factors. Absolute returns provide a clear picture of the profitability of an investment and are expressed in terms of currency units (e.g., dollars, euros).

  1. Relative Returns:

Relative returns compare the performance of an investment against a benchmark or a reference index. It assesses how well an investment has performed relative to a standard measure of performance. Relative returns are particularly useful for evaluating the performance of actively managed investment portfolios compared to a passive benchmark. They provide insights into whether an investment has outperformed or underperformed the market or a specific asset class.

Returns can be generated from various sources:

  • Capital Appreciation:

Capital appreciation occurs when the market value of an investment increases over time, resulting in a profit when the investment is sold at a higher price than its purchase price.

  • Income Generation:

Income generation involves earning periodic payments from an investment, such as interest, dividends, or rental income. These payments contribute to the overall return generated by the investment.

  • Dividend Reinvestment:

Dividend reinvestment involves using dividends received from an investment to purchase additional shares or units of the same investment, thereby increasing the potential for future returns through compounded growth.

Measures of Return

Types off Risk, Measuring Risk

Risk in the context of finance and investment, refers to the uncertainty regarding the financial returns or outcomes of an investment, and the potential for an investor to experience losses or gains different from what was initially expected. It is a fundamental concept that underpins nearly all financial decisions and strategies. The essence of risk is the variability of returns, which can be influenced by a myriad of factors, including economic changes, market volatility, political instability, and specific events affecting individual companies or industries.

  1. Market Risk (Systematic Risk)

Market risk, also known as systematic risk, encompasses the risk inherent to the entire market or market segment. It is the uncertainty that any financial instrument might face due to fluctuations in market variables such as interest rates, foreign exchange rates, stock prices, and commodity prices. Market risk cannot be eliminated through diversification because it affects all investments to some degree. This type of risk is influenced by geopolitical events, economic recessions, and changes in fiscal policy. Investors manage market risk through hedging strategies and asset allocation.

  1. Credit Risk (Default Risk)

Credit risk, or default risk, refers to the possibility that a borrower will fail to meet their obligations in accordance with agreed terms. This risk is of particular concern to lenders, bondholders, and creditors. Credit risk assessment models evaluate the likelihood of default. To mitigate credit risk, lenders often require collateral or use credit derivatives and diversify their lending portfolio across various sectors and borrowers.

  1. Liquidity Risk

Liquidity risk involves the risk that an entity will not be able to meet its short-term financial obligations due to the inability to convert assets into cash without significant loss. It affects both individuals and institutions and can be subdivided into asset liquidity risk and funding liquidity risk. Asset liquidity risk is the difficulty in selling assets quickly at their fair value, while funding liquidity risk relates to the challenge in obtaining funds to meet obligations. Management strategies include maintaining adequate cash reserves and having access to reliable funding sources.

  1. Operational Risk

Operational risk is associated with failures in internal processes, people, and systems, or from external events. This includes everything from business disruptions, system failures, fraud, and cyberattacks to legal risks and natural disasters. Unlike market or credit risk, operational risk is more difficult to quantify and manage because it encompasses a wide range of unpredictable factors. Organizations address operational risk through robust internal controls, continuous monitoring, and having effective disaster recovery and business continuity plans.

  1. Country and Political Risk

Country risk involves the uncertainties that international investing brings, including economic, political, and social instability in the country where the investment is made. Political risk refers more specifically to the risk of loss from changes in government policy, expropriation of assets, and civil unrest. These risks can affect the overall investment climate and specific asset values. Investors mitigate these risks through geopolitical analysis, diversification, and sometimes, by purchasing political risk insurance.

  1. Interest Rate Risk

Interest rate risk is the risk that an investment’s value will change due to a change in the absolute level of interest rates, in the spread between two rates, in the shape of the yield curve, or in any other interest rate relationship. This type of risk particularly affects bonds, as their prices are inversely related to interest rates. Managing interest rate risk involves adjusting portfolio duration, diversifying across different types of rates, and using interest rate derivatives.

Measuring Risk

FN2 Security Analysis and Portfolio Management Bangalore University BBA 6th Semester NEP Notes

Unit 1 [Book]
Investments Introduction VIEW
Investment Process VIEW
Criteria for Investment VIEW
Types of Investors VIEW
Investment, Speculation and Gambling VIEW
Elements of Investment VIEW
Investment Avenues VIEW
Factors influencing Selection of Investment alternatives VIEW
Security Market Introduction, Functions VIEW
Secondary Market Operations VIEW
Stock Exchanges in India VIEW
Security Exchange Board of India VIEW
Government Securities Market VIEW
Corporate Debt Market VIEW
Money Market Instruments VIEW


Unit 2 Risk-Return Relationship [Book]
Risk-Return Relationship VIEW
Meaning of Risk VIEW
Types off Risk, Measuring Risk VIEW
Risk Preference of investors VIEW
Meaning of Return, Measures of Return, Holding period of Return, Annualized return, Expected Return VIEW
Investors attitude towards Risk and Return VIEW


Unit 3 Fundamental Analysis and Technical Analysis [Book]
Introduction, Investment Analysis VIEW
Fundamental Analysis VIEW
Macro-Economic Analysis VIEW
Industry Analysis VIEW
Company Analysis VIEW
Trend Analysis VIEW
Ratio Analysis VIEW


Unit 4 Technical Analysis [Book]
Technical Analysis VIEW
Fundamental Analysis Vs. Technical Analysis VIEW
Charting Techniques VIEW
Technical Indicators VIEW
Testing Technical Trading Rules VIEW
Evaluation of Technical Analysis VIEW


Unit 5 Portfolio Management [Book]
Portfolio Management, Framework, Portfolio Analysis, Selection and Evaluation, Meaning of portfolio, Reasons to hold Portfolio Diversification analysis VIEW
Markowitz’s Model, Assumptions, Specific model VIEW
Risk and Return Optimization VIEW
Efficient Frontier VIEW
Efficient Portfolios VIEW
Leveraged Portfolios VIEW
Corner Portfolios VIEW
Sharpe’s Single Index Model VIEW
Portfolio evaluation Measures VIEW
Sharpe’s Performance Index VIEW
Treynor’s Performance Index VIEW
Jensen’s Performance Index VIEW

Frequency Distribution, Meaning, Principles, Types, Steps and Advantages

Frequency distribution is a systematic arrangement of data showing the number of times each value or group of values occurs in a dataset. It is one of the most important methods of organizing statistical data. Frequency distribution simplifies a large volume of raw data by grouping observations into classes and showing their respective frequencies. This makes the data easier to understand, analyze, and interpret.

The construction of a frequency distribution involves arranging data into class intervals and recording the number of observations falling within each interval.

Principles for Constructing Frequency Distribution

1. Principle of Clearly Defined Class Intervals

Class intervals should be clearly defined so that every observation can be placed in the correct class without confusion. Ambiguous or overlapping class limits may lead to incorrect classification and inaccurate results. Clear intervals improve the reliability and usefulness of the frequency distribution. The lower and upper limits of each class should be specified precisely. Readers should easily understand the scope of every class interval. Well-defined classes ensure consistency in data organization and make statistical analysis more accurate. Therefore, clarity in class interval definition is a fundamental principle of constructing an effective frequency distribution.

2. Principle of Mutual Exclusiveness

The classes in a frequency distribution should be mutually exclusive. This means that an observation must belong to only one class and not fit into multiple classes simultaneously. Overlapping class intervals create confusion and may result in double counting. For example, intervals such as 10–20 and 20–30 can create ambiguity regarding the value 20. To avoid this problem, class limits should be designed carefully. Mutual exclusiveness ensures accuracy and consistency in classification. It allows each observation to be counted only once, thereby improving the reliability of the frequency distribution.

3. Principle of Continuity

Class intervals should be continuous without gaps between successive classes. Every possible observation within the range of data should have a place in the distribution. Continuous classes ensure smooth classification and prevent the omission of observations. If gaps exist between intervals, some values may remain unclassified, reducing the completeness of the distribution. Continuous class intervals are especially important in grouped frequency distributions involving measurable variables. By maintaining continuity, statisticians can ensure that all data values are represented properly and that the frequency distribution provides a complete picture of the dataset.

4. Principle of Exhaustiveness

A frequency distribution should be exhaustive, meaning that it must include all observations in the dataset. Every data value should fit into one of the class intervals. No observation should be left out of the distribution. Exhaustiveness ensures completeness and accuracy in data presentation. If certain observations remain unclassified, the frequency totals will not match the total number of observations collected. This can lead to incorrect conclusions and statistical errors. Therefore, class intervals should be designed in such a way that they cover the entire range of data and accommodate every observation.

5. Principle of Appropriate Number of Classes

The number of classes should be chosen carefully. Too many classes make the frequency distribution lengthy and complicated, while too few classes may hide important details and variations. A reasonable number of classes provides a balance between simplicity and completeness. Generally, frequency distributions contain between five and fifteen classes, depending on the size of the dataset. The objective is to present information clearly without losing significant details. Proper selection of the number of classes improves readability, facilitates analysis, and ensures that the distribution effectively summarizes the data.

6. Principle of Suitable Class Width

Class width refers to the size of each class interval. The width should be neither too large nor too small. Very wide intervals may conceal important variations within the data, while very narrow intervals may create an excessive number of classes and make the table difficult to interpret. Uniform class widths are generally preferred because they simplify analysis and comparison. Appropriate class width ensures meaningful grouping of observations and enhances the usefulness of the frequency distribution. Therefore, selecting a suitable class width is essential for effective data presentation and statistical interpretation.

7. Principle of Simplicity and Clarity

A frequency distribution should be simple and easy to understand. The arrangement of class intervals and frequencies should be logical and straightforward. Complex classifications and unnecessary details should be avoided because they may confuse readers. Simplicity improves readability and allows users to interpret the information quickly. Clear headings, properly arranged classes, and accurate frequencies contribute to effective communication. A simple frequency distribution is more useful for statistical analysis and decision-making. Therefore, maintaining simplicity and clarity is an important principle in the construction of frequency distributions.

8. Principle of Accuracy

Accuracy is one of the most important principles in constructing a frequency distribution. Frequencies must be counted carefully, and observations should be classified correctly. Errors in tallying, counting, or classifying data can distort the distribution and lead to incorrect statistical analysis. Every step, from data collection to frequency calculation, should be performed with precision. Accurate frequency distributions provide reliable information for research, business analysis, and decision-making. Since statistical conclusions depend on the correctness of the data presented, maintaining accuracy is essential for ensuring the credibility and usefulness of the frequency distribution.

Types of Frequency Distribution

1. Simple Frequency Distribution

Simple frequency distribution is the most basic type of frequency distribution. It presents each value of a variable along with the number of times it occurs in the dataset. This method is suitable when the data contains a limited number of distinct values. It helps organize raw data into a concise and understandable form. Simple frequency distribution is widely used in educational and business studies to summarize information efficiently. It allows researchers to identify the occurrence of each value and understand the overall distribution of observations without dealing with complex classifications.

Example:

Number of Defects Frequency
0 5
1 8
2 6
3 4
4 2

2. Grouped Frequency Distribution

Grouped frequency distribution arranges data into class intervals and records the frequency of observations within each interval. This type is used when the dataset contains a large number of observations or continuous values. Grouping reduces complexity and makes data easier to analyze. It helps identify trends, patterns, and concentration of observations. Grouped frequency distributions are commonly used in business, economics, and research studies. By organizing data into intervals, they provide a compact summary of large datasets and facilitate statistical calculations such as averages and measures of dispersion.

Example:

Marks Frequency
0–10 4
10–20 8
20–30 12
30–40 10
40–50 6

3. Ungrouped Frequency Distribution

An ungrouped frequency distribution lists every individual value separately along with its frequency. Unlike grouped distributions, no class intervals are used. This type is suitable for small datasets where observations can be displayed individually without making the table lengthy. Ungrouped frequency distributions provide exact information about each value and its occurrence. They are useful in situations where detailed analysis of individual observations is required. However, they become less practical when the dataset is large. Therefore, they are generally applied in small-scale studies and introductory statistical exercises.

Example:

Number of Books Sold Frequency
5 2
6 4
7 5
8 3
9 1

4. Cumulative Frequency Distribution

Cumulative frequency distribution shows the running total of frequencies. Instead of presenting individual frequencies alone, it accumulates frequencies from one class to the next. This type helps determine the number of observations below or above a particular value. Cumulative frequency distributions are useful for calculating median, quartiles, percentiles, and for constructing ogives. They provide insights into the cumulative position of observations within the dataset. There are two forms: less-than cumulative frequency and more-than cumulative frequency distributions.

Example (Less Than Type):

Marks Less Than Cumulative Frequency
10 4
20 12
30 24
40 34
50 40

5. Relative Frequency Distribution

Relative frequency distribution expresses frequencies as fractions or proportions of the total number of observations. It shows the relative importance of each class within the dataset. Relative frequencies are calculated by dividing class frequencies by the total frequency. This distribution helps compare different datasets, especially when they differ in size. It provides a clearer understanding of the proportion represented by each category. Relative frequency distributions are widely used in market research, quality control, and business analysis where percentage comparisons are important.

Example:

Product Type Frequency Relative Frequency
A 20 0.40
B 15 0.30
C 10 0.20
D 5 0.10

Total Frequency = 50

6. Percentage Frequency Distribution

A percentage frequency distribution is similar to a relative frequency distribution, but frequencies are expressed as percentages rather than proportions. This format is easy to understand and interpret because percentages are familiar to most users. It helps compare categories effectively and is widely used in business reports, surveys, and demographic studies. Percentage frequency distributions simplify communication and make statistical findings more accessible. They are particularly useful when presenting data to audiences who may not have extensive statistical knowledge.

Example:

Customer Preference Frequency Percentage
Product A 40 40%
Product B 30 30%
Product C 20 20%
Product D 10 10%

7. Discrete Frequency Distribution

Discrete frequency distribution is used for variables that take distinct and countable values. Each value is listed separately along with its corresponding frequency. Examples include the number of employees, number of children, number of products sold, or number of defects. Since discrete variables cannot take fractional values, frequencies are assigned to individual observations. This distribution provides precise information and helps analyze count-based data. It is commonly used in business operations, production management, and social science research where variables are measured in whole numbers.

Example:

Number of Children Frequency
1 6
2 10
3 8
4 4
5 2

8. Continuous Frequency Distribution

Continuous frequency distribution is used for variables that can take any value within a specified range. Data is grouped into continuous class intervals, and frequencies are recorded for each interval. Examples include age, income, height, weight, and sales revenue. This type of distribution is suitable for large datasets involving measurable quantities. Continuous frequency distributions simplify complex information and facilitate statistical analysis. They are also essential for constructing histograms, frequency polygons, and other graphical representations used in business and research.

Example:

Income (₹) Frequency
0–10,000 5
10,000–20,000 12
20,000–30,000 18
30,000–40,000 10
40,000–50,000 5

Steps in the Construction of Frequency Distribution

Step 1. Collection of Raw Data

The first step in constructing a frequency distribution is the collection of raw data. Raw data refers to the original facts and figures gathered from surveys, observations, experiments, questionnaires, or records. At this stage, the information is usually unorganized and arranged randomly. Since raw data is difficult to analyze directly, it must first be collected accurately and systematically. The quality of the frequency distribution depends on the reliability of the collected data. Any errors during collection may affect the final results. Therefore, proper collection of data is essential for meaningful statistical analysis and interpretation.

Example: Marks of 15 students:

25, 30, 45, 50, 35, 40, 55, 60, 65, 70, 75, 80, 45, 50, 55

Step 2. Determination of Range

After collecting the raw data, the next step is determining the range. The range measures the spread of the data and is calculated by subtracting the smallest value from the largest value. It helps in deciding suitable class intervals and class widths. A larger range generally requires more classes, whereas a smaller range may require fewer classes. Determining the range gives a preliminary understanding of data distribution and assists in organizing observations effectively. It is an important step because the entire frequency distribution is based on the extent of variation present in the dataset.

Formula: Range = Highest Value − Lowest Value

Example:

Highest value = 80

Lowest value = 25

Range = 80 − 25 = 55

Step 3. Determination of Number of Classes

The third step involves deciding the number of class intervals into which the data will be grouped. The number of classes should be reasonable because too many classes make the table complex, while too few classes may hide important information. Generally, between 5 and 15 classes are used depending on the size of the dataset. Statisticians often use Sturges’ Formula to determine an appropriate number of classes. Proper selection of classes improves clarity, comparability, and usefulness of the frequency distribution. This step ensures that the data is grouped in a balanced and meaningful manner.

Formula: k = 1 + 3.322 log N

Where:

k = Number of classes

N = Total observations

Example:

If N = 50,

k = 1 + 3.322 log (50)

k ≈ 7 classes

Step 4. Calculation of Class Width

Class width refers to the size of each class interval. After determining the range and number of classes, the class width is calculated by dividing the range by the number of classes. The result is generally rounded to a convenient whole number. Appropriate class width is important because very narrow intervals create too many classes, while very wide intervals may hide significant variations. A suitable class width ensures that the frequency distribution remains clear, balanced, and informative. This step provides the basis for creating meaningful class intervals that adequately represent the data.

Formula: Class Width = Range ÷ Number of Classes

Example:

Range = 55

Number of Classes = 6

Class Width = 55 ÷ 6 ≈ 9.17

Rounded Class Width = 10

Step 5. Formation of Class Intervals

Once the class width is determined, class intervals are formed. Class intervals are groups into which observations are categorized. These intervals should be mutually exclusive, continuous, and exhaustive. Every observation should belong to one and only one class. Properly formed intervals make the frequency distribution easier to understand and analyze. The intervals may follow the inclusive or exclusive method depending on the nature of the data. The formation of suitable class intervals is crucial because it directly affects the accuracy and usefulness of the frequency distribution.

Example:

Class Interval
20–29
30–39
40–49
50–59
60–69
70–79
80–89

These intervals cover all observations and maintain equal width.

Step 6. Tallying the Observations

After forming class intervals, each observation is examined and placed into its appropriate class using tally marks. Tally marks are simple counting symbols used to record frequencies accurately. Every observation falling within a class interval is represented by a tally mark. Groups of five tally marks are usually shown with the fifth mark crossing the previous four. Tallying helps avoid counting errors and provides an easy method of organizing observations before calculating frequencies. This step acts as a bridge between raw data and frequency counting, ensuring accuracy and completeness in the frequency distribution process.

Example:

Class Interval Tally Marks
20–29 |
30–39 ||
40–49 |||
50–59 ||||
60–69 |||
70–79 ||
80–89 |

Step 7. Counting Frequencies

Once tallying is completed, the tally marks in each class interval are counted to determine the frequency. Frequency refers to the number of observations that fall within a particular class. This step converts tally marks into numerical values and provides a summarized picture of the data. Accurate frequency counting is essential because it forms the basis for statistical analysis, graphs, and interpretation. Frequencies reveal how data is distributed across different classes and help identify concentration, patterns, and trends. This step transforms raw observations into meaningful statistical information.

Example:

Class Interval Frequency
20–29 1
30–39 2
40–49 3
50–59 4
60–69 3
70–79 2
80–89 1

Step 8. Preparation of the Final Frequency Distribution Table

The final step is preparing the frequency distribution table. In this table, class intervals and their corresponding frequencies are arranged systematically. The table should include a suitable title, properly labeled columns, and accurate totals. It provides a concise summary of the entire dataset and serves as the basis for further statistical analysis and graphical presentation. A well-prepared frequency distribution table helps readers understand data patterns quickly and facilitates interpretation. This final presentation converts scattered raw data into an organized and meaningful statistical form suitable for business and research purposes.

Example: Frequency Distribution of Students’ Marks

Marks Frequency
20–29 1
30–39 2
40–49 3
50–59 4
60–69 3
70–79 2
80–89 1
Total 16

This table clearly summarizes the distribution of marks and makes analysis simple and effective.

Advantages of Frequency Distribution

  • Simplifies Large Volumes of Data

One of the greatest advantages of frequency distribution is that it simplifies large and complex datasets. Raw data often contains numerous observations that are difficult to understand and analyze. Frequency distribution organizes this information into classes and frequencies, making it more manageable and meaningful. Instead of examining each individual observation, users can study summarized information. This saves effort and improves understanding. By presenting data in a structured form, frequency distribution enables researchers, managers, and students to grasp the overall nature of the dataset quickly and efficiently without being overwhelmed by excessive details.

  • Facilitates Statistical Analysis

Frequency distribution provides a strong foundation for statistical analysis. Various statistical measures such as mean, median, mode, standard deviation, and variance can be calculated more easily when data is organized into a frequency distribution. The arrangement of observations into classes simplifies computations and reduces complexity. Researchers can identify patterns and relationships more effectively. Without frequency distribution, statistical calculations involving large datasets would be cumbersome and time-consuming. Therefore, frequency distribution serves as an essential tool for conducting accurate and efficient statistical analysis in business, economics, and research studies.

  • Improves Understanding of Data

Frequency distribution enhances the understanding of data by presenting information in a clear and organized manner. Raw data often appears confusing because observations are scattered randomly. By grouping similar observations into classes, frequency distribution provides a concise summary of the dataset. Readers can quickly understand how data is distributed and where observations are concentrated. This organized presentation improves comprehension and reduces the possibility of misunderstanding. As a result, students, researchers, and decision-makers can interpret information more effectively and draw meaningful conclusions from the data presented.

  • Reveals Patterns and Trends

A frequency distribution helps identify patterns, trends, and characteristics within the data. It shows how observations are distributed across different classes, making it easier to detect concentrations, gaps, and variations. Researchers can observe whether data is evenly distributed or clustered around certain values. Trends that may not be visible in raw data become more apparent through frequency distribution. This advantage is particularly useful in business forecasting, market research, and performance evaluation. By revealing important patterns, frequency distributions assist organizations in understanding situations and making informed decisions based on statistical evidence.

  • Facilitates Comparison

Frequency distribution makes comparison easier by presenting data in a structured format. Different groups, categories, or datasets can be compared by examining their frequencies. For example, sales performance across regions or customer age groups can be compared effectively using frequency distributions. Comparisons help identify similarities, differences, strengths, and weaknesses. Such information is valuable for business planning and evaluation. Without organized frequency data, comparisons would require examining individual observations, which is both difficult and time-consuming. Therefore, the comparative advantage of frequency distribution significantly enhances its usefulness in statistical studies.

  • Supports Graphical Presentation

Frequency distribution serves as the basis for various graphical presentations such as histograms, frequency polygons, ogives, and bar charts. Graphs require organized frequency data for accurate construction. By summarizing observations into class intervals and frequencies, frequency distributions provide the necessary information for visual representation. Graphical presentations make data more attractive, understandable, and accessible to a wider audience. Visual displays also help identify patterns and trends quickly. Therefore, frequency distribution plays a vital role in transforming numerical information into graphical forms that facilitate effective communication and interpretation.

  • Saves Time and Space

Another important advantage of frequency distribution is that it saves both time and space. Large datasets can be summarized in a compact table instead of presenting every individual observation. This reduces the amount of space required for data presentation and makes information easier to handle. Analysts and decision-makers can quickly review summarized data rather than spending time examining extensive raw information. The concise nature of frequency distributions improves efficiency and productivity. Consequently, they are widely used in business reports, research studies, and statistical publications where clear and economical presentation is essential.

  • Assists Decision-Making

Frequency distribution provides valuable information for decision-making by presenting data in a clear and meaningful form. Managers, researchers, and policymakers can use frequency distributions to evaluate performance, identify trends, and assess alternatives. Organized data enables them to understand situations accurately and make informed decisions. For example, businesses can analyze customer preferences, sales patterns, and production levels through frequency distributions. Reliable statistical information reduces uncertainty and improves planning. Therefore, frequency distribution is an important tool that supports effective decision-making and contributes to the success of business and research activities.

Key difference between Fundamental Analysis and Technical Analysis

Fundamental Analysis

Fundamental analysis is a method of evaluating a security in an attempt to measure its intrinsic value, by examining related economic, financial, and other qualitative and quantitative factors. Fundamental analysts study anything that can affect the security’s value, from macroeconomic factors such as the state of the economy and industry conditions to microeconomic factors like the effectiveness of the company’s management. The goal is to produce a value that an investor can compare with the security’s current price, aiming to figure out what position to take with that security (underpriced = buy, overpriced = sell or short). This method of analysis is considered to be the opposite of technical analysis, which forecasts the direction of prices through the analysis of historical market data, such as price and volume.

Fundamental Analysis Features:

  • Holistic Approach:

Fundamental analysis takes a comprehensive approach, considering financial, economic, industry, and company-specific factors. It looks at the broader picture and drills down to the specifics of individual companies.

  • Financial Statement Analysis:

A core component involves analyzing a company’s financial statements – balance sheet, income statement, and cash flow statement – to assess its financial health and operational efficiency.

  • Valuation Metrics:

It involves the use of various valuation metrics and ratios such as Price-to-Earnings (P/E) ratio, Price-to-Book (P/B) ratio, Dividend Yield, Return on Equity (ROE), and many others to determine whether a security is undervalued or overvalued compared to its current market price.

  • Economic Indicators:

Fundamental analysis also looks at economic indicators such as GDP growth rates, unemployment rates, inflation rates, and interest rates, as these can have a significant impact on the market’s overall direction and on specific sectors.

  • Sector and Industry Analysis:

Besides looking at individual companies, fundamental analysis also involves evaluating the health and prospects of the sector or industry in which the company operates. This includes considering the competitive landscape, regulatory environment, and any sector-specific risks.

  • Long-Term Orientation:

Fundamental analysis is typically more concerned with long-term investment opportunities. The goal is to identify companies that are undervalued by the market but have the potential for growth over time.

  • Qualitative Factors:

It’s not all about the numbers. Fundamental analysis also considers qualitative factors such as company management, brand strength, patents, and proprietary technology, which can influence a company’s long-term success.

  • Risk Assessment:

Fundamental analysis involves assessing the various risks that could impact the company’s ability to generate future cash flows and affect its overall valuation.

  • Macro and Micro Economic Factors:

It encompasses both macroeconomic factors (like economic cycles and monetary policy) and microeconomic factors (such as company-specific news and events), providing a thorough basis for making investment decisions.

  • Investment Decision Making:

The ultimate goal of fundamental analysis is to produce a value that investors can compare with the security’s current price, with the aim of figuring out what to buy/sell and when. This analysis forms the foundation for making informed investment decisions.

Technical Analysis

Technical analysis is a trading discipline employed to evaluate investments and identify trading opportunities by analyzing statistical trends gathered from trading activity, such as price movement and volume. Unlike fundamental analysis, which attempts to evaluate a security’s value based on business results such as sales and earnings, technical analysis focuses on the study of price and volume. Technical analysts believe past trading activity and price changes of a security are better indicators of the security’s likely future price movements than the intrinsic value. They use charts and other tools to identify patterns that can suggest future activity. Technical analysis can be used on any security with historical trading data. This includes stocks, futures, commodities, fixed-income, currencies, and other securities.

Technical Analysis Features:

  • Market Price Focus:

Technical analysis primarily focuses on the analysis of price movements and volume rather than the intrinsic value of securities. The core assumption is that all known information is already reflected in prices.

  • Charts and Graphs:

It heavily relies on charts and graphs to visually represent price movements over time. These graphical representations help traders identify patterns and trends that can suggest future activity.

  • Trends and Patterns:

Technical analysts believe that prices move in trends and that history tends to repeat itself. Identifying these trends and patterns forms the basis of making trading decisions.

  • Technical Indicators:

Various technical indicators and mathematical calculations are used, such as moving averages, Relative Strength Index (RSI), MACD (Moving Average Convergence Divergence), and Bollinger Bands, to predict future price movements.

  • Price Movements are not Random:

Technical analysis operates under the assumption that price movements are not random and that they follow trends that can be identified and exploited.

  • Supply and Demand:

It assesses the balance of supply and demand by analyzing buying and selling activity, under the belief that changes in supply and demand can lead to shifts in price trends.

  • Short-Term Trading Focus:

While it can be used for long-term analysis, technical analysis is often associated with short-term trading and is popular among day traders and swing traders.

  • Psychological and Market Sentiment:

Technical analysis also considers trader psychology and market sentiment, which can be inferred from price movements and volume changes.

  • SelfFulfilling Prophecy:

Some argue that technical analysis can work because it becomes a self-fulfilling prophecy; when enough traders believe in a pattern or indicator and act accordingly, their collective actions can move the market.

  • Flexibility Across Markets:

Technical analysis can be applied across different markets (stocks, forex, commodities) and instruments, making it a versatile tool for traders.

  • Independence from Financials:

Unlike fundamental analysis, which delves into financial statements and economic indicators, technical analysis can be applied without regard to the financial health of the market or its components.

  • Risk Management:

Technical analysis includes tools for risk management, such as stop-loss orders and position sizing, based on technical indicators and price levels.

Key differences between Fundamental Analysis and Technical Analysis:

Basis of Comparison Fundamental Analysis Technical Analysis
Objective Evaluate intrinsic value Predict price trends
Approach Qualitative & quantitative Statistical & chart-based
Data Used Economic, financial, company Price, volume, charts
Time Frame Long-term investment Short-term trading
Focus Value of asset Price movement, patterns
Tools Financial statements, ratios Charts, indicators
Key Factors Earnings, GDP, industry Price trends, volume
Philosophy Buy and hold Timing the market
Analysis Type Bottom-up or top-down Market trends
Market Sentiment Less considered Highly considered
Skill Set Economic, financial analysis Statistical, pattern recognition
Predictive Value Intrinsic value estimation Price movement anticipation

Fundamental Analysis, Components, Types, Impact, Limitations

Fundamental analysis is a cornerstone of investing. It’s a method used to determine the intrinsic value of a security, with the aim of assessing its actual worth based on various economic, financial, and other qualitative and quantitative factors.

Understanding Fundamental Analysis

At its core, fundamental analysis seeks to ascertain the true value of an investment, stripping away the noise and fluctuations of market prices to focus on underlying factors that influence a company’s future prospects. This involves a deep dive into financial statements, market position, industry health, economic indicators, and even geopolitical events. By evaluating all these aspects, investors aim to make predictions about future price movements and investment potential.

Key Components of Fundamental Analysis

  1. Economic Analysis

The process begins with a macroeconomic analysis, examining overall economic indicators like GDP growth rates, unemployment levels, inflation, interest rates, and monetary policies. These factors offer insights into the economic environment in which businesses operate, affecting consumer spending, borrowing costs, and investment returns.

  1. Industry Analysis

The next step involves analyzing the specific industry in which the company operates. This includes understanding the industry’s growth potential, competitive landscape, regulatory environment, and technological advancements. The goal is to identify industries with high growth prospects and understand where a company stands within its industry.

  1. Company Analysis

This is the crux of fundamental analysis, focusing on a thorough examination of the company itself. It involves:

  • Financial Statement Analysis: Reviewing the company’s balance sheet, income statement, and cash flow statement to assess its financial health, profitability, liquidity, and operational efficiency.
  • Ratio Analysis: Using key financial ratios like the price-to-earnings (P/E) ratio, debt-to-equity ratio, return on equity (ROE), and others to compare a company’s performance against its peers and industry averages.
  • Management and Governance: Evaluating the company’s leadership, strategic direction, corporate governance practices, and any competitive advantages.
  1. Valuation

Finally, various valuation models are applied to estimate the intrinsic value of the security. Common models include the Discounted Cash Flow (DCF) analysis, Dividend Discount Model (DDM), and relative valuation techniques like comparable company analysis. The goal is to determine a fair value for the security, which investors can compare against the current market price to make buy, hold, or sell decisions.

Types of Fundamental Analysis:

  1. Top-Down Analysis

Top-down analysis starts with the big picture and works its way down to individual stocks. It begins by analyzing global economic indicators and trends to identify which economies are currently strong or showing signs of growth. From there, the analysis narrows down to sectors and industries within those economies that are expected to outperform. The final step in a top-down analysis is to identify companies within those sectors that are believed to have the best growth prospects. This approach is useful for investors looking to allocate their investments across regions and sectors strategically.

Steps in Top-Down Analysis:

  1. Global Economy Analysis: Evaluates global economic conditions, including growth rates, inflation, interest rates, and geopolitical factors.
  2. Country Analysis: Focuses on economic conditions, monetary policies, and political stability within specific countries.
  3. Sector/Industry Analysis: Identifies sectors and industries expected to benefit from current economic conditions.
  4. Company Analysis: Selects companies within those sectors that have strong fundamentals.

2. Bottom-Up Analysis

In contrast to the top-down approach, bottom-up analysis ignores macroeconomic factors and focuses solely on the analysis of individual companies. Analysts using this method look for companies with strong fundamentals regardless of their industry or the overall economy. This approach involves a deep dive into a company’s financial statements, management effectiveness, product offerings, and market position to determine its intrinsic value. Investors who use the bottom-up approach believe that good companies can outperform, even in struggling industries or economies.

Steps in Bottom-Up Analysis:

  1. Company Financial Health: Examination of financial statements, revenue, profit margins, return on equity, and other financial ratios.
  2. Management Quality: Assessment of the company’s leadership effectiveness and corporate governance practices.
  3. Competitive Position: Analysis of the company’s market share, competitive advantages, and industry position.
  4. Growth Potential: Evaluation of the company’s future growth prospects in terms of revenue, earnings, and expansion opportunities.

3. Hybrid Approach

Some investors use a hybrid approach that combines elements of both top-down and bottom-up analysis. This method allows investors to consider macroeconomic and sectoral trends while also focusing on the fundamentals and performance of individual companies. By integrating both approaches, investors can make more informed decisions by balancing broader economic perspectives with detailed company analysis.

Top-down Fundamental vs. Bottom-up Fundamental analysis

Basis of Comparison Top-Down Analysis Bottom-Up Analysis
Starting Point Global economy Individual companies
Focus Macro factors Company fundamentals
Scope Broad Narrow
Investment Selection Sector before stock Stock first
Research Emphasis Economic indicators Financial statements
Market View General to specific Specific to general
Decision Criteria Economic trends Company performance
Ideal Market Condition Volatile markets Stable or growing markets
Suitability Strategic asset allocation Picking undervalued stocks
Time Horizon Long-term Varies
Risk Diversification effect Focus on single stocks
Adaptability Global changes Specific opportunities

Impact of Fundamental Analysis:

  • Investment Decision-Making

Fundamental analysis serves as a vital tool for investors aiming to make long-term investment decisions. By focusing on intrinsic value, investors can identify undervalued stocks that offer growth potential or overvalued stocks that pose a risk. This method supports a buy-and-hold strategy, as the analysis is predicated on the belief that the market will eventually recognize and correct mispricings.

  • Risk Management

Understanding a company’s fundamentals helps investors assess the risk associated with an investment. A strong balance sheet, consistent earnings growth, and a solid market position can indicate a lower risk profile, whereas high debt levels, erratic earnings, and a weak competitive stance might signal higher risk.

  • Portfolio Diversification

Fundamental analysis aids in constructing a diversified investment portfolio. By analyzing a broad range of companies across different industries and sectors, investors can select securities that align with their risk tolerance and investment objectives, thereby spreading risk and enhancing potential returns.

Limitations of Fundamental Analysis:

  1. Time-Consuming Process

Fundamental analysis involves a deep dive into financial statements, economic indicators, company management, and market conditions. This extensive research requires significant time and effort, which may not be feasible for every investor, especially those who are not investing full-time.

  1. Impact of External Factors

While fundamental analysis focuses on a company’s intrinsic value, it can sometimes overlook the potential impact of external events or market sentiments. Political events, economic downturns, sudden market trends, or global crises can affect stock prices independently of the company’s fundamentals.

  1. Subjectivity in Analysis

Interpreting financial statements and predicting future performance involve a degree of subjectivity. Different analysts may have different opinions on the same set of data, leading to varied conclusions about a stock’s intrinsic value. This subjectivity can make fundamental analysis more of an art than a strict science.

  1. Historical Data

Fundamental analysis often relies on historical data to predict future performance. However, past performance is not always a reliable indicator of future success. Changes in industry dynamics, competition, or management can significantly alter a company’s growth trajectory.

  1. Market Efficiency

The Efficient Market Hypothesis (EMH) suggests that at any given time, stock prices fully reflect all available information. If the markets are indeed efficient, trying to find undervalued stocks through fundamental analysis might be less effective since all information is already priced in.

  1. Ignoring Technical Factors

Fundamental analysis primarily focuses on a company’s value and does not take into account the stock’s price movements or market trends, which are central to technical analysis. Sometimes, these technical factors can offer trading opportunities that fundamental analysis might miss.

  1. Lagging Indicator

By the time a fundamental analysis identifies a potentially undervalued stock, the market may have already begun adjusting the price to reflect this. In rapidly moving markets, this lag can mean missing out on initial gains.

  1. Industry and Sector Blind Spots

For investors focusing exclusively on bottom-up fundamental analysis, there’s a risk of missing broader industry or sector issues that could affect a company’s performance. This approach can overlook macroeconomic factors that impact investment performance across the board.

  1. Quantitative Focus

While fundamental analysis involves qualitative factors like management quality, much of the focus is on quantitative data from financial statements. Intangible assets, brand value, or industry trends might be undervalued in this analysis framework.

  1. Rapid Changes in Business Models

In today’s fast-paced economic environment, new technologies and business models can quickly disrupt industries. Fundamental analysis might not fully account for these rapid changes, especially for industries experiencing significant innovation.

Technical Analysis, Assumptions, Advantages, Approaches, Challenges

Technical analysis is a method used to evaluate and predict the future price movements of financial securities by analyzing past market data, primarily price and volume. Unlike fundamental analysis, which looks at economic and financial factors affecting supply and demand, technical analysis focuses on identifying patterns and trends in market behavior that are believed to repeat over time. Practitioners of technical analysis, known as technical analysts or chartists, use charts and other tools to identify these patterns and trends, with the underlying assumption that market psychology influences trading in a way that enables predicting future stock price movements. Technical analysis can be applied to any security with historical trading data, including stocks, bonds, commodities, and currencies. It is widely used by traders and investors to make decisions on when to buy, sell, or hold a security, aiming to gain profits by forecasting its price direction.

Assumptions of Technical Analysis:

  • Market Prices Discount Everything:

This assumption posits that all known and relevant information is already reflected in the market prices of securities. This includes fundamental factors, investor sentiment, and external factors. Therefore, the analysis focuses solely on price movements rather than external data.

  • Price Movements are Not Random:

Technical analysts believe that price movements follow trends and patterns that are not random but are instead influenced by various factors, including investor psychology and supply and demand dynamics. This predictability allows analysts to use historical data to forecast future price movements.

  • History Tends to Repeat Itself:

The assumption that history repeats itself is central to technical analysis. It is believed that market participants often react similarly to comparable market conditions over time, which results in recurring patterns and trends in price charts. This repeatability is attributed to consistent human behavior and market psychology.

  • Prices Move in Trends:

Technical analysis operates on the premise that prices move in trends, which can be upward (bullish), downward (bearish), or sideways (range-bound). Once a trend has been established, it is likely to continue for a period of time. Identifying these trends early is key to making profitable trading decisions.

  • Volume Confirms the Trend:

Volume, or the number of shares or contracts traded in a given period, is an important aspect of technical analysis. It is assumed that volume should increase in the direction of the trend. For example, in an uptrend, increasing volume confirms the strength of the trend, while decreasing volume might signal its weakness.

Approaches of Technical Analysis:

  • Chart Patterns:

This approach involves identifying specific patterns within price charts that suggest future movements. Common patterns include head and shoulders, triangles (ascending, descending, and symmetrical), double tops and bottoms, and flags and pennants. Each pattern has its own set of implications for potential market direction (upward, downward, or continuation of the current trend).

  • Trend Analysis:

The trend analysis approach focuses on determining the direction of the market or a specific asset’s prices. Analysts look for uptrends, downtrends, and sideways or range-bound trends to make predictions about future price movements. The saying “the trend is your friend” encapsulates the essence of trend analysis.

  • Technical Indicators and Oscillators:

Technical analysts use a wide range of indicators and oscillators to assess market conditions and potential price movements. These tools can indicate momentum, trend strength, overbought or oversold conditions, and potential reversal points. Popular indicators include moving averages, Relative Strength Index (RSI), Moving Average Convergence Divergence (MACD), Bollinger Bands, and Stochastic Oscillator.

  • Volume Analysis:

Analyzing trading volume alongside price movements provides insights into the strength or weakness of a trend. High volume during an uptrend suggests strong buying interest, while high volume during a downtrend indicates strong selling pressure. Volume analysis can confirm trends and signal potential reversals.

  • Candlestick Patterns:

Originating from Japan, candlestick patterns are a popular method used in technical analysis to predict short-term price movements based on the shape, color, and position of candlestick formations on a chart. Each pattern, such as doji, engulfing, and hammer, carries specific interpretations about market sentiment and potential price direction.

  • Elliott Wave Theory:

This approach is based on the theory that market prices move in predictable, repeating cycles or waves influenced by investor psychology. Analysts using the Elliott Wave Theory attempt to identify the current position within these wave patterns to predict future market movements.

  • Fibonacci Analysis:

Fibonacci analysis uses a series of numbers and ratios derived from the Fibonacci sequence to identify potential support and resistance levels, as well as reversal points. It is often used in conjunction with other technical analysis methods to refine predictions.

  • Market Sentiment Analysis:

This approach gauges the overall sentiment or mood of the market through various indicators, such as the Bull/Bear Ratio, the Volatility Index (VIX), and more. Market sentiment analysis helps in understanding whether the majority of traders are bullish or bearish, offering insights into potential market moves.

Advantages of Technical Analysis:

  • Applicability across Markets:

Technical analysis can be applied to a wide range of markets, including stocks, bonds, commodities, and currencies. This versatility allows traders to use similar tools and techniques across different asset classes.

  • Focus on Price Action:

Since technical analysis primarily focuses on price movements and volume, it can cut through the noise of market news and economic data, providing a clearer picture of market sentiment and trends.

  • Timeliness:

Technical analysis can provide immediate insights into market trends and potential reversals, offering timely opportunities for entry and exit. This is particularly valuable in fast-moving markets where quick decision-making is essential.

  • Identification of Trends and Patterns:

One of the core strengths of technical analysis is its ability to identify existing trends and forecast potential market movements based on historical patterns. Recognizing these trends can help traders align their trades with the market’s momentum.

  • Risk Management:

Technical analysis tools can help traders set stop-loss orders and define risk levels, enhancing risk management. By identifying support and resistance levels, traders can make more informed decisions about where to enter and exit positions.

  • CostEffectiveness:

For individual traders, technical analysis can be a cost-effective method of market analysis. Many charting tools and software are readily available, often at low cost or even free, reducing the barriers to entry for new traders.

  • Complements Fundamental Analysis:

While some traders rely exclusively on technical analysis, it can also complement fundamental analysis. For example, a trader might use fundamental analysis to select a stock and technical analysis to time their trades.

  • Psychological Insights:

Technical analysis considers the psychological aspects of market behavior, helping traders understand and anticipate collective market reactions to price movements or news events.

Technical Analysis Limitations:

  1. Self-Fulfilling Prophecy:

Some argue that technical analysis can sometimes become a self-fulfilling prophecy. When a large number of traders follow the same patterns and indicators, their collective actions can drive the market in a predicted direction, not necessarily because of underlying economic fundamentals.

  1. Historical Data Dependency:

Technical analysis relies heavily on historical market data. However, just because a market acted a certain way in the past does not guarantee it will do so in the future. Market dynamics and external factors are constantly changing.

  1. Overlooks Fundamentals:

By focusing mainly on price movements and trading volumes, technical analysis can overlook fundamental factors such as a company’s financial health, industry conditions, and macroeconomic indicators, which can significantly impact a security’s value.

  1. Subjectivity:

Many technical analysis tools and patterns can be interpreted in different ways by different analysts. This subjectivity can lead to conflicting predictions and uncertainty in decision-making.

  1. Late Signals:

Technical analysis often gives trading signals after a trend has already started. Traders who rely solely on technical indicators might enter the market too late, missing out on the initial phase of a trend.

  1. Noise:

Short-term market fluctuations, or “noise,” can often lead to false signals from technical indicators, which might mislead traders into making poor decisions.

  1. Not Universally Applicable:

Certain assets or markets might not lend themselves well to technical analysis. For example, markets with low liquidity or new assets without much historical data might not provide reliable indicators.

  1. Quantitative Only:

Technical analysis does not consider qualitative aspects, such as company management or industry innovation, which could influence an asset’s value.

  1. Efficient Market Hypothesis (EMH) Challenge:

The EMH suggests that all known information is already reflected in stock prices, challenging the premise of technical analysis that past price movements can predict future price movements.

10. Variability in Time Frames:

Different technical analysts may use different time frames for their charts, which can lead to different conclusions and recommendations even when looking at the same data.

Security Market Introduction, Functions, Components, Pros and Cons

Security Market refers to a platform where buyers and sellers engage in the trading of financial instruments, such as stocks, bonds, derivatives, and other securities. It plays a critical role in the economy by facilitating the allocation of capital from investors to entities requiring funds, such as corporations and governments. This market enables these entities to finance their operations, projects, or expansion plans, while providing investors the opportunity to earn returns on their investments. The security market includes both primary markets, where new securities are issued and sold for the first time, and secondary markets, where existing securities are traded among investors. It functions through regulated exchanges or over-the-counter (OTC) markets, ensuring transparency, fairness, and efficiency in trading.

Security Market Functions:

  • Capital Formation and Allocation

Security markets provide a mechanism for the transfer of resources from those with surplus funds (investors) to those in need of funds (borrowers). This process aids in the formation of capital, which is then allocated to various economic activities, promoting productivity and growth.

  • Price Discovery

Through the interaction of buyers and sellers, security markets determine the price of securities. This price discovery process reflects the value of an underlying asset based on current and future expectations, ensuring that capital is allocated to its most valued uses.

  • Liquidity Provision

Security markets offer liquidity, enabling investors to buy and sell securities with ease. This liquidity reduces the cost of trading and provides investors with the flexibility to adjust their portfolios according to their needs and market conditions.

  • Risk Management

The security market offers various financial instruments, including derivatives like options and futures, which help investors and companies manage risk. By allowing the transfer of risk to those more willing or able to bear it, the market enhances economic stability.

  • Information Aggregation and Dissemination

Markets aggregate information from various sources and reflect it in security prices, providing valuable signals to market participants and helping to allocate resources more efficiently. The dissemination of this information ensures transparency and aids in the decision-making process of investors.

  • Economic Indicators

The performance of security markets often serves as an indicator of the economic health and investor sentiment in an economy. Rising markets can indicate investor confidence and economic growth, while declining markets may signal economic downturns.

  • Corporate Governance

The security market plays a role in corporate governance by holding management accountable to shareholders. Through mechanisms like proxy voting, the market can influence company policies and management decisions to ensure they align with shareholder interests.

  • Diversification

Security markets provide a vast array of investment options, enabling investors to diversify their portfolios. Diversification helps investors spread their risk across different assets, sectors, and geographic locations, potentially reducing overall investment risk.

  • Innovation and Entrepreneurship Promotion

By facilitating access to capital, security markets support innovation and entrepreneurship. New and growing businesses can raise funds through these markets, driving economic innovation and job creation.

  • Government Financing

Governments often use security markets to raise capital through the issuance of government bonds. This financing supports public expenditures and projects without raising taxes, contributing to national development and infrastructure improvement.

Security Market Components:

  • Issuers

Issuers are entities that create and sell securities to raise funds. They can be corporations, governments, or other entities seeking capital to finance operations, projects, or expansion. In the case of corporations, they might issue stocks or bonds, while governments typically issue treasury bonds, bills, and notes.

  • Investors

Investors are individuals or institutions that purchase securities with the aim of earning a return. This group includes retail investors, institutional investors (such as pension funds, mutual funds, and insurance companies), and accredited investors (individuals or entities that meet specific financial criteria).

  • Financial intermediaries

Financial intermediaries facilitate transactions between issuers and investors. They include investment banks, which help issuers prepare and sell securities; broker-dealers, which buy and sell securities on behalf of clients; and investment advisors, who provide advice to investors. Mutual funds and hedge funds also fall into this category, pooling money from investors to purchase a portfolio of securities.

  • Regulators

Regulatory bodies oversee and regulate the security market to ensure its fairness, efficiency, and transparency. In the United States, the Securities and Exchange Commission (SEC) is the primary federal regulatory agency. Other countries have their own regulatory authorities, such as the Financial Conduct Authority (FCA) in the UK.

  • Exchanges

Exchanges are marketplaces where securities are bought and sold. They can be physical locations (like the New York Stock Exchange) or electronic platforms (like NASDAQ). Exchanges ensure a fair and orderly trading environment and provide liquidity and price discovery.

  • OverTheCounter (OTC) Markets

OTC markets enable the trading of securities not listed on formal exchanges. Trading occurs directly between parties without the supervision of an exchange, facilitated by dealer networks. OTC markets can offer more flexibility than exchanges but typically involve higher risks.

  • Depositories and Clearinghouses

Depositories hold securities in electronic form and facilitate their transfer during transactions. Clearinghouses act as intermediaries between buyers and sellers, ensuring the proper settlement of trades. Both play critical roles in reducing risk and enhancing efficiency in the security market.

  • Information Providers

This category includes organizations and services that provide financial news, data, analysis, and ratings. Bloomberg, Reuters, Moody’s, and Standard & Poor’s are examples. They offer essential information that investors and other market participants use to make informed decisions.

  • Legal and Accounting Firms

These professional service firms support the functioning of security markets by offering expertise in areas such as securities law, regulatory compliance, financial reporting, and auditing. They play a crucial role in ensuring transparency and trust in the market.

  • Market Makers

Market makers are firms or individuals that stand ready to buy and sell securities on a regular and continuous basis at a publicly quoted price. They provide liquidity to the market, making it easier for investors to buy and sell securities.

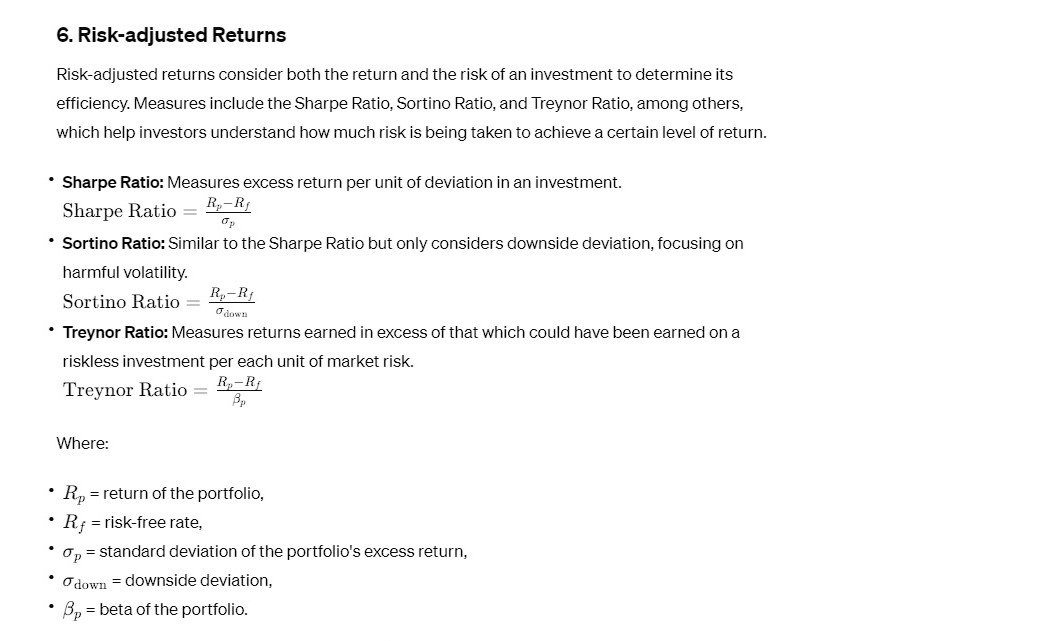
Security Market Pros:

  • Capital Formation and Allocation

Security markets enable efficient capital formation and allocation. They provide a platform for raising funds by issuing securities, allowing businesses and governments to finance growth, projects, and operations. This capital is directed towards productive uses, promoting economic development and job creation.

  • Liquidity

One of the primary advantages of security markets is the liquidity they offer, enabling investors to buy and sell securities with ease. This liquidity makes it possible for investors to quickly convert their investments into cash or to adjust their portfolios according to changing financial goals and market conditions.

  • Price Discovery

Security markets facilitate the price discovery process through the interactions of buyers and sellers. Prices of securities reflect the collective information and expectations of market participants, helping to allocate resources more efficiently and enabling informed investment decisions.

  • Diversification

The wide range of investment options available in the security market allows investors to diversify their portfolios, spreading their risk across different assets, sectors, or geographies. Diversification can reduce the impact of any single investment’s poor performance on the overall portfolio.

  • Risk Management

Security markets provide instruments and mechanisms for managing risk, such as options and futures. These tools enable investors and companies to hedge against adverse price movements, interest rate changes, or currency fluctuations, thus reducing potential losses.

  • Information Efficiency

The continuous flow of information in the security market, including company news, economic indicators, and market data, ensures transparency and helps maintain an informed investor base. This information efficiency supports better decision-making and fosters a level playing field.

  • Economic indicators

Security markets serve as barometers for the overall health of the economy. Stock market indices, for example, often reflect investor sentiment and can indicate economic trends, helping policymakers, businesses, and investors make informed decisions.

  • Corporate Governance

Publicly traded companies are subject to regulatory oversight and must meet disclosure requirements, promoting transparency and better corporate governance. This scrutiny can lead to improved management practices and accountability to shareholders.

  • Innovation and Entrepreneurship

Access to public markets enables startups and innovative companies to raise capital more efficiently, fueling entrepreneurship and technological advancement. This access to funds supports research and development activities, driving economic growth and innovation.

  • Wealth Creation

Over the long term, investing in securities has historically provided returns that outpace inflation, contributing to wealth creation for individuals and institutions. This wealth effect supports consumer spending and investment in the broader economy.

Security Market Cons:

  • Market Volatility

Security markets can be highly volatile, with prices of securities fluctuating widely over short periods due to various factors like economic news, geopolitical events, and market sentiment. This volatility can lead to significant investment losses and uncertainty for investors, particularly those with short-term horizons.

  • Information Asymmetry

Despite efforts to ensure transparency, information asymmetry can still exist, where some market participants have access to information not available to others. This can lead to unfair advantages and potentially manipulative practices, undermining the fairness and efficiency of the market.

  • Complexity

The wide range of financial products and strategies available in the security market can be overwhelming and complex for many investors, especially those who are new or lack financial literacy. This complexity can lead to misunderstandings and poor investment decisions.

  • Systemic Risk

The interconnectedness of financial institutions and markets means that disruptions in one part of the system can spread rapidly, potentially leading to systemic crises. Examples include the 2008 financial crisis, where the collapse of key institutions had widespread global effects.

  • Speculative Bubbles

Security markets can sometimes give rise to speculative bubbles, where asset prices are driven to excessively high levels not supported by fundamentals. When these bubbles burst, they can result in significant financial losses for investors and broader economic damage.

  • Access Barriers

While security markets have become more accessible over time, barriers to entry still exist for some investors, particularly in emerging markets. These can include high minimum investment requirements, lack of access to trading platforms, or regulatory restrictions.

  • Regulatory Risks

Changes in government policies and regulations can significantly impact security markets, introducing risks for investors. For example, new taxes on transactions or changes in securities law can affect market operations and investment returns.

  • Ethical and Governance issues

Corporate governance failures and unethical behavior, such as fraud or manipulation, can lead to significant losses for investors and erode trust in the security market. These issues highlight the need for strong regulatory oversight and ethical standards.

  • Over-reliance on Market Performance

Investors may become overly reliant on market performance for wealth creation, neglecting other forms of investment or savings. This can expose them to higher risk, especially if they lack a diversified investment strategy.

  • Shorttermism

The focus on short-term market performance can lead companies to prioritize immediate gains over long-term value creation, potentially sacrificing innovation, sustainability, and ethical considerations in the process.

error: Content is protected !!