 by
by Skewness is a statistical measure that indicates the degree and direction of asymmetry in a frequency distribution. When data is distributed evenly around the central value, the distribution is said to be symmetrical. However, if one side of the distribution extends farther than the other, the distribution is skewed.
In Business Statistics, skewness helps researchers and managers understand the nature of data distribution, identify trends, and make informed decisions. It is commonly used in the analysis of income, profits, wages, sales, investment returns, and market behavior.
Definition of Skewness
Skewness refers to the extent to which a distribution deviates from symmetry. It measures whether the observations are concentrated more on one side of the distribution than the other.
A distribution may be:
- Symmetrical
- Positively Skewed
- Negatively Skewed
Types of Skewness
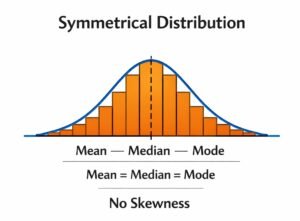
1. Symmetrical Distribution
A symmetrical distribution has equal frequencies on both sides of the central value.
Characteristics
- Mean = Median = Mode
- No skewness
- Skewness coefficient = 0
Example: The distribution of heights of a large group of people often approximates a symmetrical distribution.
Diagram
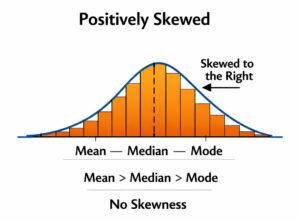
2. Positive Skewness (Right Skewness)
A distribution is positively skewed when the tail extends toward the right side.
Characteristics
- Mean > Median > Mode
- More observations are concentrated at lower values.
- A few high values pull the mean to the right.
Example: Income distribution in many countries where a small number of people earn very high incomes.
Diagram
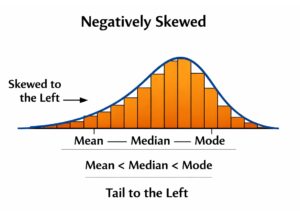
A distribution is negatively skewed when the tail extends toward the left side.
Characteristics
- Mean < Median < Mode
- More observations are concentrated at higher values.
- A few low values pull the mean to the left.
Example: Marks obtained in an easy examination where most students score high marks.
Diagram
4 thoughts on “Skewness”