Goods vs Services Marketing

Marketing of products and services involves different strategies due to the dissimilarities in their characteristics. While in goods marketing, the aim is to fulfil the needs and wants of the target population.  As against, in service marketing, the firm seeks to create a good relationship with the customer, to win their trust.

The two most important activities undertaken by the business is production or procurement of products and its distribution to the end user. The procurement of raw materials and its conversion into a finished goods is an easy job. However, the disbursement of the goods is a strenuous one, because creating a place for a goods in the market is a bit difficult task, as the market is already flooded with lacs and lacs of products, where no one knows about your goods and in this way the marketing comes into the picture.

Nowadays, marketing is not confined to the product, but services, ideas, property, experiences and even people are marketed. The marketing activities are aimed at creating an impression of the goods or service in the consumer mind, in such a manner, that your brand becomes a synonym for that particular goods or service.

Goods Marketing

The entire process, right from the market analysis, to delivering goods to the customer and receiving feedback, is called goods marketing. The process is aimed at finding out the right market for its goods and its placement in such a way that it gets good customer response. It entails promotion and sale of a goods to its target audience, i.e. prospective and existing buyers.

Various activities involved in the goods marketing involves analysis of the market, identification of consumer demand, designing and development of product, pricing, pitching of a new product, communicating, advertising, positioning, distributing, selling, review and feedback.

Example: Marketing for tangible objects like books, handbags, laptops, mobiles, clothes and so on.

Service Marketing

When a person or business entity promotes services it offers to its customers or clients, it is known as service marketing. It is aimed at providing solutions to the problems or difficulties of the clients. It includes both business-to-business (B2B) and business-to-consumer (B2C) marketing.

A service is an act of performing something for someone in exchange for adequate consideration. It is intangible, consumed at the time of its production, can’t be inventoried and resold. Each service offering is unique in itself because it cannot be repeated exactly alike, even if the service is rendered by the same person.

Example: Marketing of professional services, beauty parlours or salon, spa, coaching centres, health services, telecommunication, etc.

Goods Marketing

Service Marketing

Meaning Goods marketing refers to the process in which the marketing activities are aligned to promote and sell a specific goods for a particular segment. Service marketing implies the marketing of economic activities, offered by the business to its clients for adequate consideration.
Marketing mix 4 P’s 7 P’s
Sells Value Relationship
Who comes to whom? Products come to customers. Customers come to service.
Transfer It can be owned and resold to another party. It is neither owned nor transferred to another party.
Returnability Products can be returned. Services cannot be returned after they are rendered.
Tangibility They are tangible, so customer can see and touch it, before coming to the buying decision. They are intangible, so it is difficult to promote services.
Separability Goods and the company producing it, are separable. Service cannot be separated from its provider.
Customization Products cannot be customized as per requirements. Services vary from person to person, they can be customized.
Imagery They are imagery and hence, receive quick response from customers. They are non-imagery and do not receive quick response from customers.
Quality Comparison Quality of a goods can be easily measured. Quality of service is not measurable.

  1. The process in which the marketing activities are aligned to promote and sell a specific goods for a particular segment is called goods marketing. The marketing of economic activities, offered by the business to its clients for adequate consideration, is known as service marketing.
  2. In a goods marketing, only 4 P’s of the marketing mix are applicable which are product, price, place and promotion, but in the case of service marketing, three more P’s are added to the conventional marketing mix, which are people, process and physical existence.
  3. When a goods is marketed, the company offers value, as it fulfils customer’s requirements. Conversely, when service is marketed by a company, it offers a relationship to its clients.
  4. One thing to be noted that, in goods marketing, the company promotes something whose ownership can be transferred/resold to another party. But in the case of service marketing, the company promotes something, whose ownership can neither be transferred nor it is resold to the other party.
  5. In goods marketing, products reach the buyers, as they can be transported from one place to another through various distribution channels. Unlike service marketing, where customers come to the services or the service provider visit customer because services cannot be transported, they are location based.
  6. Products are tangible in nature, they can be felt and touched, which make its promotion easier. On the other hand, services are intangible, people can only experience it, and so marketing of services is a bit difficult.
  7. If the quality of a certain goods is not up to the mark, or it does not fulfil the desired requirement, it can be returned to the seller. However, it is impossible in the case of services, because once the services are delivered, they cannot be taken back. So, the marketing of services, should be done keeping the returnability factor in mind.
  8. In goods marketing, the goods can be separated from its producer, and so they are durable and can be inventoried. On the contrary, in service marketing, services can not be separated from its source, i.e. service provider. Hence the production and consumption of services are simultaneous; they are perishable.
  9. Goods offered by a company under a particular segment are standardised; they cannot be changed or altered as per customer’s requirement. In contrast, services offered by a company are highly variable and can be easily customised as per the requirements.
  10. It is a human tendency, that we respond quickly, to what we see and it is a major pro, of goods marketing that it grabs our attention, and encourages sales. As against this, services can’t be seen it can only be experienced and so the response it a little slow, while marketing services.
  11. In goods marketing, the quality of the goods can be measured by making a comparison between various products, but this is just opposite in service marketing, where the measurement of services is not possible.

Whether, it’s a goods marketing or a service marketing, the task is equally onerous. However, with the former, there are some advantages such as tangibility, separability, durability, transferability, etc. which the latter lacks, making it a bit difficult. Demonstration of goods or service is one of the best ways to promote it. Further, word of mouth also helps in marketing them.

Service Marketing Environment

The service marketing environment refers to all internal and external factors, which directly or indirectly influence the organization’s decisions related to marketing activities. Internal factors are within the control of an organization; whereas, external factors do not fall within its control. The external factors include government, technological, economic, social, and competitive forces; whereas, organization’s strengths, weaknesses, and competencies form the part of internal factors.

Marketers try to predict the changes, which might take place in future, by monitoring the marketing environment. These changes may create threats and opportunities for the business. With these changes, marketers continue to modify their strategies and plans.

Features of Marketing Environment

  1. Specific and General Forces

It refers to different forces that affect the marketing environment. Specific forces include those forces, which directly affect the activities of the organization. Examples of specific forces are customers and investors. General forces are those forces, which indirectly affect the organization. Examples of general forces are social, political, legal, and technological factors.

  1. Complexity

It implies that a marketing environment include number of factors, conditions, and influences. The interaction among all these elements makes the marketing environment complex in nature.

  1. Vibrancy

Vibrancy implies the dynamic nature of the marketing environment. A large number of forces outline the marketing environment, which does not remain stable and changes over time. Marketers may have the ability to control some of the forces; however, they fail to control all the forces. However, understanding the vibrant nature of marketing environment may give an opportunity to marketers to gain edge over competitors.

  1. Uncertainty

It implies that market forces are unpredictable in nature. Every marketer tries to predict market forces to make strategies and update their plans. It may be difficult to predict some of the changes, which occurs frequently. For example, customer tastes for clothes change frequently. Thus, fashion industry suffers a great uncertainty. The fashion may live for few days or may be years.

  1. Relativity

It explains the reasons for differences in demand in different countries. The product demand of any particular industry, organization, or product may vary depending upon the country, region, or culture. For example, sarees are the traditional dress of women in India, thus, it is always in demand. However, in any other western country the demand of saree may be zero.

Types of Marketing Environment

The sale of an organization depends on its marketing activities, which in turn depends on the marketing environment. The marketing environment consists of forces that are beyond the control of an organization but influences its marketing activities. The marketing environment is dynamic in nature.

Therefore, an organization needs to keep itself updated to modify its marketing activities as per the requirement of the marketing environment. Any change in marketing environment brings threats and opportunities for the organization. An analysis of these changes is essential for the survival of the organization in the long run.

A marketing environment mostly comprises of the following types of environment:

  • Micro Environment
  • Macro Environment

The discussion of these environments are given below:

  1. Micro Environment

Micro environment refers to the environment, which is closely linked to the organization, and directly affects organizational activities. It can be divided into supply side and demand side environment. Supply side environment includes the suppliers, marketing intermediaries, and competitors who offer raw materials or supply products. On the other hand, demand side environment includes customers who consume products.

Let us discuss the micro environment forces in the following points:

(i) Suppliers

It provides raw material to produce goods and services. Suppliers can influence the profit of an organization because the price of raw material determines the final price of the product. Organizations need to monitor suppliers on a regular basis to know the supply shortages and change in the price of inputs.

(ii) Marketing Intermediaries

It helps organizations in establishing a link with customers. They help in promoting, selling, and distributing products.

Marketing intermediaries include the following:

  • Resellers: It purchases the products from the organizations and sell to the customers. Examples of resellers are wholesalers and retailers.
  • Distribution Centers: It helps organizations to store the goods. A warehouse is an example of distribution center.
  • Marketing Agencies: It promotes the organization’s products by making the customers aware about benefits of products. An advertising agency is an example of marketing agency.
  • Financial Intermediaries: It provides finance for the business transactions. Examples of financial intermediaries are banks, credit organizations, and insurance organizations.

(iii) Customers

Customers buy the product of the organization for final consumption. The main goal of an organization is customer satisfaction. The organization undertakes the research and development activities to analyze the needs of customers and manufacture products according to those needs.

(iv) Competitors

It helps an organization to differentiate its product to maintain position in the market. Competition refers to a situation where various organizations offer similar products and try to gain market share by adopting different marketing strategies.

  1. Macro Environment

Macro environment involves a set of environmental factors that is beyond the control of an organization. These factors influence the organizational activities to a significant extent. Macro environment is subject to constant change. The changes in macro environment bring opportunities and threats in an organization.

(i) Demographic Environment

Demographic environment is the scientific study of human population in terms of elements, such as age, gender, education, occupation, income, and location. It also includes the increasing role of women and technology. These elements are also called as demographic variables. Before marketing a product, a marketer collects the information to find the suitable market for the product.

Demographic environment is responsible for the variation in the tastes and preferences and buying patterns of individuals. The changes in demographic environment persuade an organization to modify marketing strategies to address the altering needs of customers.

(ii) Economic Environment

Economic environment affects the organization’s costs structure and customers’ purchasing power. The purchasing power of a customer depends on the current income, prices of the product, savings, and credit availability.

The factors economic environment is as follows:

  • Inflation: It influences the customers’ demand for different products. For example, higher petrol prices lead to a fall in demand for cars.
  • Interest Rates: It determines the borrowing activities of the organization. For example, increase in interest rates for loan may lead organizations to cut their important activities.
  • Unemployment: It leads to a no income state, which affects the purchasing power of an individual.
  • Customer Income: It regulates the buying behavior of a customer. The change in the customer’s income leads to changed spending patterns for the products, such as food and clothing.
  • Monetary and Fiscal Policy: It affects all the organizations. The monetary policy stabilizes the economy by controlling the interest rates and money supply in an economy; whereas, fiscal policy regulates the government spending in various areas by collecting the revenue from the citizens by taxing their income.

(iii) Natural Environment

Natural environment consists of natural resources, which are needed as raw materials to manufacture products by the organization. The marketing activities affect these natural resources, such as depletion of ozone layer due to the use of chemicals. The corrosion of the natural environment is increasing day-by-day and is becoming a global problem.

(iv) Socio-Cultural Environment

Socio-cultural environment comprises forces, such as society’s basic values, attitudes, perception, and behavior. These forces help in determining that what type of products customers prefer, what influences the purchase attitude or decision, which brand they prefer, and at what time they buy the products. The socio-cultural environment explains the characteristics of the society in which the organization exists. The analysis of socio-cultural environment helps an organization in identifying the threats and opportunities in an organization.

For example, the lifestyles of people are changing day-by-day. Now, the women are perceived as an active earning member of the family. If all the members of a family are working then the family has less time to spend for shopping. This has led to the development of shopping malls and super markets, where individuals could get everything under one roof to save their time.

(v)  Technological Environment

Technology contributes to the economic growth of a country. It has become an indispensible part of our lives. Organizations that fail to track ongoing technological changes find it difficult to survive in today’s competitive environment.

Technology acts as a rapidly changing force, which creates new opportunities for the marketers to acquire the market share. Marketers with the help of technology can create and deliver products matching the life style of customers. Thus, marketers should observe the changing trends in technology.

Role of Service in Modern Economy

Service economy can refer to one or both of two recent economic developments:

The increased importance of the service sector in industrialized economies. The current list of Fortune 500 companies contains more service companies and fewer manufacturers than in previous decades.

The relative importance of service in a product offering. The service economy in developing countries is mostly concentrated in financial services, hospitality, retail, health, human services, information technology and education. Products today have a higher service component than in previous decades. In the management literature this is referred to as the servitization of products or a product-service system. Virtually every product today has a service component to it.

Services include a wide range varying from education, transportation, hospitality, finance, real estates, accounting, banking, insurance, taxation, consultancy, health care etc. These services are together called the services sector or the tertiary sector.

Everything that grows also changes its structure and change is inevitable. A human being passes through different phases-infancy to old age and during which he constantly changes in terms of perception, attitude, physical and mental attributes etc.

Similarly a growing economy changes the proportions and interrelations among its basic sectors namely agriculture, industry, and services and between other sectors like rural and urban, public and private, domestic-and export-oriented etc. All growing economies are likely to go through these stages.

A service is a set of consumable and perishable benefits delivered by a service house to a customer to ensure customer satisfaction.

Goods and services are produced in every economy. In a crude way, a good is something one can take with him after purchase, whereas a service cannot be taken as it is intangible. Example when a person goes to a dentist he use the services of the dentist and returns with a relief. In the process he does not get any physical commodity but still he has consumed a service.

Core goods providers provide a significant service component as part of their businesses. For example, automobile manufacturers provide extensive spare parts distribution services to support repair centers at dealers. Core service providers must integrate tangible goods with intangible services.

For example, a cable television company must provide cable hookup, repair services and also high-definition cable boxes. Pure services, such as may be offered by a financial consulting firm, may need little in the way of facilitating goods, but what they do use such as textbooks, professional references, and spreadsheets are critical to their performance.

The recent services are the ones related to IT, BPO, KPO, BT etc. These sectors are growing phenomenally.

A commercial service is a type of economic activity that is intangible, cannot be stored and does not result in any ownership. A service is consumed at the point of sale itself. Services are one of the two key components of economics, the other one being goods.

Sometimes services are difficult to identify because they are closely associated with a good; such as the combination of a diagnosis with the administration of a medicine. No transfer of possession or ownership takes place when a service is sold.

The American Marketing Associations defines services as “(1) activities, benefits or satisfaction which are offered for sale, (2) are provided in connection with the sale of goods”. The services described in the second half of the definition are those included in the sale of goods to the customer, viz., pre-sale and after sale services, e.g., services on installation of machinery, its maintenance and repairs, credit and delivery services etc.

The first part of the said definition, viz., “activities, benefits or satisfactions which are offered for sale.” The marketing of these kinds of services usually does not include the sale of goods to the customer. Such activities, benefits or satisfactions offered for sale are intangible in nature, i.e., they are not concrete objects which can be seen, tasted, felt, moved and so on.

There is a regular market for such services represented by activities, benefits and satisfactions offered for sale by providers of services. These services may be labour services, personal services, professional services or institutional services such as offered by transport, banking, insurance, warehousing, advertising and such other services organisations.

When a customer buys a service in the service market be buys the time, knowledge, still or resources of someone else who is the provider or supplier of a service. The buyer receives satisfactions or benefits from the activities of the provider who be an individual, a firm or a company, i.e., and institution specialising in selling certain benefits or satisfaction.

The importance of service Sector in economy is growing rapidly.

  • Services account for more than 60 percent of GDP worldwide
  • Almost all economies have a substantial service sector
  • Most of the new employment is provided by services (Fastest growth expected in knowledge-based industries)
  • Strongest growth area for marketing

Marketing Challenges of Services

Those who work in a service business often face greater marketing challenges than those who offer tangible products. The service marketer typically does not have the advantage of demonstrating the physical features of a product, so it may be difficult for the prospect to comprehend the benefits of the service. Additional creativity is often required to market services successfully.

Operations management in service businesses is primarily concerned with the “how” of the organization in other words how the service product can be produced and delivered to specification and in such a way as to achieve the organization’s objectives. It is also important to have a clear understanding of the “what”, i.e. the nature of the service product and how it meets the users’ requirements.  Clearly if the “how” is delivered with little reference to the “what” it would be surprising if this were particularly effective. This leads therefore to a number of challenges faced by service operations:

  1. Knowing who the customer is

This might sound obvious however it is not always the case. In many service operations the same service will attract different customers who have different needs. The “customer” could be defined in a number of ways the user (the person that uses the service), the buyer (the person that purchases the service) and the funder (the person that funds the transaction).  This could be one person, this could be three different people all with different needs and benefits. Understand who are the various customers, understanding their needs, developing relationships with them and managing the various customers are key challenges for services.

  1. Knowing what the organization is selling / providing

There may be differing views about what the organization is selling. One customer may have one benefit in mind and another has a completely different perspective.  This leads, in effect, to the perception that the organization is selling different services. Articulating and communicating the service concept to its different customers is critical for clarifying the organization’s product to all of its customers and in ensuring it can be delivered to meet all of its customers’ expectations.

  1. Managing the outcome and experience

One of the challenges of service businesses is that, for many, there is no clear distinction between the what and the how at the customer interface. For example, a customer in a restaurant is buying both the meal and the way in which they are served. This is completely different to manufacturing operations where the production and delivery to the customer are completely separate. A critical challenge therefore for service businesses is managing outcomes and experiences simultaneously.

  1. Managing the customer

Many service businesses face a challenge not shared by manufacturing, that of the presence of the customer, often as an essential part of the service production process. The design of the service must manage the customer through the process with an awareness of moods and attitudes of individual customers.

The presence of the customer also renders the operation visible to the customer, so the servicescape needs to be designed to create the right atmosphere for the service.

  1. Service is real-time

Many services happen in real-time, they cannot be delayed or put off. A passenger wanting to purchase a ticket for immediate travel may not be willing to return tomorrow if the sales agent is busy. Furthermore, during a service encounter it is not possible to undo what is done or said, things in the heat of the moment or promises that cannot be kept. In service there is no rewind button.  Managing capacity and creating an appropriate culture are key challenges in managing real-time services.

  1. Co-ordination

Service businesses are extremely demanding, requiring integration of marketing, resource management, people management and so on. The small service business owner is responsible for co-ordinating these various parts of the organization to deliver the service and understand and meet the needs of the customer.

  1. Knowing the relationship between operations decisions and business success

It may sound obvious but making the right decisions that will lead to business success is a key challenge for all service business owners. Business success may mean satisfying and retaining customers, attracting new customers, entering new markets, making profit, reducing costs. The problem is in knowing how they all interrelate and how changing one impacts on the others.

  1. Improving the operation

A challenge faced by all small service business owners is how to continually improve and develop their processes and products, ensure that the outcomes are real improvements and that there is a culture that is supportive of service and change.  An important challenge in this area is managing the increased complexity resulting from change.

Purchase Process for Services

When a customer is considering a purchase that is more expensive or requires some kind of monthly commitment they will usually spend more time thinking about it. They may want to research different options, talk to a friend or family member about it, and weigh the pros and cons of going through with the sale.

In business, this process is often portrayed as a sales funnel with more and more people dropping off as they move further into the funnel.

At each point during this process, the customer will go through a specific thought pattern. To help your customer follow through with the sale, you must understand what their needs are at each point.

Let’s look at the six stages of the buying process below:

Stage 1: Problem Recognition

This is the most important step in the decision process because your customer has to realize they need your product before a purchase can take ever place. This presents you with both the opportunity and the challenge of identifying with your customer. The best strategy is to articulate their problem in your marketing efforts.

With traditional marketing or PR, this can be done through advertising: having an ad that explains what the customer’s problem is, and how the product or service can solve it.

With any online business, on the other hand, the best way to influence the “problem recognition” stage is through content marketing. With the right content, you could identify with your audience, articulate their needs, and offer helpful resources and tools.

Stage 2: Information Search

Now the customer will begin searching for information to help them find the best solution to their problem. Most people will immediately turn to friends, family members, and colleagues for recommendations.

While you can’t really talk the above-mentioned friends or family members into endorsing your product, there are several things you could do.

  • Focusing on the Product: If your product is really good, people are going to start being your brand advocates, and you won’t even have to pay them.
  • Build Authority: This one’s pretty generic, and translates into regular marketing. It could mean working on your company web presence, for example, so that it’s easy for your customers to find you and learn more about your product.
  • Reviews & Partnerships: Other than friends and family, there’s something else that’s extremely helpful in influencing decision-making: the influencers. Establishing connections with experts in your field (or bloggers, review websites, etc.) will help you stand out.

Stage 3: Evaluation of Alternatives

Although some people will come to a quick decision, most customers will not settle for the first solution they find. They will evaluate several different options and the possible benefits or drawbacks to each. And even if your company has the best product to meet their needs, they still may decide to go with someone else.

So, the one thing you could do at this stage is to offer a lot more value than your competition & communicate that with your customers. This can be easier in some industries (software, for example, where you can add more powerful features), but hard in others (consumer goods. Who looks at the brand of their toilet paper, anyway?)

Stage 4: Purchase Decision

Once the customer has explored their options they will make a decision about whether or not to move forward with the purchase. Yes, even though they have reached the middle of the buying process they could still choose to walk away.

At this point, customers need a sense of security. They also needed to be reminded of the problem that brought them here in the first place.

And if a customer does decide to walk away this is the best point in the process to bring them back. Depending on your industry, this could be a simple email reminder, for example (“hey, you were interested in out software!”).

Stage 5: Purchase

At this stage, you want to make it as easy as possible for your customers to buy from you. Does your website load too slowly? Can they order from their phone just as easily as on a desktop? These are questions you should consider.

The customer already decided that they want to do business with you, you don’t want to make it hard for them. Let’s say if your payment processing software is being laggy, they might just decide to ditch and go to your competitor!

Stage 6: Post-Purchase Evaluation

You may think you are in the clear now but your work doesn’t end after the customer makes their purchase! Customers will evaluate their purchase based on previous expectations and decide whether or not they are satisfied. If they’re not happy with your product, they’ll just never use it again and everyone knows that recurring customers are much better than those buying just once.

Or it could end up going even worse, with the customer asking for their money back.

Depending on how you handle this situation, the customer will react differently. If you put their concerns at ease & even make them feel better, they’re much more likely to come back or even refer their friends. Or, if you treat them wrong, you’re never going to see them (or their friends) again.

There are a couple of ways to work with this stage…

  • Good Customer Service: Being able to talk to your customers & help them use their product can take you a long way.
  • Follow-Up Emails, Survey: Showing the customer that you care about their experience is a pleasant experience on its own.
  • Fair Treatment: Sometimes, the product might just end up not being what the customer is looking for. If you treat them with respect & offer a refund, they’re more likely to come back for a different purchase. If you shut them down, they’re lost forever.

Hopefully, these six steps have given you a better understanding of the thought process that goes into making a purchase. They can be extremely helpful if used as a framework to analyze your customer’s thinking, and then use what you learn in combination with other marketing efforts.

Service Marketing Triangle

The service marketing triangle or the Service triangle as it is commonly called, underlines the relationships between the various providers of services, and the customers who consume these services.

As we know, relationships are most important in the services sector. The service triangle outlines all the relationships that exist between the company, the employees and the customers. Furthermore, it also outlines the importance of systems in a services industry and how these systems help achieve customer satisfaction.

As the name suggests, the service marketing triangle can also be used to market the service to consumers. The marketing completely depends on the interaction going on between the customer and the service provider. We will look at each of these interactions in detail, and also read on how to market to your customer based on the interaction.

There are 6 main relationships in the Service triangle. And based on these relationships, there are three ways to apply marketing tactics.

Let us first go through the 6 relationships in the Service marketing triangle

  1. Company to Customers

One of the critical thing is to communicate the service strategy to the customers. Most of the E-commerce companies are nowadays employed in convincing the customers to buy from their portal only. For this buying, they are communicating various service advantages which the customers have.

Communication of the service strategy to customers is important to build the trust of customers and hence to convert the customers to be loyal to the company.

  1. Company to employees

Another important relationship in the service triangle is that between the company and the employees. Imagine an Airline where the flight attendants themselves are frustrated with the company. You, as a customer, will land up with the poorest services.

Hence, training employees, building value and trust, and empowering employees are some of the ways that the company can make their employees a positive influencing force for the customers.

  1. Company to systems

To keep customers happy, efficient and productive systems need to be developed. Imagine your bank in the 1960’s where everything was done by paper. If you wanted to transfer money, you will have to fill many forms, and the recipient had to fill many forms. Ultimately it was a tedious process.

However, due to advanced systems, nowadays you can not only transfer money to others sitting at home, you can practically do 80% of the banking work sitting at home from your laptop. That’s the importance of systems in a service marketing triangle.

  1. Customers to systems

Although building systems are important, these systems should be most useful to customers. Taking the same example of banking systems above, it is surprising that even today when you go to a bank, there is a queue. Look at retail stores. There’s always a big line to check out.

The interaction between customer and system is critical to build the service brand. Taking the example of E-commerce systems, when the customer is promised various service advantages, and when he fails to return a product due to system errors or logistics errors, he becomes dissatisfied with the service.

For a company, it is important not only to build systems, but ensure that the systems comply to the customers and give excellent experience to customers.

  1. Employees to system

Not only do systems leave customers frustrated, they also leave the employees frustrated. Imagine a McDonald’s where orders taken at the front desk are not reaching the kitchen. Or imagine a service center, where although you have entered a grievance, the employee is not getting your complaint and hence not calling you. Ultimately it is the employee on whom you are going to get angry!!

In one of the consumer durable companies i know, the systems were top of the line, but they had so many processes with regards to outstanding and inventory, that a simple order processing took 20 minutes. This same company had at least 1 lakh dealers and distributors. So imagine the continuous delay in order processing and the pressure on employees due to this system issue. The system was working excellently, but it was creating friction between the employees and the system.

Both, Employee motivation, and the empowerment of employees depends on the type of system you hand over to your employees. If the systems are very good and your employees are able to make good use of it, you will get very happy and satisfied customers.

  1. The most important relationship in the service triangle: Employee to Customers

The employee to customer interaction is also known as the “moment of truth” or “critical incidents”. A single customer can become dissatisfied with the way the employee treated him. Or that single customer can buy a lot of material from the same store, because the employee treated him or her like a king or queen.

That’s the difference your employees can create when they interact with customers. There are companies which are high in the customer satisfaction index, just because their employees are well-trained and are empowered to take their own decisions. More importantly, these employees are ingrained with the habit that “Customer is king”.

Once your employees starts treating the customer as if they are really king, the whole service triangle gets completed, and you will get the best results from all processes employed.

Capital Market Line

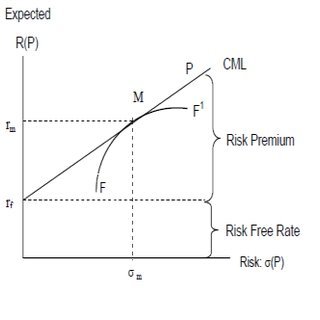
The capital market line (CML) represents portfolios that optimally combine risk and return. Capital asset pricing model (CAPM), depicts the trade-off between risk and return for efficient portfolios. It is a theoretical concept that represents all the portfolios that optimally combine the risk-free rate of return and the market portfolio of risky assets. Under CAPM, all investors will choose a position on the capital market line, in equilibrium, by borrowing or lending at the risk-free rate, since this maximizes return for a given level of risk.

Portfolios that fall on the capital market line (CML), in theory, optimize the risk/return relationship, thereby maximizing performance. The capital allocation line (CAL) makes up the allotment of risk-free assets and risky portfolio for an investor. CML is a special case of the CAL where the risk portfolio is the market portfolio. Thus, the slope of the CML is the sharpe ratio of the market portfolio. As a generalization, buy assets if the sharpe ratio is above the CML and sell if the sharpe ratio is below the CML.

CML differs from the more popular efficient frontier in that it includes risk-free investments. The intercept point of CML and efficient frontier would result in the most efficient portfolio, called the tangency portfolio.

The CAPM, is the line that connects the risk-free rate of return with the tangency point on the efficient frontier of optimal portfolios that offer the highest expected return for a defined level of risk, or the lowest risk for a given level of expected return. The portfolios with the best trade-off between expected returns and variance (risk) lie on this line. The tangency point is the optimal portfolio of risky assets, known as the market portfolio. Under the assumptions of mean-variance analysis that investors seek to maximize their expected return for a given amount of variance risk, and that there is a risk-free rate of return all investors will select portfolios which lie on the CML.

According to Tobin’s separation theorem, finding the market portfolio and the best combination of that market portfolio and the risk-free asset are separate problems. Individual investors will either hold just the risk-free asset or some combination of the risk-free asset and the market portfolio, depending on their risk-aversion. As an investor moves up the CML, the overall portfolio risk and return increases. Risk averse investors will select portfolios close to the risk-free asset, preferring low variance to higher returns. Less risk averse investors will prefer portfolios higher up on the CML, with a higher expected return, but more variance. By borrowing funds at the risk-free rate, they can also invest more than 100% of their investable funds in the risky market portfolio, increasing both the expected return and the risk beyond that offered by the market portfolio.

  • The capital market line (CML) represents portfolios that optimally combine risk and return.
  • CML is a special case of the CAL where the risk portfolio is the market portfolio. Thus, the slope of the CML is the sharpe ratio of the market portfolio.
  • The intercept point of CML and efficient frontier would result in the most efficient portfolio called the tangency portfolio.

As a generalization, buy assets if sharpe ratio is above CML and sell if sharpe ratio is below CML.

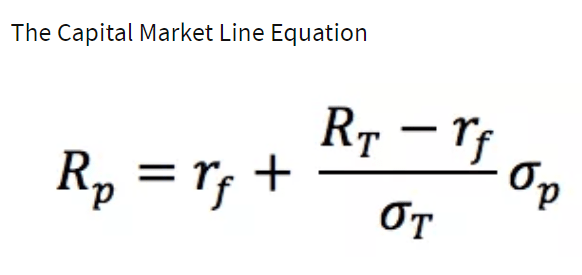
The Capital Market Line Equation:

Where:

Rp = Portfolio return

rf = Risk free rate

RT = Market return

σp = Standard deviation of portfolio returns

σT = Standard deviation of market returns

The Capital Market Line and the Security Market Line

The CML is sometimes confused with the security market line (SML). The SML is derived from the CML. While the CML shows the rates of return for a specific portfolio, the SML represents the market’s risk and return at a given time, and shows the expected returns of individual assets. And while the measure of risk in the CML is the standard deviation of returns (total risk), the risk measure in the SML is systematic risk, or beta. Securities that are fairly priced will plot on the CML and the SML. Securities that plot above the CML or the SML are generating returns that are too high for the given risk and are underpriced. Securities that plot below CML or the SML are generating returns that are too low for the given risk and are overpriced.

History of the Capital Market Line

Mean-variance analysis was pioneered by Harry Markowitz and James Tobin. The efficient frontier of optimal portfolios was identified by Markowitz in 1952, and James Tobin included the risk-free rate to modern portfolio theory in 1958. William Sharpe then developed the CAPM in the 1960s, and won a Nobel prize for his work in 1990, along with Markowitz and Merton Miller.

Capital Asset Pricing Model (CAPM), Meaning, Definition, Calculation, Components, Assumptions, Importance and Limitations

Capital Asset Pricing Model (CAPM) is a financial model used to determine the expected rate of return on an investment based on its level of systematic risk. It establishes a relationship between risk and return and helps investors calculate the required rate of return on equity securities. CAPM assumes that investors need to be compensated for both the time value of money and the risk associated with an investment.

The model is widely used in Advanced Financial Management for estimating the cost of equity capital, evaluating investment opportunities, and making portfolio management decisions. CAPM was developed by William F. Sharpe, John Lintner, and Jan Mossin.

Definition of CAPM

According to CAPM, the expected return on a security is equal to the risk-free rate plus a risk premium based on the security’s beta coefficient.

The model explains that investors should receive:

  • A risk-free return for the time value of money.
  • A risk premium for taking additional market risk.

CAPM Formula and Calculation

CAPM is calculated according to the following formula:

Ra = Rrf + {Ba* (Rm – Rrf)}

Where:

Ra = Expected return on a security=

Rrf = Risk-free rate

Ba = Beta of the security

Rm = Expected return of the market

Calculation of CAPM

Example 1

Calculate the cost of equity using CAPM with the following information:

  • Risk-Free Rate (Rf) = 6%
  • Beta (β) = 1.2
  • Market Return (Rm) = 14%

Solution

Ke = Rf + β (Rm − Rf)

Ke = 6% + 1.2 (14% − 6%)

Ke = 6% + 1.2 (8%)

Ke = 6% + 9.6%

Ke = 15.6%

Answer: Cost of Equity = 15.6%

This means shareholders require a return of 15.6% for investing in the company’s shares.

Example 2

A company has:

  • Risk-Free Rate = 5%
  • Beta = 0.8
  • Market Return = 12%

Solution

Ke = 5% + 0.8 (12% − 5%)

Ke = 5% + 0.8 (7%)

Ke = 5% + 5.6%

Ke = 10.6%

Answer: Cost of Equity = 10.6%

Since beta is less than 1, the stock is less risky than the market.

Components of CAPM

1. Risk-Free Rate (Rf)

The risk-free rate is the minimum return that an investor expects without taking any risk. It represents compensation for the time value of money and is usually based on the yield of government securities because they are considered highly secure. In the Capital Asset Pricing Model (CAPM), the risk-free rate serves as the foundation for calculating the expected return on an investment. A higher risk-free rate increases the required return on securities. Financial managers and investors use this rate as a benchmark to compare the attractiveness of risky investments and to estimate the cost of equity capital.

Example: Suppose the yield on a government bond is 6%. This means an investor can earn 6% without significant risk. If an equity investment is being evaluated, its expected return must be higher than 6% to compensate for the additional risk involved. Therefore, Rf = 6% becomes the starting point for CAPM calculations.

2. Beta Coefficient (β)

Beta coefficient is a measure of the systematic risk of a security in relation to the overall market. It indicates how sensitive a stock’s returns are to changes in market returns. A beta of 1 means the stock moves in line with the market. A beta greater than 1 indicates higher volatility and risk, while a beta less than 1 suggests lower risk. CAPM uses beta to determine the additional return investors require for bearing market risk. It is an important tool for evaluating investment risk and making portfolio management decisions in financial markets.

Interpretation of Beta

  • β = 1 → Risk equal to the market
  • β > 1 → Higher risk than the market
  • β < 1 → Lower risk than the market
  • β = 0 → No market risk

Example:

If a company has a beta of 1.5, it means the stock is 50% more volatile than the market. If the market rises by 10%, the stock is expected to rise by approximately 15%. Similarly, if the market falls by 10%, the stock may fall by about 15%.

3. Market Return (Rm)

Market return represents the average return expected from the overall stock market over a given period. It reflects the performance of a broad market index and serves as a benchmark for evaluating individual investments. In CAPM, market return is used to estimate the return investors expect from a diversified portfolio of securities. The difference between market return and the risk-free rate determines the market risk premium. A higher expected market return generally increases the required return on risky investments. Therefore, market return plays a significant role in calculating the cost of equity capital.

Example:

Assume the expected return on a broad stock market index is 14%. This means investors expect the market as a whole to generate a 14% return during the year. Therefore, in CAPM calculations, Rm = 14% is used to estimate the required return on a company’s shares.

4. Market Risk Premium (Rm Rf)

Market risk premium is the additional return that investors expect for investing in the stock market instead of risk-free securities. It is calculated by subtracting the risk-free rate from the expected market return. This premium compensates investors for taking systematic risk that cannot be eliminated through diversification. In CAPM, the market risk premium is multiplied by the beta coefficient to determine the risk-related portion of the required return. A larger market risk premium indicates greater investor expectations regarding market risk. It is a crucial component in estimating expected returns and evaluating investment opportunities.

Example:

Suppose the expected market return is 15% and the risk-free rate is 5%.

Market Risk Premium = Rm − Rf

= 15% − 5%

= 10%

This means investors expect an extra 10% return for taking market risk. If a stock has a beta of 1.2, this premium will be adjusted according to its risk level when calculating the expected return using CAPM.

Importance of Capital Asset Pricing Model (CAPM)

  • Helps in Determining Cost of Equity Capital

The Capital Asset Pricing Model (CAPM) is one of the most widely used methods for estimating the cost of equity capital. It calculates the return required by shareholders based on the risk-free rate, market risk premium, and beta coefficient. This helps companies determine the minimum return that must be earned on investments financed through equity. Accurate estimation of the cost of equity is essential for financial planning and decision-making. By providing a scientific and risk-based approach, CAPM enables firms to estimate shareholder expectations and maintain an appropriate balance between risk and return.

  • Assists in Capital Budgeting Decisions

CAPM plays a crucial role in capital budgeting by providing a suitable discount rate for evaluating investment projects. Financial managers compare the expected return of a project with the required return calculated through CAPM. If the project’s return exceeds the CAPM-based cost of equity, the investment is generally considered acceptable. This helps companies select profitable projects and reject unprofitable ones. By incorporating systematic risk into the evaluation process, CAPM improves the quality of investment decisions. Consequently, businesses can allocate resources more efficiently and undertake projects that contribute to long-term profitability and shareholder wealth.

  • Measures Systematic Risk Effectively

One of the most important contributions of CAPM is its focus on systematic risk, which affects all securities in the market and cannot be eliminated through diversification. The beta coefficient used in CAPM measures this market-related risk and helps investors understand how sensitive a security is to market movements. By quantifying risk in a clear and measurable way, CAPM assists investors and financial managers in making informed decisions. Understanding systematic risk is essential for evaluating investments, designing portfolios, and estimating required returns. This makes CAPM a valuable tool in modern financial management.

  • Supports Investment Decision-Making

Investors use CAPM to assess whether an investment offers adequate returns for the level of risk involved. The model provides an expected rate of return that serves as a benchmark for evaluating securities. If the expected return on a stock is higher than the CAPM-required return, the stock may be considered attractive. Conversely, if the expected return is lower, the investment may not be worthwhile. This helps investors make rational and objective investment decisions. By linking risk and return systematically, CAPM contributes to more effective investment analysis and portfolio selection.

  • Assists in Security Valuation

CAPM is widely used in the valuation of shares and other financial securities. Analysts estimate the required rate of return using CAPM and then use it as a discount rate in valuation models. This helps determine the intrinsic value of securities and compare it with market prices. If a stock’s intrinsic value exceeds its market value, it may be considered undervalued. Such analysis assists investors in identifying profitable investment opportunities. Therefore, CAPM plays a significant role in security valuation and helps ensure that investment decisions are based on sound financial principles.

  • Facilitates Portfolio Management

Portfolio managers use CAPM to construct and manage investment portfolios that balance risk and return. The model helps identify securities that offer appropriate returns relative to their level of systematic risk. By understanding beta values and expected returns, portfolio managers can select investments that align with their risk preferences and investment objectives. CAPM also assists in evaluating portfolio performance by comparing actual returns with expected returns. This improves portfolio efficiency and supports strategic investment planning. Consequently, CAPM is considered an important tool for effective portfolio management and diversification strategies.

  • Improves Financial Decision-Making

CAPM provides a structured framework for making various financial decisions. It helps managers estimate the cost of capital, evaluate investment projects, determine appropriate financing strategies, and assess business risks. Because the model incorporates market risk into decision-making, it enables companies to make more realistic and informed financial choices. CAPM also assists in setting performance targets and measuring the effectiveness of investment decisions. By providing a clear relationship between risk and return, the model enhances the overall quality of financial management and supports the achievement of organizational goals.

  • Contributes to Shareholder Wealth Maximization

The ultimate objective of financial management is to maximize shareholder wealth, and CAPM contributes significantly to this goal. By helping companies estimate required returns accurately, evaluate investments effectively, and allocate resources efficiently, the model supports value-creating decisions. Investments that generate returns higher than the CAPM-based required return increase shareholder wealth, while unprofitable projects can be avoided. CAPM also assists investors in selecting securities that offer appropriate compensation for risk. Through better investment appraisal, security valuation, and financial planning, CAPM helps organizations achieve sustainable growth and long-term shareholder prosperity.

Limitations of Capital Asset Pricing Model (CAPM)

  • Based on Unrealistic Assumptions

One of the major limitations of CAPM is that it is based on several unrealistic assumptions. The model assumes perfect capital markets, no taxes, no transaction costs, and equal access to information for all investors. It also assumes that investors behave rationally and always seek to maximize wealth. In reality, financial markets are affected by taxes, regulations, information asymmetry, and emotional decision-making. These factors influence investment behavior and market prices. Since the assumptions rarely exist in practice, the results produced by CAPM may not accurately reflect actual market conditions and investment risks.

  • Difficulty in Measuring Beta

Beta is a key component of CAPM, but measuring it accurately is often difficult. Beta is usually calculated using historical market data, which may not represent future risk. A company’s business operations, financial structure, and market environment can change over time, causing beta values to fluctuate. Different calculation periods and market indices may also produce different beta estimates. As a result, investors may obtain inconsistent results when using CAPM. Since the model heavily depends on beta for estimating required returns, inaccuracies in beta measurement can significantly affect investment decisions and valuation outcomes.

  • Ignores Unsystematic Risk

CAPM assumes that investors hold well-diversified portfolios and therefore only systematic risk is relevant. It ignores unsystematic risk, which arises from company-specific factors such as management quality, labor disputes, product failures, and operational inefficiencies. However, many investors do not hold perfectly diversified portfolios and may still be exposed to these risks. In such situations, unsystematic risk can have a substantial impact on investment returns. By excluding company-specific risks from its calculations, CAPM may underestimate the total risk faced by investors and provide an incomplete assessment of investment opportunities.

  • Reliance on Historical Data

CAPM often relies on historical data to estimate beta, market returns, and risk premiums. However, past performance does not always predict future results. Economic conditions, industry trends, technological developments, and government policies can change significantly over time. As a result, estimates based on historical information may become inaccurate or outdated. Investors using CAPM may therefore make decisions based on assumptions that no longer reflect current market realities. This dependence on historical data reduces the reliability of the model, especially in rapidly changing economic and financial environments.

  • Difficulty in Estimating Market Return

The expected market return is an important input in CAPM, but estimating it accurately is challenging. Different analysts may use different market indices, forecasting techniques, and time periods to calculate market returns. Future market performance is uncertain and influenced by numerous economic and political factors. Small changes in the estimated market return can significantly affect the calculated cost of equity. Because there is no universally accepted method for predicting future market returns, CAPM results may vary considerably among analysts. This uncertainty limits the precision and consistency of the model.

  • Assumes a Constant Risk-Free Rate

CAPM assumes that the risk-free rate remains stable throughout the investment period. In reality, interest rates fluctuate due to inflation, monetary policy changes, economic growth, and market conditions. Government bond yields, which are commonly used as risk-free rates, can vary significantly over time. Changes in the risk-free rate directly affect the expected return calculated by CAPM. As a result, the model may produce inaccurate estimates if future interest rate movements differ from current assumptions. This limitation becomes particularly important during periods of economic uncertainty and volatile financial markets.

  • Market Conditions Change Frequently

Financial markets are dynamic and constantly influenced by economic, political, and social factors. Investor sentiment, inflation, interest rates, technological innovations, and global events can rapidly change market conditions. CAPM assumes a relatively stable relationship between risk and return, which may not always hold true in practice. During market crises or periods of extreme volatility, actual returns may differ substantially from CAPM predictions. Therefore, the model may not accurately capture the complexities of real-world financial markets. This limitation reduces its effectiveness in forecasting returns under changing market environments.

  • Oversimplifies the Risk-Return Relationship

CAPM explains investment returns using only one risk factor—systematic market risk measured by beta. However, many studies have shown that other factors such as company size, value characteristics, profitability, liquidity, and economic conditions also influence stock returns. By focusing solely on beta, CAPM oversimplifies the complex relationship between risk and return. Modern financial theories and multifactor models often provide a more comprehensive explanation of investment performance. As a result, CAPM may fail to fully capture all relevant determinants of security returns, limiting its accuracy and practical usefulness in certain situations.

Dow Jones Theory

Dow Theory (Dow Jones Theory) is a trading approach developed by Charles Dow. Theory is the basis of technical analysis of financial markets. The basic idea of Dow Theory is that market price action reflects all available information and the market price movement is comprised of three main trends.

The Averages Discount Everything.

Every knowable factor that may possibly affect both demand and supply is reflected in the market price.

The Market Has Three Trends.

According to Dow an uptrend is consistently rising peaks and troughs. And a downtrend is consistently rising lowering peaks and troughs.

Dow believed that laws of action and reaction apply to the markets just as they do to the physical universe, meaning that each significant movement is followed by a certain pullback.

Dow considered a trend to have three parts:

  1. Primary (compared to tide, reaching further and further inland until the ultimate point is reached).
  2. Secondary (compared to waves and representing corrections in the primary trend, normally retracing between one-third and two-thirds of the previous trend movement and most frequently about half of the previous move)
  3. Minor (ripples) (fluctuations in the secondary trend).

Major Trends Have Three Phases.

Dow mainly paid attention to the primary (major) trends in which he distinguished three phases:

  • Accumulation phase: The most astute investors are entering the market feeling the change in the current market direction.
  • Public participation phase:A majority of technicians begin to join in as the price is rapidly advancing.
  • Distribution phase:A new direction is now commonly recognized and well hiked; economic news are all confirming which all ends up in increasing speculative volume and wide public’s participation.

The Averages Must Confirm Each Other.

Dow used to say that unless both Industrial and Rail Averages exceed a previous peak, there is no confirmation of inception or continuation of a bull market. Signals did no have to occur simultaneously, but the quicker one followed another the stronger the confirmation was.

Volume Must Confirm the Trend. 

Volume increases or diminishes according to whether the price is moving in direction of a trend or in reverse. Dow considered volume a secondary indicator. His buy or sell signals were based on closing prices.

A Trend Is Assumed to Be Contiunous Until Definite Signals of Its Reversal.

The overall technical approach in market analysis is based upon the idea that trends continue in motion until there is an external force causing it to change its direction just like any other physical objects. And of course there are reversal signals to be looking for.

Dow Theory Principles

  • The Averages Discount Everything.
    Every knowable factor that may possibly affect both demand and supply is reflected in the market price.
  • The Market Has Three Trends.
    According to Dow an uptrend is consistently rising peaks and troughs. And a downtrend is consistently rising lowering peaks and troughs. 
    Dow believed that laws of action and reaction apply to the markets just as they do to the physical universe, meaning that each significant movement is followed by a certain pullback.Dow considered a trend to have three parts:

Primary (compared to tide, reaching further and further inland until the ultimate point is reached).

Secondary (compared to waves and representing corrections in the primary trend, normally retracing between one-third and two-thirds of the previous trend movement and most frequently about half of the previous move)

Minor (ripples) (fluctuations in the secondary trend).

  • Major Trends Have Three Phases.

    Dow mainly paid attention to the primary (major) trends in which he distinguished three phases:

  • Accumulation phase:The most astute investors are entering the market feeling the change in the current market direction.
  • Public participation phase:A majority of technicians begin to join in as the price is rapidly advancing.
  • Distribution phase:A new direction is now commonly recognized and well hiked; economic news are all confirming which all ends up in increasing speculative volume and wide public’s participation.

The Averages Must Confirm Each Other.
Dow used to say that unless both Industrial and Rail Averages exceed a previous peak, there is no confirmation of inception or continuation of a bull market. Signals did no have to occur simultaneously, but the quicker one followed another the stronger the confirmation was.

Volume Must Confirm the Trend. 
Volume increases or diminishes according to whether the price is moving in direction of a trend or in reverse. Dow considered volume a secondary indicator. His buy or sell signals were based on closing prices.

A Trend Is Assumed to Be Contiunous Until Definite Signals of Its Reversal.
The overall technical approach in market analysis is based upon the idea that trends continue in motion until there is an external force causing it to change its direction just like any other physical objects. And of course there are reversal signals to be looking for.

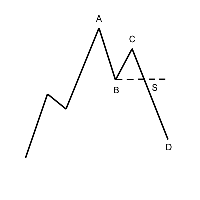
Failure Swing.

The failure of the peak at C to overcome A, followed by the violation of the low at B, constitutes a “sell” signal at S.

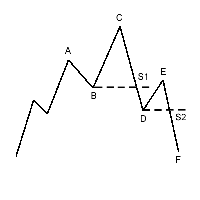
Nonfailure Swing.

Notice that C exceeds A before D falling below B. Some Dow theorists would see a “sell” signal at S1, while others would need to see a lower high at E before turning bearish at S2.

Dow only took in consideration closing prices. Averages had to close higher than a previous peak or lower than a previous trough to be significant. Intraday penetrations did not count.

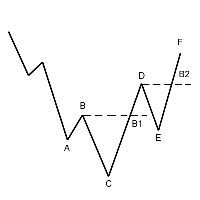
Failure Swing Bottom. 

The “buy” signal takes place when point B is exceeded (at Bl).

Nonfailure Swing Bottom.

“Buy” signals occur at points B1 or B2.

Efficient Market Theory

The efficient market hypothesis (EMH), alternatively known as the efficient market theory, is a hypothesis that states that share prices reflect all information and consistent alpha generation is impossible. According to the EMH, stocks always trade at their fair value on exchanges, making it impossible for investors to purchase undervalued stocks or sell stocks for inflated prices. Therefore, it should be impossible to outperform the overall market through expert stock selection or market timing, and the only way an investor can obtain higher returns is by purchasing riskier investments.

The Efficient Market Hypothesis (EMH) is a controversial theory that states that security prices reflect all available information, making it fruitless to pick stocks (this is, to analyze stock in an attempt to select some that may return more than the rest).

Stock picking takes, in the best of cases, a lot of work to be just feebly fruitful, so there are probably better things to do with our resources

The rationale behind this is that the plentiful well-informed motivated professionals that work in the financial markets allegedly form an efficient system for assigning each security the most adequate price, given the available information. Therefore, no individuals can outsmart this fabulous group and beat the marketby regularly buying securities at prices that are lower than what they should be.

Put in other words, the hypothesis is saying that no stock trades too cheaply or too expensively; hence, it would be useless to select which ones to buy or sell. According to the EMH, the reason for this perfect pricing is that, if one stock happens to be trading even just a bit too cheaply (or too costly), then its demand increases (or decreases), rapidly moving the price to its most reasonable value.

This sounds against ordinary wisdom, as we have all heard stories of successful stock picking by keen traders. Sometimes, these traders justify their accomplishments, explaining how they anticipated certain news that produced a change of price, which was unseen for most of the other stock traders. Nevertheless, these cases don’t necessarily contradict the EMH. When some news triggers a change of value, the previous price may have reflected the amount of probability of the news really happening and the price shift it would produce. There was a probability of the news not happening, and if that had been the case, the price would have shifted in opposite direction. If the EMH happens to be right, those who were lucky to select the right outcome this time, may be unlucky the next.

If we are hiring professionals to do stock picking for us, their fees shouldn’t be too high, because the potential benefits aren’t

To decide if investors can beat the market or not, what we need to know is if their predictions are more often right than wrong (actually, that “more often” should be a weighted average that considers the amount of possible profits and losses). On the one hand, people tend to remember and communicate their success stories more than their failures, especially if they are trying to sell a service. Moreover, among the veteran traders in the markets, there are more who won in the past, because those who lost money were more inclined to finding something else to do with their time and remaining assets. So you will hear a lot of success stories about traders supposedly using their knowledge to beat the market, but that doesn’t necessarily prove the EMH to be wrong.

Forms: Weak, Semi-Strong and Strong EMH

There is scientific evidence to support the EMH. According to some it is conclusive (and so they talk about an Efficient Market Theory) and according to others it is not. In part, it depends on the flavor of EMH being under study, as there are three versions of it, which differ in their definition of available information. We said that the hypothesis states that this fabulous team called the market assigns the more adequate price given a certain information. It is key to know what kind of information that is, because if we had more than that data then the EMH wouldn’t say anything about our chances to beat the market.

The EMH version that most interests us (semi-strong) has strong factual support, although it is arguable to say that it is conclusive

The weak version of EMH says that this information is past prices and trading volumes. This type has the strongest support but it is the least significant, as everyone has access to more information than past trading data. For example, company earnings, indebtment, product profile, among other facts (that are called fundamentals). Therefore not much is said about the possibility of investors beating the market or not. Nevertheless, it has an interesting consequence: it would be of no use to perform technical analysis (which is stock price prediction based exclusively on past trading data, in contrast to fundamental analysis, which studies the financial performance of the corporation).

A stronger flavor of EMH, called semi-strong, says that the information in question is all which is publicly available. This version is the most interesting for our case because, as investors, that is exactly the information that we have access to, so if semi-strong EMH is true, then it is useless for us to analyze stock in an attempt to separate winners from losers.

There is a stronger version, or strong EMH, which is based on all information, public or private. This one has evidence against. Therefore, it is illegal to use insider information for trading, as it would mean insiders taking profits from the general public and thus pushing them away from stock trading, something that society doesn’t want. Corporate officers can buy their corporations’ stock, but when they do they have to inform the government, and that information is made public so that their purchase becomes a publicly-known fact.

Implications

The EMH version that most interests us (semi-strong) has strong factual support, although it is arguable to say that it is conclusive. Personally I take it to be not totally true but to a high degree, and that level of acceptance is enough for inferring some important practical conclusions:

  • Stock picking takes, in the best of cases, a lot of work to be just feebly fruitful, so there are probably better things to do with our resources.
  • Instead of picking stocks, it makes sense to buy passively-managed funds with low commissions, such as various ETFs, to obtain the market’s average returns.
  • If we are hiring professionals to do stock picking for us (which happens, for example, when we purchase shares of an actively-managed fund) their fees shouldn’t be too high, because the potential benefits aren’t.
  • Whenever we attempt to beat the market, by performing security picking ourselves or through a professional (fund manager), lets consider the rationale behind the EMH, to identify potential sources of market inefficiency. For example, we better not try to beat the market by analyzing large-cap companies, because lots of people are doing it, with the same information that is available to us. Instead, coming to know a small company and a niche market could put us (or our fund manager) in an advantageous position compared to the rest of the market. Therefore, active management sounds like a better idea for small-cap funds than for large.
  • Don’t feel too bad if you bought a security and then its price fell, you only were as silly (or intelligent) as that fabulous team called the market. There are other better criteria for judging your portfolio-building skills.

Instead of picking stocks, it makes sense to buy passively-managed funds with low commissions, to obtain the market’s average returns

EMH shouldn’t be misinterpreted into thinking that there is no such thing as investment-portfolio design. There are still important decisions to make in order to obtain a portfolio with a risk that suits you; a good (expected) reward for that risk, and the lowest possible costs, meaning commissions and other fees. Modern Portfolio Theory is a set of theories that provide the basis for doing it, with EMH as one of its pillars, and will be treated in subsequent articles. Just as the Efficient-Market Hypothesis, much of the rest of Modern Portfolio Theory is easy to grasp and has immediate practical consequences, even for small investors.

error: Content is protected !!