Return on equity capital

The return on equity ratio or ROE is a profitability ratio that measures the ability of a firm to generate profits from its shareholders investments in the company. In other words, the return on equity ratio shows how much profit each dollar of common stockholders’ equity generates.

So, a return on 1 means that every dollar of common stockholders’ equity generates 1 dollar of net income. This is an important measurement for potential investors because they want to see how efficiently a company will use their money to generate net income.

ROE is also an indicator of how effective management is at using equity financing to fund operations and grow the company.

Formula

The return on equity ratio formula is calculated by dividing net income by shareholder’s equity.

Return on Equity Ratio = Net income / Shareholder’s Equity

Most of the time, ROE is computed for common shareholders. In this case, preferred dividends are not included in the calculation because these profits are not available to common stockholders. Preferred dividends are then taken out of net income for the calculation.

Also, average common stockholder’s equity is usually used, so an average of beginning and ending equity is calculated.

Analysis

Return on equity measures how efficiently a firm can use the money from shareholders to generate profits and grow the company. Unlike other return on investment ratios, ROE is a profitability ratio from the investor’s point of view not the company. In other words, this ratio calculates how much money is made based on the investors’ investment in the company, not the company’s investment in assets or something else.

That being said, investors want to see a high return on equity ratio because this indicates that the company is using its investors’ funds effectively. Higher ratios are almost always better than lower ratios, but have to be compared to other companies’ ratios in the industry. Since every industry has different levels of investors and income, ROE can’t be used to compare companies outside of their industries very effectively.

Interpreting the Return on Equity

The return on equity is similar to the “return on assets”. Assets come from two sources: debt and equity. The ROE focuses on the latter. Return on equity measures profitability using resources provided by investors and company earnings.

A high return on assets shows than the business was able to successfully utilize the resources provided by its equity investors and the company’s accumulated profits in generating income. Nonetheless, just like any other financial ratio, the ROE is more useful if it is compared to a benchmark such as the average ROE in the industry where the company operates or the company’s ROE in the past years.

Stock (Inventory) to Working capital Ratio

The amount of current assets that a company has on hand at any given time, in excess of its current liabilities, is known as its net working capital (NWC).

These funds are what allow a business to run its daily operations. One of the short-term assets held by many companies is the cash invested in its inventory. But if this inventory amount is relatively large compared to other assets, it can skew the perception of just how readily available a firm’s cash truly is for paying off short-term debts. Sometimes a company’s inventory can suffer from extremely low turn-over, or simply becomes outdated and difficult to sell.

The inventory to net working capital ratio allows you to calculate exactly what proportion of a business’s working capital is tied up in its inventory, giving you a more accurate picture of its liquidity position.

Stock (Inventory) to Working capital Ratio = Inventory / (Accounts Receivables+ inventory – Accounts Payable)

Cautions & Further Explanation

Analyzing a company’s inventory to net working capital ratio is best done over a number of periods to accurately identify trends in the use of a firm’s working capital.

Such trends can help to reveal any problems in a company’s regular operations, including the rising ratio values associated with heavy quantities of outdated stock, inferior purchasing control, and inefficient sales forecasts.

Ideally, you should use the inventory to NWC ratio at the same time as you examine a company’s inventory turnover rate, since stock that consistently turns over quickly will contribute far more positively to an organization’s level of liquidity.

Interpretation & Analysis

In general, the lower a company’s inventory to working capital ratio is, the higher its liquidity.

This will be particularly true for those businesses that hold large quantities of inventory and that require certain levels of cash to fund their operations.

While some analysts consider ratio values of less than 100% to be sufficient proof of a company’s liquidity, this value often proves to be too generic for every situation.

Inventory to WC ratios vary widely between industries and companies, and you’ll glean more meaningful information by using industry averages as a benchmark in your analyses.

Preparation of Cash flow Statement (Accounting Standard-3)

AS3 revised in 1997 has recommended revised Cash Flow Statement [CFS] for listed companies and other industrial, commercial, and business undertakings in the private and public sector. It is at present recommendatory in character.

According to revised AS 3, CFS should be prepared in such a way as to report the cash flows during the period separately for operating, investing, and financing activities.

1. Cash Flows from Operating Activities.

Examples are as follows:

(a) Cash receipts from sale of goods and services;

(b) Cash receipts from royalties, fees, commission, and other revenue;

(c) Cash payments to suppliers of goods and services;

(d) Cash payments to employees;

(e) In the case of insurance companies, cash receipts and payments for premium received and claims and other benefits to policy holders;

(f) Payment and refund of income tax;

(g) Cash receipts and payments relating to futures and options contracts taken up for trading purposes.

2. Cash Flows from investing activities.

Examples of such activities are as follows:

(a) Purchase of fixed assets including intangibles and payments relating to capitalized research and development cost and self-constructed fixed assets.

(b) Cash receipts from sale of fixed assets including intangibles.

(c) Purchase of securities for cash such as shares, warrants, and debt instruments of other enterprises.

(d) Sale of securities for cash

(e) Loans and advances given to third parties

(f) Loans and advances collected from third parties

(g) Cash receipts and payments relating to futures and options contracts entered into for investment purposes.

3. Cash Flows from financing activities.

Examples of such activities are as follows:

(a) Cash receipts from the issue of shares and other similar instruments,

(b) Cash receipts from the issue of debentures, bonds, long or other short-term borrowing,

(c) Redemption of shares and repayment of amounts borrowed.

The following illustrations would make clear the preparation of CFS under AS 3 method and Traditional method.

Illustration 1:

Balance sheets of X and Y on 1-1-2001 and 31.12-2001 were as follows:

Balance Sheet
Liabilities 2000

Rs.

2001

Rs.

Assets 2000

Rs.

2001

Rs.

Creditors 40,000 44,000 Cash 10,000 7,000
Mrs X’s loan 25,000 Debtors 30,000 50,000
Loan from Bank 40,000 50,000 Stock 35,000 25,000
Capital 1,25,000 1,53,000 Machinery 80,000 55,000
Land 40,000 50,000
Building 35,000 60,000
2,30,000 2,47,000 2,30,000 2,47,000

During the year, a machine costing Rs. 10,000 (accumulated depreciation Rs.3,000) was sold for Rs.5,000.

The provision for depreciation against machinery as on 1-1-2001, was Rs.25,000, and on 31-12-2001 it was Rs.40,000. Net profit for the year 2001 amounted to Rs.45,000. You are required to prepare cash flow statement.

You are required to prepare CFS under AS 3 [Revised] method.

Solution:

I Cash flow from Operating Activities: Rs. Rs.
  Net profit made during the Year 45,000  
  Adjustment from depreciation 18,000  
  Loan on sale of machinery 2,000  
  Operating Profit before working capital changes 65,000  
  Decrease in stock 10,000  
  Increase in Creditors 4,000  
  Increase in Debtors [20,000]  
  Net Cash flow from operating Activities   59,000
II Cash flows from Investing Activities:    
  Sale of machinery 5,000  
  Purchase of land (10,000)  
  Purchase of building (25,000)  
  Net cash flow from investing activities   (30,000)
III Cash flows from Financing activities    
  Loans from Bank 10,000  
  Mrs. X’s loans repaid (25,000)  
  Drawings (17,000)  
  Net Cash flows from Financing activities   [32,000]
  Net increase or decrease in cash and cash equivalent   [3,000]
  Cash and cash equivalent opening balance   10,000
  Cash and cash equivalent closing balance   7,000

Notes:

  1. Cash and cash equivalents include cash and bank balances and risk less short-term investments.
  2. Cash flow from operations is computed in the statement itself instead of preparing a separate statement showing cash from operations as in the case of traditional method.
  3. Figures given within brackets represent cash outflows.

Estimation of requirements in case of Trading & Manufacturing Organizations

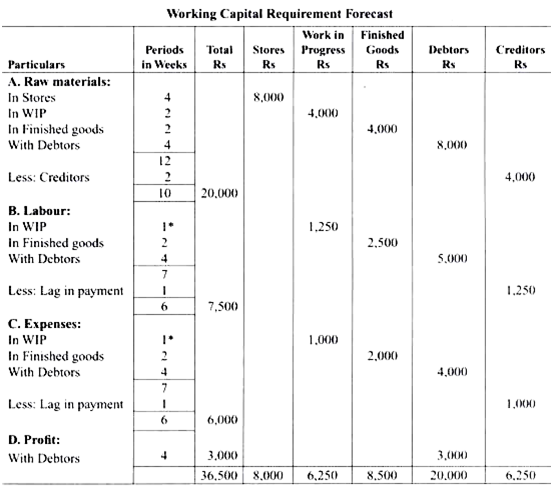
The two components of working capital are current assets and current liabilities. The estimation of the amount of current assets and current liabilities to maintain a particular level of operation is not an easy task.

Inadequate working capital leads to disruption in the smooth production process while excess working capital increases the cost.

The estimation of working capital in case of trading and manufactur­ing concern is discussed here.

Manufacturing Concern:

The estimation of working capital for a manufacturing concern requires adoption of following steps:

(a) Determination of expected production per week or per month.

(b) Determination of cost for each element, i.e. Material, Labour and Overhead as well as Profit per unit.

(c) Calculation of amount blocked in each week/month for each element of Cost and Profit.

(d) Determination of operating cycle by estimating the Raw materials holding period. Processing time, finished goods storage period. Debt collection period. Creditor’s payment period. Time lag in payment of wages and overheads.

(e) Determination of Net block period. It is the period for which each element of cost remains blocked. For example, if Raw materials remain in stores for 2 weeks after purchase; Processing time is 2 weeks; Finished goods remain in stock for 3 weeks; Credit period extended to debtors is 4 weeks; and Payment for materials is made 2 weeks after purchase then, the Net block period will be:

[(2+ 2 + 3 + 4) – (2)] = 9 weeks.

(f) By multiplying Net block period as calculated in step (e) and the amount blocked for each element of cost as per step (c) we get the working capital requirement for each element of cost.

(g) By totalling all amounts as calculated for each element of cost and desired cash, if any, we get the total amount of working capital.

Example 7.1:

Determine the Working Capital requirement from the following information:

  1. Expected Sales 13,000 units
  2. Analysis of selling price:

Rs (per unit)

Raw Materials

8.00

Labour

5.00

Expenses

4.00

Profit

3.00

Selling Price

20.00

  1. Raw materials in store: 1 month
  2. Processing time: 2 weeks
  3. Finished product in store: 2 weeks
  4. Credit allowed to debtors: 4 weeks
  5. Credit allowed by creditors: 2 weeks
  6. Lag in payment for wages and expenses: 1 week
  7. Production is carried on evenly during the year and wages and expenses accrue in the same way.

Solution:

(a) Weekly Sales = 13,000/52 = 250 units

(b) Weekly Blockage:

Raw materials: 250 x Rs 8 = Rs 2,000

Labour: 250 x Rs 5 = Rs 1,250

Expenses: 250 x Rs 4 = Rs 1,000

Profit: 250 x Rs 3 = Rs 750

Receivables Management: Meaning & Importance

Accounts receivable is the amount owed to a company resulting from the company providing goods and/or services on credit. The term trade receivable is also used in place of accounts receivable.

The amount that the company is owed is recorded in its general ledger account entitled Accounts Receivable. The unpaid balance in this account is reported as part of the current assets listed on the company’s balance sheet.

When goods are sold on credit, the seller is likely to be an unsecured creditor of its customer. Therefore, the seller should be cautious when selling goods on credit.

Good accounting requires that an estimate should be made for any amount in Accounts Receivable that is unlikely to be collected. The estimated amount is reported as a credit balance in a contra-receivable account such as Allowance for Doubtful Accounts. This credit balance will cause the amount of accounts receivable reported on the balance sheet to be reduced. Any adjustment to the Allowance account will also affect Uncollectible Accounts Expense, which is reported on the income statement.

Example of Accounts Receivable

A manufacturer will record an account receivable when it delivers a truckload of goods to a customer on June 1 and the customer is allowed to pay in 30 days. From June 1 until the company receives the money, the company will have an account receivable (and the customer will have an account payable).

Cost of Maintaining Receivables

Maintaining receivables bears cost. It includes cost of investment in receivables, bad debt losses, collection expenses and cash discount. Costs related with receivables and their calculation are as follows:

1. Cost Of Investment In Receivables

This is the opportunity cost of funds being tied up in receivables, which would otherwise have not been incurred if all sales were in cash. The cost of investment in receivable is calculated as:

Cost of receivables = Investment in receivables X Opportunity costs

Here,

investment in receivables = (FC+ VC)/Days in year) X DSO

Where, FC = Fixed Cost, VC = Variable Cost and DSO = Days sales outstanding.

2. Bad Debt Losses

This is the loss due to default customers. Extension of credit to low quality-rate customers results into increase in bad debt losses. Bad debt losses are calculated as a percentage on sales as shown in equation below:

Bad debt losses = Annual credit sales X Percentage default customer

3. Collection Expenses

This is the cost incurred for operating and managing the collection and credit department of a firm. This includes the administrative cost of credit department, salary and commission paid to collection staff, cost paid for telephone and communication and so on.

4. Cash Discount

It is the cost incurred to induce the customer for early payments of their accounts. A firm can offer cash discount to its customers to reduce the average collection period, bad debt losses, and the cost of investment in receivables. The discount cost is calculated as cash discount percentage multiplied by sales to discount customers as given below:

Discount Cost = Annual credit sales X Percentage discount customer X Percentage cash discount

Objectives of Receivables Management

Following are the objectives of receivables management which will help us to understand the purpose of receivables:

  1. To optimize the amount of sales
    2. To minimize cost of credit
    3. To optimize investment in receivables.
    4. To increase credit sales.

Therefore, the main objective of receivable management is to create a balance between profitability and cost.

Accounts receivable recorded in the financial statements

Usually, the businesses expect to receive money in the future, so it is to be added to the assets in the financial statement of the business. The accurate record keeping of this money that is receivable (accounts receivable) in the books of accounts are required to avoid any default in the payment due.

Few pointers connected to recording accounts receivable are as follows :

a. Establishing the practice of credit transactions:

The business may establish a practice of providing a credit policy to its buyers. This credit can be extended for a specified time period and any default in this payment usually attracts penalty. This practice of credit facility requires two parties to come to an agreement on the terms and conditions for such credit transactions. The provider of this facility should also verify the paying ability of the customer before agreeing to any terms and conditions.to prevent loss of cash inflow.

b. Generating invoices for the customer:

The businesses are required to generate invoices of the sales made or services delivered. The invoice should have details of the cost of goods and services sold to the customers. This generating of invoice ensures the recording of the credit transaction clearly in the accounts of the business. Further, a copy of the invoice is given to the customer to make the payment as per the agreed terms.

c. Tracking the payments received and the payment that is due to be received:

An accountant is required to track the payments received or due from the customers. The details of the method of payment and date of receiving payment have to be recorded in the customer’s ledger account. This ensures correctness of accounting of the credit amount. The businesses shall also generate timely reminders for dues pending to the customers.

d. Accounting for the accounts receivable

The accountant or the person responsible for taking due care of the account’s receivables must record all the due dates of the payments to be received. The timely and prompt recording of the accounts receivable leads to receiving the payments on time from the customers. Once the account receivable is recorded and payment is received, the account for the said party can be settled for good.

Credit policy Variables

The important dimensions of a firm’s credit policy are credit standards, credit period, cash discount and collection effort. These variables are related and have a bearing on the level of sales, bad debt loss, discounts taken by customers, and collection expenses.

i) Credit standards:

A firm has a wide range of choice in this respect. At one and of the spectrum, it may decide not to extend credit to any customer, however strong his credit rating may be. At the other end, it may decide to grand credit to all customers irrespective of their credit rating. Between these two extreme positions lie several positions, often the more practical ones.

In general, liberal credit standards tend to push sales up by attracting more customers. This is, however, accompanied by a higher incidence of bad debt loss, a larger investment in receivables, and a higher cost of collection. Stiff-credit standards have opposite effects. They tend to depress sales, reduce the incidence of bad debt loss, decrease the investment in receivables, and lower the collection cost.

ii) Credit period:

The credit period refers to the length of time customers are allowed to pay for their purchases. It generally varies from 15 days to 60 days. When a firm does not extend any credit, the credit period would obviously be zero. If a firm allows 30 days, say, of credit, with no discount to induce early payments, its credit terms are stated as “net 30”.

Lengthening of the credit period pushes sales up by inducing existing customers to purchase more and attracting additional customers. This is, however, accompanied by a larger investment in receivables and a higher incidence of bad debt loss. Shortening of the credit period would have opposite influences: It tends to lower sales, decrease investment in receivables, and reduce the incidence of bad debt loss.

iii) Cash discount:

Firms generally offer cash discounts to induce customers to made prompt payments. The percentage discount and the period during which it is available are reflected in the credit terms. For example, credit terms of 2/10, net 30 mean that a discount of 2 per cent is offered if the payment is made by the tenth day; otherwise the full payment is due by the thirtieth day.

Liberalizing the cash discount policy may mean that the discount percentage is increased and/or the discount period are lengthened. Such an action tends to enhance sales (because the discount is regarded as price reduction), reduce the average collection period (as customers pay promptly), and increase the cost of discount.

iv) Collection Effort:

The collection programmed of the firm, aimed at timely collection of receivables consisting of monitoring the state of receivables, dispatch of letters to customers whose due date is approaching, telegraphic and telephonic advice to customers around the due date, threat of legal action to overdue accounts and legal action against overdue accounts.

Method of credit evaluation (Traditional & Numerical-Credit Scoring)

Credit Analysis

Credit analysis is a process of drawing conclusions from available data (both quantitative and qualitative) regarding the credit worthiness of an entity, and making recommendations regarding the perceived needs, and risks.

The 5 c’s of credit analysis

Character

  • This is the part where the general impression of the protective borrower is analysed. The lender forms a very subjective opinion about the trust worthiness of the entity to repay the loan. Discrete enquires, background, experience level, market opinion, and various other sources can be a way to collect qualitative information and then an opinion can be formed, whereby he can take a decision about the character of the entity.

Capacity

  • Capacity refers to the ability of the borrower to service the loan from the profits generated by his investments. This is perhaps the most important of the five factors. The lender will calculate exactly how the repayment is supposed to take place, cash flow from the business, timing of repayment, probability of successful repayment of the loan, payment history and such factors, are considered to arrive at the probable capacity of the entity to repay the loan.

Capital

  • Capital is the borrower’s own skin in the business. This is seen as a proof of the borrower’s commitment to the business. This is an indicator of how much the borrower is at risk if the business fails. Lenders expect a decent contribution from the borrower’s own assets and personal financial guarantee to establish that they have committed their own funds before asking for any funding. Good capital goes on to strengthen the trust between the lender and borrower.

Collateral (or guarantees)

  • Collateral are form of security that the borrower provides to the lender, to appropriate the loan in case it is not repaid from the returns as established at the time of availing the facility. Guarantees on the other hand are documents promising the repayment of the loan from someone else (generally family member or friends), if the borrower fails to repay the loan. Getting adequate collateral or guarantees as may deem fit to cover partly or wholly the loan amount bears huge significance. This is a way to mitigate the default risk. Many times, Collateral security is also used to offset any distasteful factors that may have come to the fore-front during the assessment process.

Conditions

  • Conditions describe the purpose of the loan as well as the terms under which the facility is sanctioned. Purposes can be Working capital, purchase of additional equipment, inventory, or for long term investment. The lender considers various factors, such as macroeconomic conditions, currency positions, and industry health before putting forth the conditions for the facility.

Credit Standards

Credit standards are the criteria a company uses to screen credit applicants in order to determine which of its customers should be offered credit and how much. The process of setting credit standards allows the firm to exercise a degree of control over the “quality” of accounts accepted. The quality of credit extended to customers is a multidimensional concept involving the following:

  • The time a customer takes to repay the credit obligation, given that it is repaid
  • The probability that a customer will fail to repay the credit extended to it

The average collection period serves as one measure of the promptness with which customers repay their credit obligations. It indicates the average number of days a company must wait after making a credit sale before receiving the customer’s cash payment. Obviously, the longer the average collection period, the higher a company’s receivables investment and, by extension, its cost of extending credit to customers. The likelihood that a customer will fail to repay the credit extended to it is sometimes referred to as default risk. The bad-debt loss ratio, which is the proportion of the total receivables volume a company never collects, serves as an overall, or aggregate, measure of this risk. A business can estimate its loss ratio by examining losses on credit that has been extended to similar types of customers in the past. The higher a firm’s loss ratio, the greater the cost of extending credit.

Credit Period

The length of a company’s credit period (the amount of time a credit customer has to pay the account in full) is frequently determined by industry customs, and thus it tends to vary among different industries. The credit period may be as short as seven days or as long as six months. Variation appears to be positively related to the length of time the merchandise is in the purchaser’s inventory. For example, manufacturers of goods having relatively low inventory turnover periods, such as jewellery, tend to offer retailers longer credit periods than distributors of goods having higher inventory turnover periods, such as food products.

A company’s credit terms can affect its sales. For example, if the demand for a particular product depends in part on its credit terms, the company may consider lengthening the credit period to stimulate sales. For example, IBM apparently tried to stimulate declining sales of its PCjr home computer by extending the length of the credit period in which dealers had to pay for the computers. In making this type of decision, however, a company must also consider its closest competitors. If they lengthen their credit periods, too, every company in the industry may end up having about the same level of sales, a much higher level of receivables investments and costs, and a lower rate of return.

Credit Terms

A company’s credit terms, or terms of sale, specify the conditions under which the customer is required to pay for the credit extended to it. These conditions include the length of the credit period and the cash discount (if any) given for prompt payment plus any special terms, such as seasonal datings. For example, credit terms of “net 30” mean that the customer has 30 days from the invoice date within which to pay the bill and that no discount is offered for early payment.

Credit Scoring

A credit rating is an assessment of the creditworthiness of a borrower in general terms or with respect to a particular debt or financial obligation. A credit rating can be assigned to any entity that seeks to borrow money an individual, corporation, state or provincial authority, or sovereign government.

Credit assessment and evaluation for companies and governments is generally done by a credit rating agency such as Standard & Poor’s (S&P), Moody’s, or Fitch. These rating agencies are paid by the entity that is seeking a credit rating for itself or for one of its debt issues.

Why Credit Ratings Are Important?

Credit ratings for borrowers are based on substantial due diligence conducted by the rating agencies. While a borrowing entity will strive to have the highest possible credit rating since it has a major impact on interest rates charged by lenders, the rating agencies must take a balanced and objective view of the borrower’s financial situation and capacity to service/repay the debt.

A credit rating not only determines whether or not a borrower will be approved for a loan, but also determines the interest rate at which the loan will need to be repaid. Since companies depend on loans for many start-up and other expenses, being denied a loan could spell disaster, and a high interest rate is much more difficult to pay back. Credit ratings also play a large role in a potential investor’s determining whether or not to purchase bonds. A poor credit rating is a risky investment; it indicates a larger probability that the company will be unable to make its bond payments.

It is important for a borrower to remain diligent in maintaining a high credit rating. Credit ratings are never static, in fact, they change all the time based on the newest data, and one negative debt will bring down even the best score. Credit also takes time to build up. An entity with good credit but a short credit history is not seen as positively as another entity with the same quality of credit but a longer history. Debtors want to know a borrower can maintain good credit consistently over time.

Factors Affecting Credit Ratings and Credit Scores

There are a few factors credit agencies take into consideration when assigning a credit rating to an organization. First, the agency considers the entity’s past history of borrowing and paying off debts. Any missed payments or defaults on loans negatively impact the rating. The agency also looks at the entity’s future economic potential. If the economic future looks bright, the credit rating tends to be higher; if the borrower does not have a positive economic outlook, the credit rating will fall.

For individuals, the credit rating is conveyed by means of a numerical credit score that is maintained by Equifax, Experian, and other credit-reporting agencies. A high credit score indicates a stronger credit profile and will generally result in lower interest rates charged by lenders. There are a number of factors that are taken into account for an individual’s credit score including payment history, amounts owed, length of credit history, new credit, and types of credit. Some of these factors have greater weight than others. Details on each credit factor can be found in a credit repo rt, which typically accompanies a credit score.

Short-Term vs. Long-Term Credit Ratings

A short-term credit rating reflects the likelihood of the borrower defaulting within the year. This type of credit rating has become the norm in recent years, whereas, in the past, long-term credit ratings were more heavily considered. Long-term credit ratings predict the borrower’s likelihood of defaulting at any given time in the extended future.

Monitoring the Debtors Techniques (DSO, Ageing Schedule)

1. Ratio Analysis for Control of Receivables:

The analysis of receivables can be done with the help of ratios given below for efficient management of debtors balances:

(a) Debtors Turnover Ratio:

Credit Sales / Average Debtors

(b) Average Credit Period (in days):

(Average Debtors / Credit Sales) * 365

(c) Debtors to Current Assets Debtors:

(Debtors / Current Assets) * 100

(d) Debtors to Total Assets Debtors:

(Debtors / Total Assets) * 100

(e) Bad Debts to Sales:

(Bad Debts / Sales) * 100

(f) Bad Debts to Debtors:

(Bad Debts / Debtors) * 100

The above formulae can be used to analyze the efficiency in management of receivables and to analyze the trend over a period of time.

Ageing Schedule:

The ageing schedule of debtors is prepared basing on the collection pattern. The total debtors balances are classified according to their age i.e. the outstanding period for which the amount is uncollected. The ageing schedule provides useful information for assessing the company’s liquidity position, efficiency of credit control department, efficiency in collection of receivables, comparison with previous ageing schedules etc.

The age analysis of debtors may be used to help decide what action to take about older debts. For better control on collection of receivables, ageing schedule is prepared and analyzed for identifying the overdue amounts. Ageing schedule of receivables is prepared according their period of outstanding, for example, less than 30 days, 31-45 days, 46 – 60 days, 61-75 days, 76-90 days, above 90 days etc.

The ageing schedule of debtors can be prepared manually or by computer. Preparation of the schedule requires to go back to the date on which invoice is raised. The schedule is used for identifying the quality accounts, overdue accounts and trouble some accounts. The age schedule can also incorporate the details of individual accounts, region wise accounts, industry sector wise accounts etc.

2. ABC Analysis of Receivables:

The ABC analysis technique mainly framed for effective control of inventory. The application of the same technique to manage the debtor’s balances will also give good results for the firm with huge number of accounts.

It is seen from the above table that only 20% of the total accounts represents the 70% of total debtors balance and a close scrutiny of these accounts and realization of dues in time will cost only moderately and improves the efficiency of debtors collection and also improve the liquidity of the firm and avoids unnecessary blockage of funds in debtors balances which can be invested elsewhere to obtain the opportunity cost of funds. To large extent it avoids the administration costs also.

Category B debtors balances needs moderate control and Category C balances, though large in number, but are very less in amount to the proportion of total debtors and the managerial attention should not be diverted to these balances. However, it also requires moderate attention for efficient management of debtors.

3. Discriminate Analysis and Credit Scoring:

Discriminate Analysis:

It is an important tool used for discriminating between good and bad accounts taking into account the readily available information from financial data relating to size of firm, acid test ratio, creditors payment period etc.

Credit Scoring:

It is a technique used in discriminating between good and bad accounts based on past repayment and default experience relating a particular customer. The credit scoring is given for each such customer and credit facility is extend if he exceeds the cut-off score.

4. Credit Utilization Report:

The total limit of credit offered to each customer and the extent to which it is utilized will be reviewed on periodical basis to observe the extent to which total limits being utilized. All this information is presented in a report form called ‘credit utilization report’.

An example of the report is given below:

This report will also contain the other information, such as day sales outstanding and so on. This report will reveal the following:

(a) The number of customers who might want more credit.

(b) The extent to which the company is exposed to debtors.

(c) The tightness of the credit policy.

(d) The degree of exposure to different customers.

5. Cost-Benefit Analysis of Collection Expenses:

A firm has to incur some routine costs like sending reminders, telephone expenses, expenses incurred for personal visits to customers’ places, commission and fees payable to collection agencies, legal expenses etc.

When the firm incurs more costs on collection of debts, there is likely to be less amount of debts turn into bad debts and vice versa. If the firm goes on increasing the cost of collection of debts, after- some point, there would not be further decrease of bad debts. The point is called ‘saturation point’ as shown in figure 16.1, if the firm incurs collection expenses beyond this point, cannot benefit the firm in reducing its bad-debt losses.

6. Measuring Day’s Sales in Terms of Debtors:

The total debtor represented by day’s sales is calculated in the following three ways:

Debtors Turnover Method:

The days sales in debtors ratio represents the length of the credit period taken by customers.

Count Back Method:

This method is based on the assumption that the debtors balance relating to the most current period sales.

Partial Month Period:

This method analyses each months sales and the unpaid portion. These are aggregated together to get days sales of debtors.

The partial month method not only provides the overall debtors ageing figure but also provides month-wise debtors outstanding.

Evolution of Organization Behavior

Organization

Organization as two or more individuals who are interacting with each other within a deliberately structured set up and working in an interdependent way to achieve some common objective/s. Organizations play a major role in pur lives. We possibly cannot think of a single moment in our lives when we are not depending on organizations in some form or the other. Right from the public transport that you use to come to your institute, the institutes   itself,   the   class   you   are   attending   at   this   moment,   are   all examples   of organizations.

What is Behavior?

It is the behavior of the people working in an organization to achieve common goals or objectives. Organization comprises of people with different attitudes, cultures, beliefs, norms and values.

So let us understand organizational behavior and what it exactly it means. “Organizational Behavior” can be defined as the study of what people think, feel, and do in and around organizations. The study of Organizational Behavior facilitates the process of explaining, understanding)   predicting,   maintaining,   and   changing   employee   behavior   in   an organizational setting. The value of organizational behavior is that: it isolates important aspects of the

manager’s job and offers specific perspective on the human side of management:

  • People as organizations
  • People as resources
  • People as people

In other words, it involves the understanding, prediction and control of human behavior and factors affecting their performance and interaction among the organizational members. And because organizational behavior is concerned specifically with employment – related situations, you should not be surprised to find that it emphasizes behavior as related- to concerns such as jobs, work, absenteeism, employment turnover, productivity, human performance and management.

Historical Development of Organization Behavior

Management Thought and Classical Administration Theory

Though the practice of management can definitely be traced back to ancient time say, during the era of building huge structures like pyramids in Egypt or temples in India or the churches, but the formal discipline of management as we find it today evolved only during the later part of nineteenth century.

  • Scientific management
  • Classical administration
  • The human relations approach
  • The systems approach
  • The contingency approach
  1. Scientific Management Frederick Taylor (1865-1915)

Frederick Taylor (1865-1915) was among the first to argue that management should be based on the following principle instead of depending on more or less hazy ideas: Well-matched

  • Clearly defined
  • Fixed principles

He pioneered the “scientific management’7 movement which suggested that systematic analysis could indicate “accurate” methods, standards and timings for each operation in an organization’s activities. The duty of management was to select, train and help workers to perform their jobs properly. The responsibility, of workers was simply to accept the new methods and perform accordingly. The practical application of this approach was to break each job down into its smallest and simplest component pans or “motions”. Each single motion in effect became a separate, specialized-job to be allocated -to a separate worker. Workers were selected and trained to perform such Jobs in the most efficient way possible, eliminating all wasted motions or unnecessary physical movement. A summary of scientific management, in Taylor’s own words, might be as follows.

(a) The man who is fit to work at any particular’ trade is unable to understand the science of that trade without the kind help and co-operation of men of a totally different type of education.

(b) It is one of the principles of scientific management to ask men to do things in the right way, to learn something new, to change their ways in accordance with the science and in return to receive an increase of from 30% to 100% in pay.

An Appraisal of Scientific Management Today

Alterations to pnor wnrV  mpthndn  nnd   inpffirinnl   mimPnts are  used today,   both to increase productivity and to reduce physical strain on workers. However, it has now been recognized that performing only one ‘motion’ within a job is profoundly unsatisfying to workers: operations need to be re-integrated into whole Jobs. It has also been recognized that workers can and should take more responsibility for planning and decision-making in connection with their work.

Looking back on scientific management as an approach, Hicks writes: “by the end of the scientific management period, the worker had been reduced to the role of an impersonal cog in the machine of production. His work became more and more narrowly specialized until he had little appreciation for his contribution to the total product… Although very significant technological advances were made… the serious weakness of the scientific approach of management was that it de-humanized the organizational member who became a person without emotion and capable of being scientifically manipulated, just like machines.

Frederic Taylor’s Five Principles of Management

  • Develop a science for each element of an individual’s work
  • Scientifically select, train and develop the worker
  • Heartily cooperate with the workers
  • Divide work & responsibility equally between managers & workers
  • Improve production efficiency through work studies, tools, economic incentives
  1. Classical Administration Theory of Management

Henri Fayol (1941-1925) was a French industrialist who put forward and popularized the concept of the “universality of management principles.” In other words, he advocated that all organizations could be structured and managed according to certain rational principles. Fayol himself recognized that applying such principles in practice was not simple: “Seldom do we have to apply the same principles twice in identical conditions; Contribution must be made for different changing circumstances.” Among his principles of rational organization, however, were the following influential ideas.    *.

Division of work Dividing the work into small convenient components and giving each component to one employee. It encourages employees for continuous improvement in skills

The development of improvements  in methods.     

  • Authority: The right to give orders and the power to exact obedience.
  • Discipline: No slacking, bending of rules.
  • Unity of command: Each employee has one and only one boss.
  • Unity of direction: A single mind generates a single plan and all play their part in that plan.
  • Subordination of individual interests: When at work, only work things should be pursued or thought about.
  • Remuneration: Employees receive fair payment for services, not what the company can getaway with.
  • Centralization: Consolidation of management functions. Decisions are made from the lop.
  • Scalar chain (line of authority): Formal chain of command running from top to bottom of the organization, like military
  • Order: All materials and personnel have a prescribed place, and they must remain there.
  • Equity: Equality of treatment (but not necessarily identical treatment)
  • Personnel tenure: Limited turnover of personnel. Lifetime employment for good workers’
  • Initiative: Thinking out a plan and do what it takes to make it happen.
  • Esprit de corps: Harmony, cohesion among personnel.

Out of the these, the most important elements are specialization, unity of command, scalar chain, and, coordination by managers (an amalgamation of authority and unity of direction).

Art appraisal of classical administration

Many organizations continued to be managed on the rational lines of classical theory. But such organizations have certain drawbacks. An organization structured on classical lines   is   often  identified   as   a   “bureaucracy.”   While   its   formality,   rationality   and  impersonality make it very stable and efficient in some respects, it has proved dysfunctional in other areas. A bureaucracy is stable partly because of its rigid adherence to its rules and procedures and the chain of command, but this rigidity also makes it:

  • Very slow to respond to customer/consumer demands
  • Very slow to respond to change in its business environment in terms of technology, competitors, new market trends.
  • Very slow to learn from its mistakes Human Relations Movement

Human Relations Movement is a place where we will study the human relations school of management which was established after scientific management school. The fast-changing business environment of the late 20th century made it very difficult for classical organizations to compete. Flexibility and innovation began to challenge stability; diversity began to challenge “universal”, “one-size-fits-all” principles of Management, multi-skilled project teams were seen to be more responsive to consumer demands than specialized, one-man-one-boss structures; the scalar chain of command was decimated by ‘delayering’ in response to economic recession and other forces.

Nevertheless, classical thinking allowed practicing managers to step back and analyze their experience in order to produce principles and techniques for greater efficiency and effectiveness. This emphasis resulted from a famous set of experiments (the Hawthorne Studies) carried out by Mayo and his colleagues for the Western Electric Company in the USA.

The company was using a group of girls as “guinea pigs” to assess the affect of lighting on productivity. They were amazed to find that productivity shot up, whatever they did with the lighting. Their conclusion was that /’Management,- by consultation with the girl workers, by clear explanation of the proposed experiments and the reasons for them, by accepting the workers verdict in several instances, unwittingly scored a success in two most important human matters – the girls became a self-governing team, and a learn that cooperated whole heartedly with management.”

  1. Human Relations Movement and Behaviorist Schools of Management

The human relations movements actually started with the series of experiments conducted )Y George Elton Mayo, professor of Industrial Research at the Harvard Graduate School of Business and his colleagues at the Hawthorne plant of Western Electric Company. This company was a manufacturer of equipment for the Bell telephone system and at the time of the experiments, there was an acute problem of employee dissatisfaction at the plant. It was also quite evident that the employees were not producing up to their fullest capability. This happened in spite of the fact that it was one of the most progressive companies with pension schemes, sickness benefit schemes, and numerous other facilities offered   to   its   employees.   The   earlier   attempts   of   the   efficiency   experts   produced inconclusive findings. So the company sought help from the group of university professors to find a solution to the problem. The study continued for an extended period of time and had gone’ through various phases, which is briefly described here.

  • Phase I: Illumination Experiments
  • Phase II: Relay Assembly Test Room
  • Phase III: Interviewing Program
  • Phase IV: Bank Wiring Test Room °

Phase I: illumination Experiments

In order to test the traditional belief that better illumination will lead to higher level of productivity, two groups of employees were selected. In one, the control group, the illumination remained unchanged throughout • the  experiment whilein the other the illumination was increased. As had been expected, the productivity went up in the latter or what was known as the experimental group, but what baffled the experimenters was the fact that the output of the control group also went up. As the lighting in the formal group was not altered, the result was naturally puzzling and difficult to explain. The investigators then started to reduce the illumination for the test group. But in this case as well the output shoot up again. Thus the researchers had to conclude that illumination affected production only marginally and there must be some factor which produced this result.

Phase II: Relay Assembly Test Room

In this phase, apart from illumination, possible effects of other factors such as length of the working day, rest pauses and their duration and. frequency and other physical conditions; were probed. The researcher who was continuously present with the group to observe the functioning of the group acted as their friend and guide. Surprisingly, here also the researchers found that the production of’ the group had no relation with the working conditions. The outcome of the group went increasing at an all-time high even when all the improvements in the working conditions were withdrawn. Nobody in the group could suggest why this was so. Researchers then attributed this phenomenon to the following:

  • Feeling of perceived importance among the group members as they were chosen to participate in the experiment.
  • Good relationship among the group
  • High group cohesion.

Phase III: Interviewing Program

From the Relay Assembly Test Room, the researchers for the first time became aware about the existence of informal groups and the importance of social context of the organizational life. To probe deeper into this area in order to identify the factors responsible for human behavior, they interviewed more than 20,000 employees. The direct questioning was later replaced by non-directive type of interviewing. The study revealed that the workers’ social relationship inside the organizations has a significant influence on their attitude and behavior. It was also found that merely giving a person an opportunity to talk and air his grievances has a beneficial effect on his morale.

Phase IV: Bank Wiring Test Room

It had been discovered that social groups in an organization have considerable influence on the functioning of the individual members. Observers noted that in certain departments, output had been restricted by the workers in complete disregard to the financial incentives offered by the organization. Mayo decided to investigate one such department which was known as the bank wiring room where there were fourteen men working on an assembly line.

 Thus the Hawthorne study pointed out the following:

  • The business organization is essentially a socio-technical entity where the process of social interactions among its members is also extremely important.
  • There is not necessarily a direct correspondence between working conditions and high production.
  • Economic motives are not the only motive for an employee. One’s social needs can also significantly affect their behavior. Employee-centered leaders always tend to be more effective than the task-oriented leaders.
  1. Systems Approach

The Systems Approach to OB views the organization as a united, purposeful system composed of interrelated parts.

This approach gives managers a way of looking at the organization as a whole, whole, person, whole group, and the whole social system.

In so doing, the systems approach tells us that the activity of any segment of an organization affects, in varying degrees the activity of every other segment. A systems view should be the concern of every person in an organization.

The clerk at a service counter, the machinist, and the manager all work with the people and thereby influence the behavioral quality of life in an organization and its inputs.

Managers, however, tend to have a larger responsibility, because they are the ones who make the majority are people oriented.

The role of managers, then, is to use organizational behavior to help build an organizational culture in which talents are utilized and further developed, people are motivated, teams become productive, organizations achieve their goals and society reaps the reward.

  1. Contingency theory

The contingency approach to organization developed as a reaction to the idea that there nothing like “One best way” for designing organizations, motivating staff and so on. The basic tenet of contingency theory can be put essentially as follows?

Appropriate management approach   depends ‘ on   situational   factors   faced   by   an organization.

Newer research indicated that different forms of organizational structure could be equally successful that there was no inevitable-link between classical organization structures and effectiveness, and that there were a number of variables to be considered in the design of organizations and their style of management.

Essentially, “it all depends’ on the total strength and weakness of organization and opportunities and threats which lies out in the environment of each organization.” Managers have to find a “best fit’ between the demands of:

(a) The tasks

(b) The people

(c) The environment

In other word Manager should consider situation .We would note contingency approaches to various aspects of management as we proceed through this module.

An appraisal of the contingency approach

Importance of Organizational Behaviour

OB can touch every spectrum of business competitiveness by explaining, predicting, and influencing the behaviour of people.

  1. Creates Sustainable Competitive Advantage

OB converts people in an organization into valuable, rare, inimitable, and non-substitutable through various OB practices aligned to achieve goals. For example, OB can create a culture of innovation, performance, knowledge sharing, and trust through a combination of individual development, team design, and leadership development.

Google would meet this bill and this is the reason why it is difficult to beat them. Though OB deals with developing people in the organization, its reverberations can be felt by the customers too. If the employees are not happy or do not behave appropriately with the customers, the result can be disastrous.

  1. Individual Component

This illustrates that OB is important to accomplish the following:

  • Identify the underlying reasons for poor or non-performance and enable change.
  • Help a person to modify his/her behaviour to achieve full potential by identifying what motivates a person, how the person can learn and be more creative, and manage stress. In other words, OB can facilitate tak­ing a whole gamut of actions required for the person to contribute to competitiveness.

Example: Rajiv is not able to get results in sales and finds the job very stressful. His boss suspects his introvert nature. If we had a psychometric test before selecting him for the job, this situation could have been avoided. If we erred in selection, we can still confirm his personality trait and shift him to another job profile where he can succeed. A third alternative is to train him to change his behaviour.

  1. Organizational Component

OB helps in designing, structuring, and changing culture to create a learning and innovative organization. It suggests ways to implant an organizational sub-culture within the overall culture.

For instance, although employees and organizations in Kerala respond to frequent ‘hartals’ (enforced stoppage of work as a method of protest adopted by political parties in India), employees of various organizations working in the Technopark in Trivandrum, the capital of Kerala, where the IT industries are located, do not participate in such hartals. It shows the existence of a sub-culture in companies located in the Technopark.

  1. Controlling and predicting human behaviors

Organization behavior is a socio-science so it’s all concern with individuals and its behavior. It’s quite important to study OB to control the human behaviors. OB also helps us to control and predict the employee’s behavior in the different situation. For example: if the company has an order to complete on urgent base than it necessary to work extra hours. So in this situation, some employees can get angry and reject to work extra hours. OB helps in this type of situation. A person who studies the OB will easily manage that situation.

If the manager can interpret properly the human needs of an enterprise, it may paintings towards fulfilling those desires and also challenges new plans and incentives to satisfy the employees and boost them morals.

  1. Company culture

OB helps to define the company culture like experience, rules, values and behavioral expectation of an industry.  Every organization has their own rules and regulation. Some have a liberal mind and some have conservative, so they make the values, rules according to them. OB tells you how the company culture can negatively and positively impact on employee’s behavior. And how company culture mediates to the employee in different ways, including mission, action, reward, and customs. An employee can learn how to behave by becoming socialized in an organization. Becoming socialized, the employee also gains to understand the company culture.

Affecting human behavior is another aspect of studying organizational behavior. It helps the management to evaluate the reaction of employees beforehand, prior to making any modifications in regulations or schemes.

  1. Problem-solving

As in the workplace, the occurring problem is normal but how its solve it? Can impact on the employee. As we already discuss each employee differing from each other. So, it a little bit difficult to make a strong connection between them and solving the problem according to each behavior. For solving the problems in an industry, it’s important to consider social and psychological aspect to design solution tools and techniques to solve industrial issues.

  1. Improving industrial relation

It’s very important to manage and improve the industrial relationship because the organization is based on the positive relationship between management and employee. We can develop the positive relationship by encouraging and rewarding the employee. By encouraging and rewarding, the employee self-actualization or moral can also be developed. This would be a good impact on the work environment. OB helps to find the root causes of the problems that occur during work and control its negative outcomes.

error: Content is protected !!