The project cost is a cost required to procure all the needed products, services and resources to deliver the project successfully.
Example: In an example of a construction project, the cost estimation starts from land acquisition cost, construction cost, materials cost, administration cost, labor cost and other direct and indirect costs.
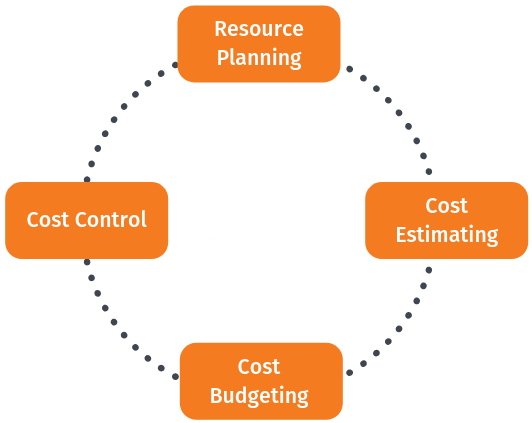
Cost management is concerned with the process of finding the right project and carrying out the project the right way. It includes activities such as planning, estimating, budgeting, financing, funding, managing, controlling, and benchmarking costs so that the project can be completed within time and the approved budget and the project performance could be improved in time.
Step 1: Resource planning
Resource planning is the process of ascertaining future resource requirements for an organization or a scope of work. This involves the evaluation and planning of the use of the physical, human, financial, and informational resources required to complete work activities and their tasks. Most activities involve using people to perform work. Some activities involve materials and consumables. Other tasks involve creating an asset using mainly information inputs (e.g., engineering or software design). Usually, people use tools such as equipment to help them. In some cases, automated tools may perform the work with little or no human effort.
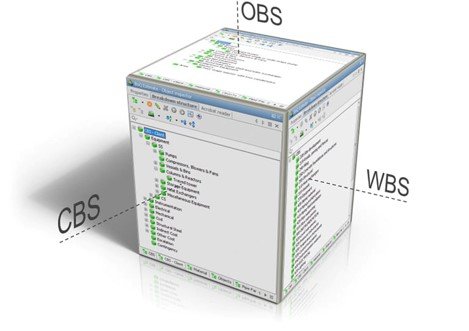
Resource planning begins in the scope and execution plan development process during which the work breakdown structure, organizational breakdown structure (OBS), work packages, and execution strategy are developed. The OBS establishes categories of labor resources or responsibilities; this categorization facilitates resource planning because all resources are someone’s responsibility as reflected in the OBS.
Resource estimating (usually a part of cost estimating) determines the activity’s resource quantities needed (hours, tools, materials, etc.) while schedule planning and development determines the work activities be performed. Resource planning then takes the estimated resource quantities, evaluates resource availability and limitations considering project circumstances, and then optimizes how the available resources (which are often limited) will be used in the activities over time. The optimization is performed in an iterative manner using the duration estimating and resource allocation steps of the schedule planning and development process.
Step 2: Cost estimating
Cost estimating is the predictive process used to quantify, cost, and price the resources required by the scope of an investment option, activity, or project. It involves the application of techniques that convert quantified technical and programmatic information about an asset or project into finance and resource information. The outputs of estimating are used primarily as inputs for business planning, cost analysis, and decisions or for project cost and schedule control processes.
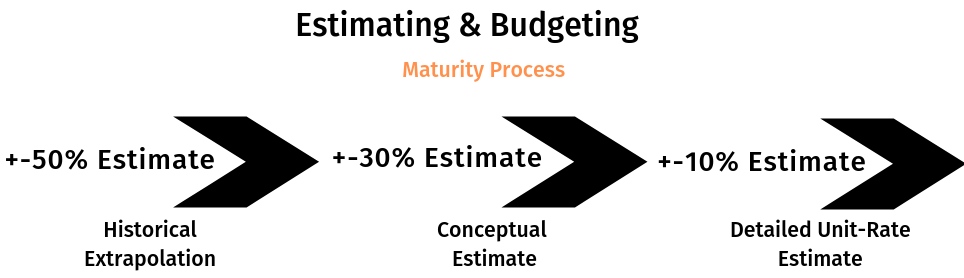
The cost estimating process is generally applied during each phase of the asset or project life cycle as the asset or project scope is defined, modified, and refined. As the level of scope definition increases, the estimating methods used become more definitive and produce estimates with increasingly narrow probabilistic cost distributions.
Cost estimating could be performed by dedicated software systems like Cleopatra Enterprise cost estimating and project cost databases like CESK that are created and maintained to support the various types of estimates that need to be prepared during the life cycle of the asset or project.
Step 3: Cost budgeting
Budgeting is a sub-process within estimating used for allocating the estimated cost of resources into cost accounts against which cost performance will be measured and assessed. This forms the baseline for cost control. Cost accounts used from the chart of accounts must also support the cost accounting process. Budgets are often time-phased in accordance with the schedule or to address budget and cash flow constraints.
Step 4: Cost control
Cost control is concerned with measuring variances from the cost baseline and taking effective corrective action to achieve minimum costs. Procedures are applied to monitor expenditures and performance against the progress of a project. All changes to the cost baseline need to be recorded and the expected final total costs are continuously forecasted. When actual cost information becomes available an important part of cost control is to explain what is causing the variance from the cost baseline. Based on this analysis corrective action might be required to avoid cost overruns.
Below figure is a process map for project performance measurement. This process should be run in a continuous improvement cycle until project completion:
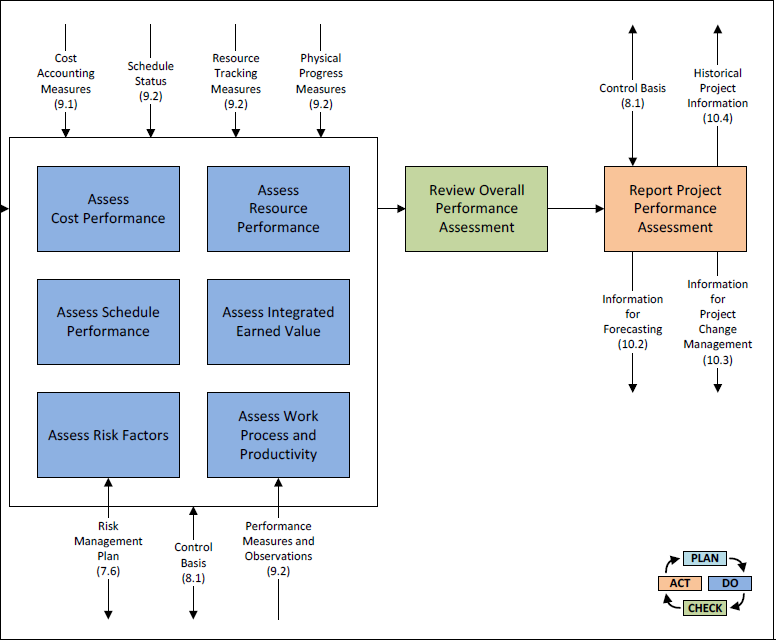
The process for performance assessment starts with planning and having the right tools in place. Dedicated cost control software tools can be valuable to define cost control procedures, track and approve changes and apply analysis. Furthermore, reporting can be enhanced and simplified which makes it easier to inform all stakeholders involved in the project.
Cleopatra Cost Control helps you achieve
- Project cost control and always tracing back cost components to its original budget.
- Scope change management. Estimate costs and add it to your project controls document.
- Project completed? The feedback process will be in place. Send the actuals to your cost models to increase their accuracy and quality for future estimating. Where most tools are limited to either being cost estimating software or a cost control tool, Cleopatra Enterprise is both.
Bonus Step: Benchmarking
As a bonus step, it is wise to add Benchmarking to the project cost management process.
Benchmarking helps close the loop between project A and project B. The knowledge from project A (referring to the running and executed projects) are analyzed and the feedback is reflected in project B (the next projects). That’s how an improvement cycle is created to increase project performance. Benchmarking is widely used by technical industries to improve the performance of the projects. Software systems such as Cleopatra project benchmarking aid estimators and project controllers in answering the complex question: How to use project big data to execute projects within time and budget?
The goal of project benchmarking is to store data from executed and running projects to extract valuable project metrics and to benchmark current estimates. Performing statistical analysis on historical data can result in valuable information on relationships between variables, which can be used to set up a reliable cost knowledgebase or calibrate existing ones.

It is important to note that project benchmarking does not only include the comparison between projects, as it is also interesting to compare revisions within a project.
What you can achieve with Cleopatra Benchmarking
- Collect historical project data that can provide valuable analysis and project comparison to make critical business decisions.
- Benchmark your estimates against your previous projects and improve your cost estimate significantly.
- Extract metrics across projects to enhance future cost estimating accuracy.
- Develop meaningful and interactive reports.
- Export & Import data easily from Excel.
Types of Cost
-
Direct Cost
A direct cost is a price that can be directly tied to the production of specific goods or services. A direct cost can be traced to the cost object, which can be a service, product, or department. Direct and indirect costs are the two major types of expenses or costs that companies can incur. Direct costs are often variable costs, meaning they fluctuate with production levels such as inventory. However, some costs, such as indirect costs are more difficult to assign to a specific product. Examples of indirect costs include depreciation and administrative expenses.
Direct Costs Examples: Any cost that’s involved in producing a good, even if it’s only a portion of the cost that’s allocated to the production facility, are included as direct costs. Some examples of direct costs are listed below:
- Direct labor
- Direct materials
- Manufacturing supplies
- Wages for the production staff
- Fuel or power consumption
Because direct costs can be specifically traced to a product, direct costs do not need to be allocated to a product, department, or other cost objects. Direct costs usually benefit only one cost object. Items that are not direct costs are pooled and allocated based on cost drivers.
-
Indirect cost
Indirect Costs are costs that are not directly accountable to a cost object (such as a particular project, facility, function or product). Indirect costs may be either fixed or variable. Indirect costs include administration, personnel and security costs. These are those costs which are not directly related to production. Some indirect costs may be overhead. But some overhead costs can be directly attributed to a project and are direct costs.
There are two types of indirect costs. One are the fixed indirect costs which contains activities or costs that are fixed for a particular project or company like transportation of labor to the working site, building temporary roads, etc. The other are recurring indirect costs which contains activities that repeat for a particular company like maintenance of records or payment of salaries.
-
Recurring Cost
A Recurring Cost is a regularly occurring cost or estimated cost which is documented with one record a Recurring Cost record that describes the income or expense and its pattern (how often it occurs, the rate at which it increases or decreases, the time period during which the cost applies, and so forth). Recurring costs are stored in the Recurring Costs table
Recurring Costs provide a means of quickly modeling the major components of your finances. You first establish a series of recurring costs to represent such items as tax expenses, estimated maintenance costs, and monthly income from leases. Once you enter this information, you can use these costs to generate Cost, Cash Flow, and Base Rent reports.
Recurring Cost Examples
Use recurring costs to:
- Record fixed expenses and income, or costs that change at a fixed rate – For costs that are fairly static, enter one Recurring Cost record describing the cost, rather than create individual Scheduled Cost records for each time you encounter this cost. For example, enter one Recurring Cost record describing your monthly rent for a year rather than enter 12 Scheduled Cost records for each rent bill. For costs that change at a fixed rate, complete the Yearly Factor field of the Recurring Costs table.
- Record estimates of your expenses and income – Rather than enter the exact amount of each monthly utility bill as a Scheduled Cost, enter a monthly estimate with a Recurring Cost record by completing the Period field with “Month”, the Amount-Expense with an estimate of the monthly bill, and the Start Date field. Since utilities are ongoing costs do not complete the End Date field.
- Model seasonal costs – If you incur landscaping costs only between April and September, create a Recurring Cost record for landscaping with a Seasonal Start Date of April 01 and a Seasonal End Date of September 01 (the year value is ignored). The system will only consider this recurring cost during the specified time frame.
-
Non- Recurring Cost
Unusual charge, expense, or loss that is unlikely to occur again in the normal course of a business. Non recurring costs include write offs such as design, development, and investment costs, and fire or theft losses, lawsuit payments, losses on sale of assets, and moving expenses. Also called extraordinary cost.
-
Fixed Cost
A fixed cost is a cost that does not change with an increase or decrease in the amount of goods or services produced or sold. Fixed costs are expenses that have to be paid by a company, independent of any specific business activities. In general, companies can have two types of costs, fixed costs or variable costs, which together result in their total costs. Shutdown points tend to be applied to reduce fixed costs.
-
Variable Cost
A variable cost is a corporate expense that changes in proportion to production output. Variable costs increase or decrease depending on a company’s production volume; they rise as production increases and fall as production decreases. Examples of variable costs include the costs of raw materials and packaging.
- A variable cost is a corporate expense that changes in proportion with production output.
- Variable costs are dependent on production output.
- A variable cost can increase or decrease depending on several factors, as opposed to a fixed cost which is one-time or constant.
The total expenses incurred by any business consist of fixed costs and variable costs. Fixed costs are expenses that remain the same regardless of production output. Whether a firm makes sales or not, it must pay its fixed costs, as these costs are independent of output.
Examples of fixed costs are rent, employee salaries, insurance, and office supplies. A company must still pay its rent for the space it occupies to run its business operations irrespective of the volume of product manufactured and sold. Although fixed costs can change over a period of time, the change will not be related to production.
Variable costs, on the other hand, are dependent on production output. The variable cost of production is a constant amount per unit produced. As the volume of production and output increases, variable costs will also increase.
Conversely, when fewer products are produced, the variable costs associated with production will consequently decrease. Examples of variable costs are sales commissions, direct labor costs, cost of raw materials used in production, and utility costs. The total variable cost is simply the quantity of output multiplied by the variable cost per unit of output.
There is also a category of costs that falls in between, known as semi-variable costs (also known as semi-fixed costs or mixed costs). These are costs composed of a mixture of both fixed and variable components. Costs are fixed for a set level of production or consumption and become variable after this production level is exceeded. If no production occurs, a fixed cost is often still incurred.
-
Normal Cost
Normal costing is cost allocation method that assigns costs to products based on the materials, labor, and overhead used to produce them. In other words, it’s a way to find the price of an item that is being produced using three different cost factors (which make up the product cost).
The product costs that make up normal costing are actual materials, actual direct costs and manufacturing overhead. The materials and direct costs are the true costs that are associated with producing the item such as raw materials (the materials that make up the product) and labor.
-
Expedite Cost
“Expedite Fees” are fees added to another fee, often a fee for service, to ensure that the service provided will be expedited, meaning that it will be provided sooner than the same service would be provided without such a fee.
 by
by