Labour Turnover, Meaning, Causes and Effects

Labour Turnover refers to the establishment of a relationship between the number of employees leaving during a period of time to the average number of employees during that period. It may also denote the percentage change in the labour force of an organisation.

A higher percentage of labour turnover will mean that employees are not stable and new employees join while old employees leave the organisation. A lower labour turnover, on the other hand, means that only small number of employees have come in and gone out of the organisation.

The extent of labour turnover can be judged with the help of following formulas:

(a) Separation Rate Method:

Labour Turnover = No. of workers separated during the period/Average number of workers during the period x 100. In this method the number of persons separating from the organisation in a particular period is counted and this figure is divided by the average number of workers in that period to find out labour turnover rate.

(b) Replacement Rate Method:

In this method the number of workers replaced, and not separated is taken into account. For example, if 100 workers have left the organisation in a particular period but 80 persons have joined on their place, the figure of 80 will be used for calculating labour turnover rate.

Labour Turnover = No. of persons replaced during the period/Average number of persons during the period x 100

(c) Labour Flux Rate Method:

Flux Rate Method takes into account both the separations and their replacements. The number of persons who have left the organisation and those who have joined their place are totalled for calculating labour turnover.

Labour Turnover = No. of workers separated during the period + No. of workers replaced during the period/Average number of persons during the period x 100

Any of these three formulas may be used for calculating labour turnover rate. Once this percentage is calculated with the help of a specific method, the same should be used again for finding out comparable position. Every organisation should try to keep labour turnover to the minimum because workers are an asset and they should be retained for as much period as possible.

Causes of Labour Turnover:

  • Personal causes
  • Unavoidable causes
  • Avoidable causes

1. Personal Causes:

Workers may leave the organisation purely on personal grounds, e.g.

  • Domestic troubles and family responsibilities.
  • Retirement due to old age.
  • Accident making workers permanently incapable of doing work.
  • Women workers may leave after marriage in order to take up household duties.
  • Dislike for the job or place.
  • Death.
  • Workers finding better jobs at some other places.
  • Workers may leave just because of their roving nature.
  • Cases involving moral turpitude.

In all such cases, labour turnover is unavoidable and the employer can practically do nothing to reduce the labour turnover.

2. Unavoidable Causes

In certain circumstances it becomes necessary for the management to ask some of the workers to leave the organisation.

These circumstances may be as follows:

  • Workers may be discharged due to insubordination or inefficiency.
  • Workers may be discharged due to continued or long absence.
  • Workers may be retrenched due to shortage of work.

3. Avoidable Causes

(a) Low wages and allowances may induce workers to leave the factory and join other factories where higher wages and allowances are paid.

(b) Unsatisfactory working conditions e.g., bad environment, inadequate ventilation etc. leading to strained relations with the employer.

(c) Job dissatisfaction on account of wrong placement of workers may become a cause of leaving the organisation.

(d) Lack of accommodation, medical, transport and recreational facilities.

(e) Long hours of work.

(f) Lack of promotion opportunities.

(g) Unfair methods of promotion.

(h) Lack of security of employment.

(i) Lack of proper training facilities.

(J) Unsympathetic attitude of the management may force the workers to leave.

Effects of Labour Turnover:

There must be some labour turnover due to personal and unavoidable causes. It has been observed by employers that a normal labour turnover, which is between 3% and 5%, need not cause much anxiety. But a high labour turnover is always detrimental to the organisation. The effect of excessive labour turnover is low labour productivity and increased cost of production.

This is due to the following reasons:

  1. Frequent changes in the labour force give rise to interruption in the continuous flow of production with result that overall production is reduced.
  2. New workers take time to become efficient. Hence lower efficiency of new workers increases the cost of production.
  3. Selection and training costs of new workers recruited to replace the workers who have left increase the cost of production.
  4. New workers being unfamiliar with the work give more scrap, rejects and defective work which increase the cost of production.
  5. New workers being inexperienced workers cause more depreciation of tools and machinery. Due to faulty handling of new workers, breakdown of tools and machinery may also occur very often and hamper production.
  6. New workers being inexperienced workers are more prone to accidents. Consequently, all costs associated with accidents such as loss on account of output lost, compensation for the injured workers, damage of materials and equipment due to accidents etc. increase the cost of production.

Causes of Labour Turnover

Labour turnover refers to the rate at which employees leave an organisation and are replaced by new workers. High labour turnover increases recruitment and training costs, reduces productivity, and affects quality. The causes of labour turnover can be broadly classified into personal causes, organisational causes, industrial causes, and external causes.

  • Personal Causes

Personal causes are related to the individual circumstances of employees. These include illness, poor health, old age, family responsibilities, marriage, migration, or change of residence. Sometimes employees leave due to lack of interest in the job or mismatch between their skills and job requirements. Such causes are generally beyond the control of management but contribute significantly to labour turnover.

  • Organisational Causes

Organisational causes arise due to inefficiencies in management policies and practices. Low wages, irregular payment of wages, lack of incentives, poor working conditions, absence of promotion opportunities, and job insecurity lead employees to quit. Poor supervision, harsh discipline, and lack of recognition also demotivate workers. These causes are largely controllable and require effective labour management.

  • Industrial Causes

Industrial causes are related to the nature of the industry. Seasonal industries, such as sugar or construction, experience high labour turnover due to temporary employment. Industries involving hazardous work, long working hours, or monotonous jobs also face higher turnover. Lack of job satisfaction and limited career growth in certain industries push workers to seek alternative employment.

  • Economic Causes

Economic factors such as inflation, rising cost of living, and availability of better-paying jobs elsewhere encourage employees to change jobs. During periods of economic growth, labour turnover increases as workers have more employment opportunities. Conversely, during recession, turnover may reduce due to job insecurity.

  • Technological Causes

Technological changes and automation may lead to displacement of workers who lack technical skills. Introduction of new machines or production methods can make certain jobs obsolete, forcing workers to leave. Fear of redundancy and lack of training opportunities also contribute to labour turnover.

  • Psychological Causes

Psychological factors such as lack of motivation, job dissatisfaction, stress, and low morale lead to voluntary resignations. Poor relationships with supervisors or colleagues, absence of teamwork, and lack of employee engagement also increase labour turnover.

  • External Causes

External causes include government policies, labour laws, trade union activities, and social factors. Changes in labour regulations, industrial disputes, or political instability can affect employment continuity. Attractive employment opportunities in other regions or industries also lead to higher labour turnover.

Reduction of Labour Turnover:

As already pointed out, normal labour turnover is advantageous because it allows injection of fresh blood into the firm. But excessive labour turnover is not desirable because it shows that labour force is not contended. Therefore, every effort should be made to remove the avoidable causes which give rise to excessive labour turnover.

Following steps may be taken to reduce the labour turnover:

  • A suitable personnel policy should be framed for employing the right man for the right job and giving a fair and equal treatment to all workers.
  • Good working conditions which may be conducive to health and efficiency should be provided.
  • Fair rates of pay and allowances and other monetary benefits should be introduced.
  • Maximum non-monetary benefits (i.e., fringe benefits) should be introduced.
  • Distinction should be made between efficient and inefficient workers by introducing incentive plans whereby efficient workers may be rewarded more as compared to inefficient workers.
  • An employee suggestion box scheme should be introduced whereby workers who suggest improvements in the method of production should be suitably rewarded.
  • Men-management relationships should be improved by encouraging labour participation in management.

In addition to the above steps, the personnel department should prepare periodical reports on the labour turnover listing out the various reasons due to which workers have left the organisation. The report should be sent to the management with the necessary recommendations so that corrective measures may be taken to reduce labour turnover.

Cost of Labour Turnover:

The cost of labour turnover can be divided under two heads:

(i) Preventive Costs.

(ii) Replacement Costs.

(i) Preventive Costs:

These are costs which are incurred to prevent excessive labour turnover. The aim of these costs is to keep the workers satisfied so that they may not leave the factory.

These costs may include:

  • Cost of providing good working conditions.
  • Cost of providing medical, housing and recreational facilities to workers.
  • Cost of providing educational facilities to the children of the workers.
  • Cost of providing subsidised meals.
  • Cost of providing other welfare facilities.
  • Cost of providing safety measures against working conditions.
  • Measures of security and retirement benefits such as pension, gratuity, employer’s contribution to provident fund and other measures over and above the compulsory legal provisions.

As “prevention is better than cure” preventive cost should be incurred to prevent excessive labour turnover. This cost of labour turnover should be apportioned among different departments on the basis of average number of employees in each department and justifiably treated as overhand.

If preventive cost is incurred for reasons of image or status of the employer or non-economical corporate goals, it may be debited to the Costing Profit and Loss Account. If preventive cost is incurred for a particular department, it may be taken as overhead of that department.

(ii) Replacement Costs:

These costs are associated with replacement of workers and include:

  1. Cost of recruitment of new workers.
  2. Cost of training new workers.
  3. Loss of production due to

(a) Interruption in production, and

(b) Inefficiency of new workers.

  1. Loss of profit due to loss of production.
  2. Loss in fixed overhead cost because of less production on account of new inexperienced workers.
  3. Wastage due to excessive spoilage on account of inept handling of machines, tools and materials by new workers recruited as a result of labour turnover.
  4. Cost of accidents because of new workers having more proneness to accidents.

These costs should be distributed among different departments on the basis of actual number of workers replaced in each department and treated as overhead.
Role of Management Information System (MIS)

Simply MIS stand For Management Information System. For Simply Understanding Management Information System (MIS) we can divide in to three Word and Understand Part by part

  • Management: “Management is function to do the work at the Right time, by the right Person, For the Right Job.”
  • Information: “Information is the Collection of Organized data which plays a Vital Role for decision making.”
  • System: “System Consist for a set of elements which Provides a Framework to convert Unorganized (Data) into Organized Information.”

Role of Management Information System

Management information system (MIS) has become Very Necessary due to Emergence of high complexity in Business Organization. It is all to know that without information no Organization can take even one step properly regarding the decision making process. Because it is matter of fact that in an organization decision plays an essential role for the achievement of its objectives and we know that every decision is based upon information. If gathered information are irrelevant than decision will also incorrect and Organization may face big loss & lots of Difficulties in Surviving as well.

  1. Helps in Decision making

Management Information System (MIS) plays a significant Role in Decision making Process of any Organization. Because in Any organization decision is made on the basis of relevant Information and relevant information can only be Retrieving from the MIS.

  1. Helps in Coordination among the Department

Management information System is also help in establishing a sound Relationship among the every persons of department to department through proper exchanging of Information’s.

  1. Helps in Finding out Problems

As we know that MIS provides relevant information about the every aspect of activities. Hence, If any mistake is made by the management then Management Information Systems (MIS) Information helps in Finding out the Solution of that Problem.

  1. Helps in Comparison of Business Performance

MIS store all Past Data and information in its Database. That why management information system is very useful to compare Business organization Performance. With the help of Management information system (MIS) Organization can analyze his Performance means whatever they do last year or Previous Years and whatever business performance in this year and also measures organization Development and Growth.

Components

A Management Information System (MIS) comprises five key components – people, business processes, data, hardware, and software. These components work collaboratively to achieve the organization’s objectives and ensure smooth operations.

People:

Users of the information system, such as accountants, human resource managers, etc., record day-to-day business transactions. The ICT department supports these users, ensuring the system’s proper functioning.

Business Procedures:

Agreed-upon best practices that guide users and other components in working efficiently. These procedures are developed by various stakeholders, including users and consultants.

Data:

Recorded day-to-day business transactions, collected from various activities like deposits and withdrawals for a bank.

Hardware:

The physical equipment like computers, printers, and networking devices that provide computing power for data processing, as well as networking and printing capabilities. Hardware accelerates the transformation of data into valuable information.

Software:

Programs that run on the hardware. Software is divided into system software (e.g., operating systems like Windows, Mac OS, Ubuntu) and applications software (e.g., Payroll program, banking system, point of sale system) that facilitate specific business tasks.

In an MIS, these components form an interconnected ecosystem, with people using business procedures to interact with and record data. The hardware, along with the software, processes this data, transforming it into meaningful information accessible to users. The effective collaboration of all these components ensures the MIS serves its purpose, providing valuable insights for decision-making and supporting business operations.

Organizational Decision Making

Decision making can be defined as selecting between alternative courses of action. Management decision making concerns the choices faced by managers within their duties in the organization. Making decisions is an important aspect of planning. Decision making can also be classified into three categories based on the level at which they occur.

Strategic Decisions: These decisions establish the strategies and objectives of the organization. These types of decisions generally occur at the highest levels of organizational management.

Tactical Decisions: Tactical decisions concern the tactics used to accomplish the organizational objectives. Tactical decisions are primarily made by middle and front-line managers.

Operational Decisions: Operational decisions concern the methods for carrying out the organizations delivery of value to customers. Operational decisions are primarily made by middle and front-line managers.

Decisions can be categorized based on the capacity of those making the decision.

Personal Decisions: Personal decisions are those primarily affecting the individual though the decision may ultimately have an effect on the organization as a result of its effect on the individual. These types of decisions are not made within a professional capacity. These decisions are generally not delegated to others.

Organizational Decisions: An organizational decision is one that relates or affects the organization. It is generally made by a manager or employee within their official capacity. These decisions are often delegated to others.

Strategies:

Marginal Analysis

Marginal analysis helps organizations allocate resources to increase profitability and benefits and reduce costs. An example from indeed.com is if a company has the budget to hire an employee, a marginal analysis may show that hiring that person provides a net marginal benefit because the ability to produce more products outweighs the increase in labor costs.

SWOT Diagram

This tool helps a manager study a situation in four quadrants:

  • Strengths: Where does the organization excel compared to its competition? Consider the internal and external strengths.
  • Weaknesses: What could the organization improve?
  • Opportunities: How can the organization leverage its strengths to create new avenues for success.
  • Threats: Determine what obstacles prevent the organization from achieving its goals.

Decision Matrix

A decision matrix can provide clarity when dealing with different choices and variables. It is like a pros/cons list, but decision-makers can place a level of importance on each factor. According to Dashboards, to build a decision matrix:

  • List your decision alternatives as rows
  • List relevant factors as columns
  • Establish a consistent scale to assess the value of each combination of alternatives and factors
  • Determine how important each factor is in choosing a final decision and assign weights accordingly
  • Multiply your original ratings by the weighted rankings
  • Add up the factors under each decision alternative
  • The highest-scoring option wins

Pareto Analysis

The Pareto Principle helps identify changes that will be the most effective for an organization. It’s based on the principle that 20 percent of factors frequently contribute to 80 percent of the organization’s growth. For example, suppose 80 percent of an organization’s sales came from 20 percent of its customers. A business can use the Pareto Principle by identifying the characteristics of that 20 percent customer group and finding more like them. By identifying which small changes have the most significant impact, an organization can better prioritize its decisions and energies.

Steps:

Make long-term goals and use them to measure your decisions.

All too often, organizations find themselves endlessly running around in pursuit of short-term goals. Money that has been committed to a year-long project gets overrun or set off because flashy or short-term priorities arise and resources are redirected. As a result, you typically end up with an awful lot of confusion and a lack of overall progress.

To avoid this problem, nail down your high-priority, long-term goals from the outset. Then as your organization makes decisions, ask yourself whether what you’re doing aligns with those goals. This should be a constant process, returning again and again to check your organizational activity against your goals.

When you apply this method successfully, you will engage more reliably in short-term projects that support your long-term goals. Over time, this will push your organization forward.

Align your goals with your core values

Ideally, these should flow from your organization’s mission and core values. Your organization’s goals may evolve over time, but its values should be much less mutable.

Your organizational values confer a coherent sense of identity and continuity to your organization. They should be clearly understood and agreed upon by your decision-makers. As you evaluate your goals, make sure that they are aligned with your core values.

Assess (and reassess) spending

One way to evaluate your priorities as they are being realized today is to take a look at your spending. Often, you may think you’re prioritizing a particular goal or effort, while your budget tells a different story.

Make sure your organizational spending reflects your identified priorities. If not, you need to take a second look. And as with any such check-in, it’s essential to make this a regular assessment to continuously verify that you’re on track.

Understand the impacts of your decisions.

Some decisions may be discrete and routine, having neat boundaries and only significantly impacting the matter directly at hand. But more often, organizational decisions may have wide-ranging consequences, especially if they will touch on policy or processes.

As your organization considers varying possibilities, make sure to weight second and third-order effects. These consequences can provide crucial context for the decision at hand.

Remember your personnel.

Organizations tend to depend on the quality of their employees to succeed. If your decisions make it difficult for your employees to be productive in their work environment, it will damage your prospects for long-term success even if your decisions appear to advance a short-term goal.

Evaluate the effect your decisions will have on your employees’ ability to perform their jobs and factor this component into your decisions accordingly.

The most effective decision-making should lead to improved work toward your long-term goals, which should be driven by core values. You should constantly reevaluate your spending and assess likely consequences of your actions. If you follow these steps thoroughly, you will have assembled a framework for successful organizational decision-making.

Advantages of Decision Making

Increase People’s Participation

Decision making in the organisation is done by a group of peoples working in the organisation. It is not carried out by a single individual rather than by a group of people. Each people actively participates in decision making of the organisation. They are free to present their creative ideas without any boundations.

Also, none of them is individually criticized for any failure but the whole group is responsible to handle. This increases the participation level of different people in the organisation.

Gives More Information

Good decision-making process acquires enough information before taking any action. In decision making, there is a large number of peoples involved. It is undertaken by the whole group rather than by a single individual. Each person gives his perspective to handle a particular situation.

They all represent there facts and figures according to their skill. This generates enough information which can be used for better understanding of the situation. This helps managers in taking corrective decisions.

Provide More Alternatives

Companies are able to get different alternatives for a particular situation through group decision making. There are different people working as a group for proper decisions. Each person looks differently to a particular problem.

They give their own perspectives and ideas for it. This way there are different options available to choose. All the alternatives are properly analysed in light of handling situation. The best one is chosen to arrive at a better result.

Improves the Degree of Acceptance and Commitment

Companies always face the chances of conflict among its staff working in the organisation. Through group decision making each person gets equal right to share his views and ideas.

Here decisions are not imposed on the peoples but are created with their participation. It develops a sense of loyalty and belongingness among people towards the business. They easily accept the decisions taken and are committed to their roles.

Helps In Strengthening the Organisation

It helps in improving the strength of the organisation. Decision making provides a platform to each individual working in an organisation to equally represent their ideas. Everybody gets an equal right to take part in managing the organisation.

It develops a sense of cooperation and unity among individuals working there. They all come together and work towards the accomplishment of the company’s goals. This increases the overall productivity of the organisation and strengthens its overall structure.

Improves the Quality of Decisions

Decision making helps in taking quality decisions at the right time. There are different experts engaged by organisations in their decision-making group. These peoples have through knowledge and creative thinking.

They analyse each and every aspect of every alternative available to them for handling situations. Best among the different alternatives available is chosen. It enables in quality decision making which helps in easy attainment of objectives.

Limitations:

Consultation ambiguity: This can be a scenario where a group of employees all feel like they have a vote in a decision or when a manager asks for input but doesn’t consider a group’s views. It’s important for a manager to solicit feedback but to make sure that contributors understand it’s the manager’s final decision.

Avoiding discomfort: Sound management decision making requires leaders who do not confuse their need for comfort with making the best decision. Some of the most effective decisions involve a degree of discomfort for the manager.

Appearing indecisive: Sometimes, a systematic decision making process has a downside. Being too rigorous in evaluating every possible angle can draw out the process and open the risk of appearing indecisive. Keep stakeholders informed about the timeline for a decision.

Blind spots: People have particular perspectives and ways of thinking that can create blind spots, which may be important for an effective decision but cannot be readily apparent. It can be helpful to seek input from trusted colleagues to provide a different perspective.

Groupthink: This occurs when a group’s members want to minimize conflict and reach a comfortable decision at the expense of a critical evaluation of other ideas and viewpoints. It’s important to explore alternatives a group may not have considered.

Networking of Computers, Client Server LAN, Wide Area Network (WAN)

A computer network is a system in which multiple computers are connected to each other to share information and resources.

Characteristics of a Computer Network

  • Share resources from one computer to another.
  • Create files and store them in one computer, access those files from the other computer(s) connected over the network.
  • Connect a printer, scanner, or a fax machine to one computer within the network and let other computers of the network use the machines available over the network.

NODA

A node is any physical device within a network of other tools that’s able to send, receive, or forward information. A personal computer is the most common node. It’s called the computer node or internet node.

Modems, switches, hubs, bridges, servers, and printers are also nodes, as are other devices that connect over Wi-Fi or Ethernet. For example, a network connecting three computers and one printer, along with two more wireless devices, has six total nodes.

Nodes within a computer network must have some form of identification, like an IP address or MAC address, for other network devices to recognize it. A node without this information, or one that’s offline, no longer functions as a node.

In telecommunications networks, a node is either a redistribution point or a communication endpoint. The definition of a node depends on the network and protocol layer referred to. A physical network node is an electronic device that is attached to a network, and is capable of creating, receiving, or transmitting information over a communications channel. A passive distribution point such as a distribution frame or patch panel is consequently not a node.

Network nodes are the physical pieces that make up a network. They usually include any device that both receives and then communicates information. But they might receive and store the data, relay the information elsewhere, or create and send data instead.

For example, a computer node might back up files online or send an email, but it can also stream videos and download other files. A network printer can receive print requests from other devices on the network, while a scanner can send images back to the computer. A router determines which data goes to which devices that request file downloads within a system, but it can also send requests out to the public internet.

Client Server LAN

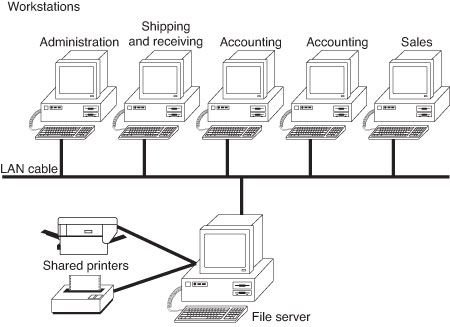
On a client/server network, every computer has a distinct role: that of either a client or a server. A server is designed to share its resources among the client computers on the network. Typically, servers are located in secured areas, such as locked closets or data centers (server rooms), because they hold an organization’s most valuable data and do not have to be accessed by operators on a continuous basis. The rest of the computers on the network function as clients.

The components of a client/server LAN.

Wide Area Network (WAN)

A wide area network (WAN) is a telecommunications network that extends over a large geographical area for the primary purpose of computer networking. Wide area networks are often established with leased telecommunication circuits.

Business, as well as education and government entities use wide area networks to relay data to staff, students, clients, buyers and suppliers from various locations across the world. In essence, this mode of telecommunication allows a business to effectively carry out its daily function regardless of location. The Internet may be considered a WAN.

Similar types of networks are personal area networks (PANs), local area networks (LANs), campus area networks (CANs), or metropolitan area networks (MANs) which are usually limited to a room, building, campus or specific metropolitan area, respectively.

Theory of interest

1. Productivity Theory:

According to productivity theory, interest can be defined as a reward for availing the services of capital for the production purpose.

Labor that is having good amount of capital produces more as compared to the labor who is not assisted by good amount of capital.

For example, farmer having tractor to plough the field produces more as compared to the farmer who does not have it. Thus, interest is the payment for the productivity of capital.

However, the productivity theory is criticized on the following grounds:

  1. Focuses only on the causes for what the interest is paid, not on the determination of interest rates.
  2. Assumes that interest is paid due to the productivity of capital. In such a case, pure interest should vary as per the productivity of the capital. However, pure interest is the same in money market during the same period of time.
  3. Lays emphasis on the demand of interest, but ignores the supply side of capital.
  4. Fails to explain how the interest is paid for the loan borrowed for consumption purposes.

2. Abstinence or Waiting Theory:

The abstinence theory was propounded by Senior. According to him, interest is a reward for abstinence. When an individual saves money out of his/her income and lends it to other individual, he/she makes sacrifice. The term sacrifice implies that the individual refrains from consuming his/her whole income that he/she could spent easily. Senior advocated that abstaining from consumption is unpleasant. Therefore, the lender must be rewarded for this. Thus, as per Senior, interest can be regarded as the reward for refraining from the use of capital.

Abstinence theory was also criticized by a number of economists. According to the theory, an individual feels unpleasant when they save as it reduces his/her consumption. However, rich people do not feel unpleasant while saving because they are able to meet their requirements.

Therefore, Marshall has replaced the term abstinence with waiting and described saving in terms of waiting. He states that saving is done by transferring the present requirement to the future and the person needs to wait for meeting those requirements. However, people do not want to wait rather they are motivated to save money by providing a certain amount of interest.

3. Austrian or Agio Theory:

Austrian theory is also termed as psychological theory of interest. This theory was advocated by John Rae and Bohm Bawerk in an Austrian school. According to Austrian theory, interest came into existence because present goods are preferred over future goods. Therefore, the present goods have premium with them in the form of interest. In other words, present satisfaction is of greater concern as compared to future satisfaction.

Therefore, future satisfaction has certain type of discount if compared with present satisfaction. The interest is the discounted amount that is required to be paid for motivating people to invest or transfer their present requirements to future. For example, an individual has to make a choice between two options.

He/she can either have Rs. 500 now or the same amount after a year. In such a case, he/she would prefer to have Rs. 500 in present. However, in case, the individual has a choice of getting Rs. 500 in present and Rs. 600 after one year.

In such a case, he/she would be more inclined toward getting Rs. 600 after a year. Thus, the extra payment of Rs. 100 would compensate the sacrifice involved in delaying his/her present satisfaction. The extra payment of Rs. 100 in the given case is considered as interest.

Agio theory’ has been criticized by various economists on the following grounds:

  1. Lays too much emphasis on the supply aspect and ignores the demand aspect
  2. Does not focus on the determination of rate of interest

4. Classical or Real Theory:

Classical theory helps in the determination of rate of interest with the help of demand and supply forces. Demand refers to the demand of investment and supply refers to the supply of savings. According to this theory, rate of interest refers to the amount paid for saving.

Therefore, the rate of interest can be determined with the help of demand for saving money to be invested in the capital goods and the supply of savings. Let us understand the concept of demand of investment. Capital goods are used for the production of consumer goods and provide returns continuously for many years.

However, a certain degree of uncertainty is associated with capital goods due to their future use. In addition, operation and maintenance costs are involved in using capital goods. This makes organizations to calculate the net expected return on the marginal cost that is represented as the percentage of cost of capital good.

In case, an organization has similar type of capital goods, then the increase in one more capital good would not yield them high revenue. The increase in the rate of interest would result in the fall of demand of capital goods.

Figure-18 shows the demand for capital investment:

4.1

In Figure-18, MRP represents the marginal revenue productivity curve. When the demand of capital is OM, then the rate of interest is Or. The net rate of return becomes equal to the current rate of interest (Or) at the OM demand of capital.

In case, the rate of interest decreases to Or’, then the demand of capital increases to OM’. The net rate of return is equal to Or’ when the amount of capital demanded is OM’. The demand for capital goods increases with a decrease in the rate of interest.

On the other hand, the supply of capital increases by the amount saved by an individual and the saving is done by transferring the present requirement to the future requirement. The rate of interest would increase with the increase in the amount of saving by an individual.

The rate of interest can be determined with the help of demand of investment and supply of savings. It would be the point of equilibrium where demand and supply intersects each other or get equal.

Figure-19 shows the determination of rate of interest with the help of demand and supply curves:

4.2

In Figure-19, SS is the supply curve of saving and II is the demand curve of investment that intersect each other at Or rate of interest with quantity of saving and investment is OM. OM represents the amount that is lent, borrowed and used for investment. The rate of interest can be changed by changing the demand and supply of savings and investment.

The classical theory is criticized by Keynes due to various reasons, which are as follows:

  1. Assumes the full employment of resources, which is not true in reality. This is because if one resource is reduced from one production process, then it would be utilized for other production process. On the contrary, if resources are available in abundant, then there is no need to save them.
  2. Assumes that investment can be increased only when individuals reduce their consumption. This is because if the consumption is less, then the saving would increase, which would lead to the increase in investment. However, if the demand of capital goods decreases, then the incentive to produce capital goods would also decrease. This would result in the decrease of investment.
  3. Assumes that there is no change in the income level of an individual. Thus, according to classical theory, saving and investment become equal due to change in rate of interest. However, according to Keynes theory, savings and investment become equal because of changes occur in the income level of an individual.

5. Loanable Fund Theory:

Loanable fund theory agrees with the view that time preference plays an important role in determining the occurrence of interest. This theory is also termed as neo-classical theory of interest. According to neo-classical economists, interest is the amount paid for loanable funds. It focuses on the determination of rate of interest with the help of demand and supply of loanable funds in the credit market. Let us understand the concept of supply of loanable funds.

The supply of loanable funds depends on the following factors:

  1. Savings:

Act as one of the sources of loanable funds. The loanable funds in the form of saving are classified as ex-ante saving and Robertsonian sense. Ex-ante saving refers to the saving that an individual plans according to his/her expected income and expenditure in the starting of a year or financial year or for a month.

On the other hand, Robertsonian sense refers to the saving that is produced by taking the difference of previous period income and present period consumption. In both the types of savings, the savings are different at different rate of interest. Savings are dependent on the income level that vanes with the rate of interest. The increase in the rate of interest would result in the increase of the level of saving and vice versa.

In the context of organizations, the amount left after distributing the profit in the form of dividends is termed as the saving of an organization. The savings of an organization depends on the rate of interest prevailing in the market. Increased rate of interest would encourage organizations to increase savings instead of borrowing money from loan market.

2. Dishoarding:

Involves reduction in the money stock of an organization. Therefore, in the previous money stock, the liquidity of money is high that can be utilized in the present time as loanable funds. The higher the rate of interest, the more would be the money dishoarded and vice versa.

3. Credit by bank:

Refers to the loan provided by bank to the organizations. Banks can increase or decrease the money lend to an organization on the basis of certain criteria. The supply of loanable funds increases with the increase in the money created by banks. The supply curve is interest elastic for loanable funds. The higher the rate of interest, the more the bank would lend money and vice versa.

4. Disinvestment:

Refers to the situation when the existing capital goods of an organization are reduced or the stock of the organization is less than the previous stock. In such a condition, the fund that is used for the replacement purposes are used as loanable funds.

According to Bober, ”Disinvestment is encouraged by the somewhat by a high rate of interest on loanable funds. When the rate is high, some of the current capital may not produce a marginal revenue product to match this rate of interest. The firm may decide to let this capital run down and to put the depreciation finds in the ban market”

After determining the factors that influence the supply of loanable funds, let us study the demand for loanable funds. The demand for loanable funds depends on investment, consumption, and hoarding of income. Organizations require loanable funds to a greater extent for expanding the stock of capital goods, such as machines and buildings.

The demand for loanable funds depends on the extent to which organizations require loanable funds. Interest is the price at which the loanable funds can be bought. Organizations require loanable funds at which the net rate of return on capital goods is equal to the rate of interest.

The higher rate of interest demotivates organizations to buy capital goods or expand their stock of capital goods. Therefore, the demand of loanable funds is interest elastic for organizations; therefore, the demand curve would slope downwards.

Another major constituent of demand for loanable funds is the requirement of funds b) individuals for consumption. Generally, individuals require loanable fund when they desire to purchase something out of their budget or the consumer goods that they cannot afford from their present income. The lower the rate of interest, the higher would be the demand for loanable goods. Therefore, the demand for loanable funds is interest elastic for individuals; thus the demand curve slopes downward.

Along with organizations and individuals, there are some people who require loanable goods for hoarding purposes. Hoarding refers to the holding of some part of income by the individuals for future use. In hoarding, the supplier and buyer of loanable funds is the same person.

A person may want to hold funds when the rate of interest is low. On the contrary, he/she may use his/her funds by investing in new projects, when the rate of interest is high. Therefore, the demand of loanable funds is interest elastic for hoarding purpose; thus, the demand curve slopes downward.

Figure-20 shows the interaction between the demand and supply curve of loanable funds to reach at equilibrium position:

4.3

In Figure-20, DH represents dishoarding curve, BM is bank credit curve, S represents saving curve, and DI is disinvestment curve. LS represent the supply of loanable funds, which is produced by summing up the DH, BM, S, and DI curve. Similarly, H represents hoarding, C is consumption, and I is investment, which together form LD.

In Figure-20, LD is the demand for loanable funds. The point at which the demand and supply curve of loanable funds intersect each other is termed as equilibrium point (E). At point E, the rate of interest is OR with ON loanable funds. Therefore, OR would be the equilibrium rate of interest in the credit market.

Consumer’s Surplus

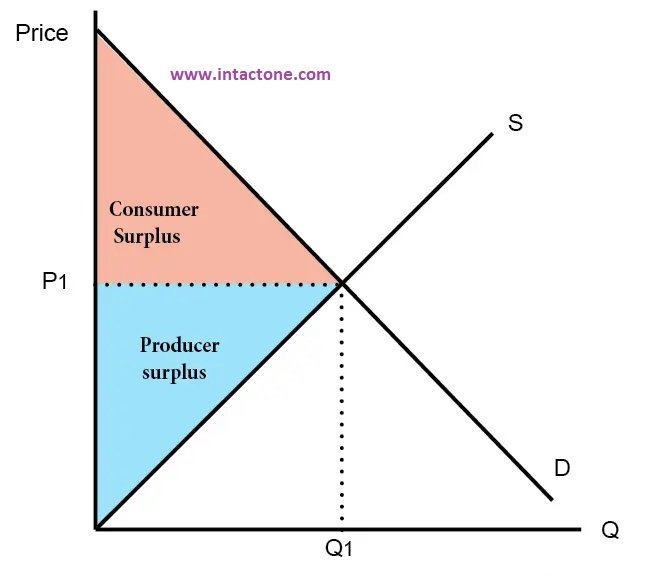
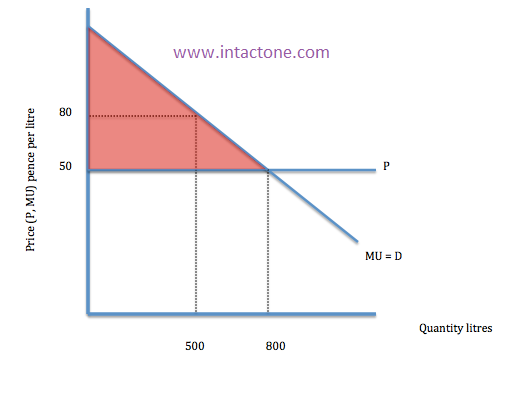
Consumer Surplus is the difference between the price that consumers pay and the price that they are willing to pay. On a supply and demand curve, it is the area between the equilibrium price and the demand curve

For example, if you would pay 76p for a cup of tea, but can buy it for 50p; your consumer surplus is 26p

Diagram of Consumer Surplus

Producer Surplus

  • This is the difference between the price a firm receives and the price it would be willing to sell it at.
  • Therefore it is the difference between the supply curve and the market price.

Consumer Surplus and Marginal Utility

The demand curve is derived from our marginal utility. If the marginal utility of a good is greater than the price, then that is our consumer surplus.

  1. Firms can reduce consumer surplus if they have market power. This enables them to raise prices above the competitive equilibrium.
  2. In a monopoly, a firm will maximise profits by reducing consumer surplus.
  3. Another way to reduce consumer surplus is to engage in price discrimination. Charging different prices to different groups of consumers. Those with inelastic demand will see their consumer surplus reduced. More on Price discrimination. To completely eliminate consumer surplus, a firm would need to engage in first-degree price discrimination this means charging the consumer the highest price they are willing to pay.
  4. To gain market power, a firm could advertise to create brand loyalty, this will make demand more inelastic

Significance of consumer surplus

  • In competitive markets, firms have to keep prices relatively low, enabling consumers to gain consumer surplus. If markets were not competitive, the consumer surplus would be less and there would be greater inequality.
  • A lower consumer surplus leads to higher producer surplus and greater inequality.
  • Consumer surplus enables consumers to purchase a wider choice of goods.

Workers Participation in Management, Characteristics, Objectives, Levels

Workers’ Participation in Management refers to the involvement of employees in decision-making processes, policies, and practices that affect their work and workplace. It encompasses mechanisms and structures that enable workers to contribute their perspectives, ideas, and feedback to management, fostering a sense of ownership, empowerment, and collaboration. Workers’ participation can take various forms, including representation on decision-making bodies, consultation mechanisms, joint committees, and employee involvement programs. By promoting dialogue, transparency, and shared responsibility between management and workers, workers’ participation in management aims to enhance productivity, job satisfaction, and organizational performance while fostering a culture of mutual respect and cooperation in the workplace.

Characteristics of Workers Participation in Management:

  • Voluntary Involvement:

Workers’ participation in management is based on voluntary involvement, where employees willingly engage in decision-making processes and activities that affect their work and workplace. It is not coerced or mandated by management but arises from a genuine desire to contribute to organizational goals and improve working conditions.

  • Joint Decision-Making:

Workers’ participation in management involves joint decision-making processes where both management and workers have a voice and influence in decisions that affect the organization. It fosters collaboration, dialogue, and consensus-building between management and employees, leading to more informed and inclusive decision-making.

  • Information Sharing:

Workers’ participation in management entails open and transparent communication between management and employees, with the sharing of relevant information, data, and insights. It ensures that employees are well-informed about organizational goals, strategies, performance, and challenges, enabling them to make meaningful contributions and informed decisions.

  • Consultation and Dialogue:

Workers’ participation in management involves regular consultation and dialogue between management and workers on matters of mutual interest, such as workplace policies, procedures, and practices. It provides opportunities for employees to express their views, concerns, and suggestions, while management listens, considers feedback, and responds constructively.

  • Representation:

Workers’ participation in management often involves the representation of employees on decision-making bodies, committees, or forums where they can articulate the interests and perspectives of their colleagues. Employee representatives serve as advocates for their peers, ensuring that their voices are heard and considered in management decisions.

  • Training and Development:

Workers’ participation in management may require training and development initiatives to enhance employees’ skills, knowledge, and capabilities in areas such as communication, negotiation, problem-solving, and leadership. Training programs equip employees with the tools and competencies needed to engage effectively in decision-making processes and contribute to organizational success.

  • Continuous Improvement:

Workers’ participation in management is characterized by a commitment to continuous improvement and learning, where both management and employees work together to identify areas for enhancement, innovation, and optimization. It fosters a culture of continuous feedback, experimentation, and adaptation, driving organizational agility and resilience in a dynamic business environment.

Objectives of Workers Participation in Management:

  • Enhanced Decision-Making:

One objective of workers’ participation in management is to improve the quality of decision-making by incorporating the knowledge, insights, and perspectives of employees. By involving workers in decision-making processes, organizations can tap into their frontline expertise, innovative ideas, and problem-solving abilities, leading to more informed and effective decisions.

  • Increased Productivity:

Workers’ participation in management aims to enhance productivity by engaging employees in the improvement of work processes, efficiency measures, and productivity initiatives. By involving workers in identifying and implementing productivity enhancements, organizations can boost performance, optimize resource utilization, and achieve better outcomes.

  • Improved Quality of Work Life:

Workers’ participation in management seeks to enhance the quality of work life for employees by providing opportunities for meaningful involvement, autonomy, and recognition. By empowering employees to contribute to decision-making and problem-solving, organizations can create a positive work environment characterized by job satisfaction, motivation, and fulfillment.

  • Promotion of Industrial Democracy:

Workers’ participation in management promotes the principles of industrial democracy by fostering a culture of shared responsibility, accountability, and mutual respect between management and employees. By giving employees a voice and stake in organizational decisions, organizations can build trust, transparency, and cooperation, strengthening labor-management relations.

  • Conflict Resolution:

Workers’ participation in management aims to prevent and resolve conflicts by providing mechanisms for dialogue, negotiation, and consensus-building between management and employees. By fostering open communication and collaboration, organizations can address grievances, resolve disputes, and build consensus on issues of mutual concern, reducing tension and promoting harmony in the workplace.

  • Employee Development:

Workers’ participation in management contributes to the development of employees by providing opportunities for learning, skill development, and career advancement. By involving employees in decision-making and problem-solving, organizations can empower them to take ownership of their work, build leadership capabilities, and enhance their professional growth and development.

  • Organizational Effectiveness:

Ultimately, workers’ participation in management aims to improve organizational effectiveness and performance by leveraging the collective intelligence, creativity, and commitment of employees. By engaging employees as partners in the pursuit of organizational goals, organizations can enhance agility, innovation, and adaptability, driving sustainable growth and success.

Levels of Workers Participation in Management:

  1. Shop Floor or Operational Level:

At the shop floor or operational level, workers participate in decision-making processes that directly affect their work tasks, processes, and immediate work environment. This level of participation may include involvement in problem-solving, process improvement initiatives, safety protocols, and quality control measures.

  1. Departmental or Team Level:

Workers may participate in decision-making at the departmental or team level, where they collaborate with colleagues and supervisors to address department-specific issues, allocate resources, and coordinate activities. This level of participation fosters teamwork, communication, and collective responsibility within departments or work teams.

  1. Plant or Facility Level:

At the plant or facility level, workers may participate in broader decision-making processes related to overall plant operations, production schedules, resource allocation, and performance management. This level of participation involves engagement with plant management, department heads, and other stakeholders to address systemic challenges and opportunities.

  1. Company-wide or Organizational Level:

Workers may participate in decision-making at the company-wide or organizational level, where they contribute to strategic planning, policy development, and corporate governance. This level of participation may involve representation on company boards, advisory committees, or task forces responsible for shaping organizational direction and priorities.

  1. Industry or Sector Level:

Workers may participate in decision-making at the industry or sector level through participation in industry associations, trade unions, or sector-specific forums. This level of participation enables workers to advocate for their collective interests, influence industry policies and practices, and address common challenges facing workers in the sector.

  1. National or International Level:

Workers may participate in decision-making at the national or international level through engagement with government agencies, international organizations, and multi-stakeholder initiatives. This level of participation involves advocacy for labor rights, social justice, and policy reforms on issues of global concern, such as labor standards, trade policies, and sustainable development.

Meaning of Correlation, Importance

Correlation, in the finance and investment industries, is a statistic that measures the degree to which two securities move in relation to each other. Correlations are used in advanced portfolio management, computed as the correlation coefficient, which has a value that must fall between -1.0 and +1.0

A perfect positive correlation means that the correlation coefficient is exactly 1. This implies that as one security moves, either up or down, the other security moves in lockstep, in the same direction. A perfect negative correlation means that two assets move in opposite directions, while a zero correlation implies no relationship at all.

For example, large-cap mutual funds generally have a high positive correlation to the Standard and Poor’s (S&P) 500 Index – very close to 1. Small-cap stocks have a positive correlation to that same index, but it is not as high – generally around 0.8.

However, put option prices and their underlying stock prices will tend to have a negative correlation. As the stock price increases, the put option prices go down. This is a direct and high-magnitude negative correlation.

  • Correlation is a statistic that measures the degree to which two variables move in relation to each other.
  • In finance, the correlation can measure the movement of a stock with that of a benchmark index, such as the Beta.
  • Correlation measures association, but does not tell you if x causes y or vice versa, or if the association is caused by some third (perhaps unseen) factor.

Importance of correlation Analysis

Correlation is very important in the field of Psychology and Education as a measure of relationship between test scores and other measures of performance. With the help of correlation, it is possible to have a correct idea of the working capacity of a person. With the help of it, it is also possible to have a knowledge of the various qualities of an individual.

After finding the correlation between the two qualities or different qualities of an individual, it is also possible to provide his vocational guidance. In order to provide educational guidance to a student in selection of his subjects of study, correlation is also helpful and necessary.

Correlation Statistics and Investing

The correlation between two variables is particularly helpful when investing in the financial markets. For example, a correlation can be helpful in determining how well a mutual fund performs relative to its benchmark index, or another fund or asset class. By adding a low or negatively correlated mutual fund to an existing portfolio, the investor gains diversification benefits.

In other words, investors can use negatively-correlated assets or securities to hedge their portfolio and reduce market risk due to volatility or wild price fluctuations. Many investors hedge the price risk of a portfolio, which effectively reduces any capital gains or losses because they want the dividend income or yield from the stock or security.

Correlation statistics also allows investors to determine when the correlation between two variables changes. For example, bank stocks typically have a highly-positive correlation to interest rates since loan rates are often calculated based on market interest rates. If the stock price of a bank is falling while interest rates are rising, investors can glean that something’s askew. If the stock prices of similar banks in the sector are also rising, investors can conclude that the declining bank stock is not due to interest rates. Instead, the poorly-performing bank is likely dealing with an internal, fundamental issue.

Degrees of Price Discrimination

Price discrimination means charging different prices from different customers or for different units of the same product. In the words of Joan Robinson: “The act of selling the same article, produced under single control at different prices to different buyers is known as price discrimination.” Price discrimination is possible when the monopolist sells in different markets in such a way that it is not possible to transfer any unit of the commodity from the cheap market to the dearer market.

Degrees of price discrimination

Prof. Pigou in his Economics of Welfare describes three degrees of discriminating power which a monopolist may wield. The type of discrimination discussed above is called discrimination of the third degree. We explain below discrimination of the first degree and the second degree.

Discrimination of the First Degree (1st) or Perfect Discrimination

Discrimination of the first degree occurs when a monopolist charges “a different price against all the different units of commodity in. such wise that the price exacted for each was equal to the demand price for it and no consumer’s surplus was left to the buyers.”

Joan Robinson calls it perfect discrimi­nation when the monopolist sells each unit of the product at a separate price. Such discrimination is possible only when consumers are sold the units for which they are prepared to pay the highest price and thus they are not left with any consumer’s surplus.

For perfect price discrimination, two conditions are required

(1) To keep the buyers separate from each other, and

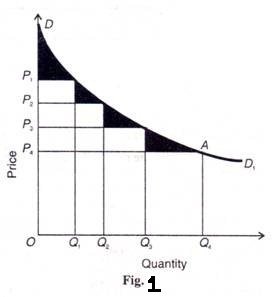
(2) To deal with each buyer on a take-it-or-leave-it basis. When the discriminator of first degree is able to deal with his customers on the above basis, he can transfer the whole of consumers’ surplus to himself. Consider Figure 1. Where DD1 is the demand curve faced by the monopolist. Each buyer is assumed as a price-taker. Suppose the discriminating monopolist sells four units of his product at four different prices:

OQ1 unit at OP1price, Q1Q2 unit at OPprice, Q2Q3 unit at OP3 price and Q3Q4 unit at OP4 price. The total revenue (or price) obtained by him would be OQ4 AD. This area is the maximum expenditure that the consumers are willing to incur to buy all four units of the product under the first-degree discriminator’s all-or-nothing offer. But with no price discrimination under simple monopoly, the monopolist would sell all four units at the uniform price OP4 and thus obtain the total revenue of OQ4AP4.

This area represents the total expenditure that consumers would actually pay for the four units. Thus the difference between what Quantity the consumers were willing to pay (OQ4 AD) under Fig. 1 the take-it-or-leave-it offer of the first degree discrimi­nator and what they actually pay (OQ4AP4) to the simple monopolist, is consumers’ surplus. This is equal to the area of the triangle DAP4.

Thus under the first-degree price discrimination, the entire consumers’ surplus is pocketed by the monopolist when he charges a separate price for each unit of the product. Price discrimination of the first degree is rare and is to be found in such rare products as diamonds, jewels, precious stones, etc. But a monopolist must have full knowledge of the demand curve faced by him and he should know the maximum price that the consumers are willing to pay for each unit of the product he wants to sell.

Discrimination of the Second Degree (2nd) or Multi-part Pricing

In discrimination of the second degree, the monopolist divides the consumers in different slabs or groups or blocks and charges different prices for different slabs of the same product. Since the earlier units of the product have more utility for the consumers than the later ones, the monopolist charges a higher price for the former units and reduces the price for the later units in the respective slabs.

Such discrimination is only possible if the demand of each consumer below a certain maximum price is perfectly inelastic. Electric supply companies in developed countries practice discrimination of the second degree when they charge a high rate for the first slab of kilowatts of electricity consumed. As more electricity is used, the rate falls with subsequent slabs.

Figure 2 illustrates the second degree discrimination, where DD1is the demand curve for electric­ity on the part of domestic consumers in a town. CP3 represents the cost of generating electricity, so that the electricity company charges M1P1 rate per kw. up to OM1 units. For consuming the next M1 to М2 units, the rate is lowered to M2P2. The lowest rate charged is M3P3 for M2 to M3 units. M3P3 is, however, the lowest rate which will be charged even if a con­sumer consumes more than M3 units of electricity.

If the electricity company were to charge only one rate throughout, say M3P3the total revenue would not be maximized. It would be OCP3 M3But by charg­ing different rates for different unit slabs, it gets the total revenue equal to OM3 x P1M1 + OM2 x P2M2 + OM3x P3M3 Thus the second degree discriminator would take away a part of consumers’ surplus covered by the rectangles ABEP1and BCFP2 .The shaded area in three triangles DAP1 Р1ЕР2, and P2FP3 still remains with consumers as their surplus.

The second degree price discrimination is practised by telephone companies, railways, companies supplying water, electricity and gas in developed countries where these services are available in plenty. But it is not found in developing countries like India where such services are scarce.

The differences between the first and second degree price discrimination may be noted. In the first degree discrimination, the monopolist charges a different price for each different unit of the prod­uct. But in second degree discrimination, a number of units in one slab (or group or block) are sold at the lowest price and as the slabs increase, the prices charged by the monopolist are lowered. In the case of the former the monopolist takes away the whole of consumers’ surplus. But in the latter case, the monopolist takes away only a portion of the consumers’ surplus and the other portion is left with the buyer.

Conditions under which Price Discrimination is Possible

Price discrimination is possible under following conditions:

  1. Nature of Commodity

In the first place it is said that price discrimination is possible when the nature of the commodity or service is such that there is no possibility of transference from one market to the other.

That is, the goods sold in the cheaper market cannot be resold in the dearer market; otherwise the monopolist’s purpose will be defeated.

  1. Distance of Two Markets

Price discrimination is possible when the two markets or markets are separated by large distance or tariff barriers, so that it is not possible to transfer goods from a cheaper market to dearer markets. For instance, a monopolist may sell the same product at a higher price in Bombay and lower price in Meerut.

  1. Ignorance of the Consumers

Price discrimination is possible when the consumers are ignorant about price discrimination, they are not aware that in one part of the market prices are lower than in the other part. Thus, he purchases in dearer market, than in cheaper market since he is ignorant of the prices that are prevailing in different markets.

  1. Government Regulation

Price discrimination occurs when the government rules and regulations permit. For instance, according to rules, electricity rates are fixed at higher level for industrial purposes and lower for domestic uses. Similarly, railways charge by law higher fares from first class passengers than from the second class passengers. Hence, price discrimination is possible because of legal sanction.

  1. Geographical Discrimination

Price discrimination may be possible on account of geographical situations. The monopolist may discriminate between home and foreign buyers by selling at lower price in the foreign market than in the domestic market. Geographical discrimination is possible because no unit of the commodity sold in one market can be transferred to another.

  1. Difference in Elasticity of Demand

A commodity may have different elasticity of demand in different markets. Thus, the market of a commodity can be separated on the basis of its elasticity of demand.

Hence, a monopolist can charge different prices in different markets classified on the basis of elasticity of demand, low price is charged where demand is more elastic and high price in the market with the less elastic demand or inelastic demand.

  1. Artificial Difference between Goods

A monopolist may create artificial differences by presenting the same commodity under different names and labels, one for the rich and snobbish buyers and the other for the ordinary customers. For instance, a biscuit manufacturer may wrap small quantity of the biscuits, give it separate name and charge a higher price. Thus, he may charge different price for substantially the same product. He may charge Rs. 2/- for 100 gram wrapped biscuits and Rs. 1.50 for unwrapped biscuits.

error: Content is protected !!