 by
by Budget Line, also referred to as the “budget constraint,” is a fundamental concept in consumer theory that represents all possible combinations of two goods a consumer can afford, given their income and the prices of the goods. It serves as a graphical representation of the trade-offs and choices a consumer faces when allocating their limited resources to maximize utility.
Definition of Budget Line
The budget line is a straight line on a graph where:
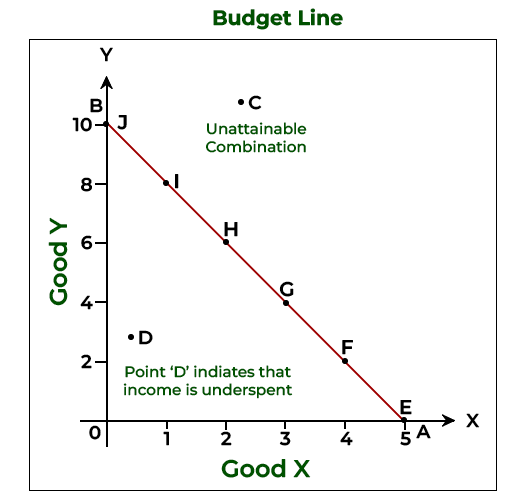
- The x-axis represents the quantity of one good (Good X).
- The y-axis represents the quantity of another good (Good Y).
The slope and position of this line are determined by the consumer’s income and the prices of the goods. Mathematically, the equation of the budget line is:
M = Px⋅X + Py⋅Y
Where:
- M = Consumer’s income
- Px = Price of Good X
- Py = Price of Good Y
- and = Quantities of Goods X and Y.
Characteristics of a Budget Line
- Negative Slope: The line slopes downward, reflecting the trade-off between the two goods. To consume more of one good, the consumer must reduce consumption of the other.
- Straight Line: The linear nature indicates constant prices of goods.
- Intercepts:
- The x-intercept (when Y=0) shows the maximum quantity of Good X that can be purchased if all income is spent on it (M/Px).
- The y-intercept (when X=0) shows the maximum quantity of Good Y that can be purchased (M/Py).
3. Assumptions Underlying the Budget Line
- Fixed Income: The consumer has a specific, limited income.
- Fixed Prices: The prices of goods are constant during the analysis.
- Rational Behavior: The consumer aims to maximize utility within the budget constraint.
Shifts and Rotations of the Budget Line
The budget line can change due to variations in income or the prices of goods:
a. Changes in Income
- An increase in income shifts the budget line outward (away from the origin), as the consumer can afford more of both goods.
- A decrease in income shifts it inward (toward the origin), reducing purchasing power.
b. Changes in Prices
- A decrease in the price of one good causes the budget line to pivot outward along the axis of that good, increasing the quantity affordable.
- An increase in the price of one good causes the budget line to pivot inward, reducing the affordable quantity of that good.
Practical Example
Suppose a consumer has an income of ₹100. They wish to allocate it between two goods: apples (Px = ₹10) and bananas (Py = ₹5).
- If the consumer spends all income on apples: X = M/Px = 100/10 = 10
They can purchase 10 apples and no bananas. - If the consumer spends all income on bananas: Y = M/Py = 100/5 = 20
They can purchase 20 bananas and no apples.
The budget line will connect the points (10, 0) and (0, 20) on a graph. Any point on this line represents a combination of apples and bananas that exhausts the ₹100 income.
Consumer Choices Within the Budget Line
- On the Line: All income is fully utilized. Consumers maximize utility by choosing a point on the line based on preferences.
- Inside the Line: Indicates underutilization of income or savings. The consumer is not spending all available resources.
- Outside the Line: Unaffordable combinations, as they exceed the consumer’s income.
Importance of the Budget Line
- Understanding Trade-offs: It helps consumers evaluate the opportunity cost of choosing one good over another.
- Utility Maximization: By combining the budget line with indifference curves, consumers determine the optimal bundle of goods.
- Economic Analysis: Budget lines illustrate consumer behavior, enabling businesses and policymakers to predict demand patterns.
Limitations of the Budget Line
- No Savings or Borrowing: The budget line assumes consumers spend all income without saving or borrowing.
- Static Prices: It doesn’t account for price changes or dynamic market conditions.
- Simplified Preferences: Assumes preferences remain constant during the analysis.