Quantitative Research

Quantitative research methods are those methods where a systematic approach is used to collect quantifiable of data by performing computational, mathematical, or statistical techniques. The data collected through quantitative research methods are usually in numerical form.

The proper outcome can be deduced by analyzing the data in a systematic form. The results obtained through quantitative research methods are statistical, logical, and unbiased.

These research methods are applied to a group of the population, which represents the entire population.

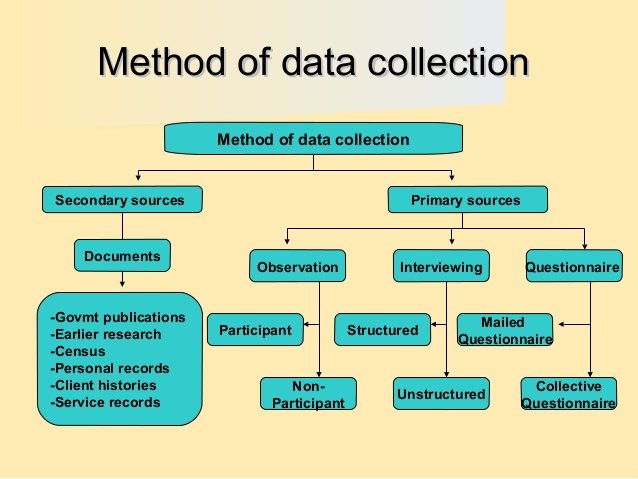
Methods like survey research, cross-sectional surveys, longitudinal surveys, correlational research, causal-comparative research, experimental research, are primary data collection methods in quantitative research methods whereas the data collected from methods such as educational institutions, public libraries, data available on internet, government and non-government resources, and commercial information resources, etc. are the secondary data collection methods in quantitative research methods. Click here to learn more about quantitative research methods.

Primary Quantitative Research Methods

There are four different types of quantitative research methods:

Primary quantitative research is the most widely used method of conducting market research. The distinct feature of primary research is that the researcher focuses on collecting data directly rather than depending on data collected from previously done research. Primary quantitative research can be broken down into three further distinctive tracks, as well as the process flow. They are:

A. Techniques and Types of Studies

There are multiple types of primary quantitative research. They can be distinguished into the four following distinctive methods, which are:

  1. Survey Research:

Survey Research is the most fundamental tool for all quantitative research methodologies and studies. Surveys used to ask questions to a sample of respondents, using various types such as online polls, online surveys, paper questionnaires, web-intercept surveys, etc. Every small and big organization intends to understand what their customers think about their products and services, how well are new features faring in the market and other such details.

By conducting survey research, an organization can ask multiple survey questions, collect data from a pool of customers, and analyze this collected data to produce numerical results. It is the first step towards collecting data for any research.

This type of research can be conducted with a specific target audience group and also can be conducted across multiple groups along with comparative analysis. A prerequisite for this type of research is that the sample of respondents must have randomly selected members. This way, a researcher can easily maintain the accuracy of the obtained results as a huge variety of respondents will be addressed using random selection. Traditionally, survey research was conducted face-to-face or via phone calls but with the progress made by online mediums such as email or social media, survey research has spread to online mediums as well.

Traditionally, survey research was conducted face-to-face or via phone calls but with the progress made by online mediums such as email or social media, survey research has spread to online mediums as well.

There are two types of surveys, either of which can be chosen based on the time in-hand and the kind of data required: 

Cross-sectional surveys: Cross-sectional surveys are observational surveys conducted in situations where the researcher intends to collect data from a sample of the target population at a given point in time. Researchers can evaluate various variables at a particular time. Data gathered using this type of survey is from people who depict similarity in all variables except the variables which is considered for research. Throughout the survey, this one variable will stay constant.

  • Cross-sectional surveys are popular with retail, SMEs, healthcare industries. Information is garnered without modifying any parameters in the variable ecosystem.
  • Using cross-sectional survey research method, multiple samples can be analyzed and compared.
  • Multiple variables can be evaluated using this type of survey research.
  • The only disadvantage of cross-sectional surveys is that the cause-effect relationship of variables cannot be established as it usually evaluates variables at a particular time and not across a continuous time frame.

Longitudinal surveys: Longitudinal surveys are also observational surveys but, unlike cross-sectional surveys, longitudinal surveys are conducted across various time durations to observe a change in respondent behavior and thought-processes. This time can be days, months, years, or even decades. For instance, a researcher planning to analyze the change in buying habits of teenagers over 5 years will conduct longitudinal surveys.

  • In cross-sectional surveys, the same variables were evaluated at a given point in time, and in longitudinal surveys, different variables can be analyzed at different intervals of time.
  • Longitudinal surveys are extensively used in the field of medicine and applied sciences. Apart from these two fields, they are also used to observe a change in the market trend, analyze customer satisfaction, or gain feedback on products/services.
  • In situations where the sequence of events is highly essential, longitudinal surveys are used.
  • Researchers say that when there are research subjects that need to be thoroughly inspected before concluding, they rely on longitudinal surveys.
  1. Correlational Research:

A comparison between two entities is invariable. Correlation research is conducted to establish a relationship between two closely-knit entities and how one impacts the other and what are the changes that are eventually observed. This research method is carried out to give value to naturally occurring relationships, and a minimum of two different groups are required to conduct this quantitative research method successfully. Without assuming various aspects, a relationship between two groups or entities must be established.

Researchers use this quantitative research method to correlate two or more variables using mathematical analysis methods. Patterns, relationships, and trends between variables are concluded as they exist in their original set up. The impact of one of these variables on the other is observed along with how it changes the relationship between the two variables. Researchers tend to manipulate one of the variables to attain the desired results.

Ideally, it is advised not to make conclusions merely based on correlational research. This is because it is not mandatory that if two variables are in sync that they are interrelated.

Example of Correlational Research Questions:

    • The relationship between stress and depression.
    • The equation between fame and money.
    • The relation between activities in a third-grade class and its students.
  1. Causal-Comparative Research:

This research method mainly depends on the factor of comparison. Also called the quasi-experimental research, this quantitative research method is used by researchers to conclude cause-effect equation between two or more variables, where one variable is dependent on the other independent variable. The independent variable is established but not manipulated, and its impact on the dependent variable is observed. These variables or groups must be formed as they exist in the natural set up. As the dependent and independent variables will always exist in a group, it is advised that the conclusions are carefully established by keeping all the factors in mind.

Causal-comparative research is not restricted to the statistical analysis of two variables but extends to analyzing how various variables or groups change under the influence of the same changes. This research is conducted irrespective of the type of relation that exists between two or more variables. Statistical analysis is used to distinctly present the outcome of obtained using this quantitative research method.

Example of Causal-Comparative Research Questions:

  • The impact of drugs on a teenager.
  • The effect of good education on a freshman.
  • The effect of substantial food provision in the villages of Africa.
  1. Experimental Research: Also known as true experimentation, this research method is reliant on a theory. Experimental research, as the name suggests, is usually based on one or more theories. This theory has not been proven in the past and is merely a supposition. In experimental research, an analysis is done around proving or disproving the statement. This research method is used in natural sciences.

There can be multiple theories in experimental research. A theory is a statement that can be verified or refuted.

After establishing the statement, efforts are made to understand whether it is valid or invalid. This type of quantitative research method is mainly used in natural or social sciences as there are various statements which need to be proved right or wrong. 

  • Traditional research methods are more effective than modern techniques.
  • Systematic teaching schedules help children who find it hard to cope up with the course.
  • It is a boon to have responsible nursing staff for ailing parents.

Research design in case of Different Research studies

  1. Research design in case of exploratory research studies: Exploratory research studies are also termed as formulative research studies. The main purpose of such studies is that of formulating a problem for more precise investigation or of developing the working hypotheses from an operational point of view. The major emphasis in such studies is on the discovery of ideas and insights. As such the research design appropriate for such studies must be flexible enough to provide opportunity for considering different aspects of a problem under study. Inbuilt flexibility in research design is needed because the research problem, broadly defined initially, is transformed into one with more precise meaning in exploratory studies, which fact may necessitate changes in the research procedure for gathering relevant data. Generally, the following three methods in the context of research design for such studies are talked about: the survey of concerning literature, the experience survey and the analysis of ‘insight-stimulating’ examples.

The survey of concerning literature happens to be the most simple and fruitful method of formulating precisely the research problem or developing hypothesis. Hypotheses stated by earlier workers may be reviewed and their usefulness be evaluated as a basis for further research. It may also be considered whether the already stated hypotheses suggest new hypothesis. In this way the researcher should review and build upon the work already done by others, but in cases where hypotheses have not yet been formulated, his task is to review the available material for deriving the relevant hypotheses from it.

Besides, the bibliographical survey of studies, already made in one’s area of interest may as well as made by the researcher for precisely formulating the problem. He should also make an attempt to apply concepts and theories developed in different research contexts to the area in which he is himself working. Sometimes the works of creative writers also provide a fertile ground for hypothesis formulation and as such may be looked into by the researcher.

Experience survey means the survey of people who have had practical experience with the problem to be studied. The object of such a survey is to obtain insight into the relationships between variables and new ideas relating to the research problem. For such a survey people who are competent and can contribute new ideas may be carefully selected as respondents to ensure a representation of different types of experience. The respondents so selected may then be interviewed by the investigator. The researcher must prepare an interview schedule for the systematic questioning of informants. But the interview must ensure flexibility in the sense that the respondents should be allowed to raise issues and questions which the investigator has not previously considered. Generally, the experience collecting interview is likely to be long and may last for few hours. Hence, it is often considered desirable to send a copy of the questions to be discussed to the respondents well in advance. This will also give an opportunity to the respondents for doing some advance thinking over the various issues involved so that, at the time of interview, they may be able to contribute effectively. Thus, an experience survey may enable the researcher to define the problem more concisely and help in the formulation of the research hypothesis. This survey may as well provide information about the practical possibilities for doing different types of research.
Analysis of ‘insight-stimulating’ examples is also a fruitful method for suggesting hypotheses for research. It is particularly suitable in areas where there is little experience to serve as a guide. This method consists of the intensive study of selected instances of the phenomenon in which one is interested. For this purpose the existing records, if any, may be examined, the unstructured interviewing may take place, or some other approach may be adopted. Attitude of the investigator, the intensity of the study and the ability of the researcher to draw together diverse information into a unified interpretation are the main features which make this method an appropriate procedure for evoking insights.
Now, what sort of examples are to be selected and studied? There is no clear cut answer to it. Experience indicates that for particular problems certain types of instances are more appropriate than others. One can mention few examples of ‘insight-stimulating’ cases such as the reactions of strangers, the reactions of marginal individuals, the study of individuals who are in transition from one stage to another, the reactions of individuals from different social strata and the like. In general, cases that provide sharp contrasts or have striking features are considered relatively more useful while adopting this method of hypotheses formulation.
Thus, in an exploratory of formulative research study which merely leads to insights or hypotheses, whatever method or research design outlined above is adopted, the only thing essential is that it must continue to remain flexible so that many different facets of a problem may be considered as and when they arise and come to the notice of the researcher.

  1. Research design in case of descriptive and diagnostic research studies: Descriptive research studies are those studies which are concerned with describing the characteristics of a particular individual, or of a group, whereas diagnostic research studies determine the frequency with which something occurs or its association with something else. The studies concerning whether certain variables are associated are examples of diagnostic research studies. As against this, studies concerned with specific predictions, with narration of facts and characteristics concerning individual, group or situation are all examples of descriptive research studies. Most of the social research comes under this category. From the point of view of the research design, the descriptive as well as diagnostic studies share common requirements and as such we may group together these two types of research studies. In descriptive as well as in diagnostic studies, the researcher must be able to define clearly, what he wants to measure and must find adequate methods for measuring it along with a clear cut definition of ‘population’ he wants to study. Since the aim is to obtain complete and accurate information in the said studies, the procedure to be used must be carefully planned. The research design mustmake enough provision for protection against bias and must maximise reliability, with due concern for the economical completion of the research study. The design in such studies must be rigid and not flexible and must focus attention on the following:
    • Formulating the objective of the study (what the study is about and why is it being made?)
    • Designing the methods of data collection (what techniques of gathering data will be adopted?)
    • Selecting the sample (how much material will be needed?)
    • Collecting the data (where can the required data be found and with what time period should the data be related?)
    • Processing and analysing the data.
    • Reporting the findings.

In a descriptive/diagnostic study the first step is to specify the objectives with sufficient precision to ensure that the data collected are relevant. If this is not done carefully, the study may not provide the desired information.
Then comes the question of selecting the methods by which the data are to be obtained. In other words, techniques for collecting the information must be devised. Several methods (viz., observation, questionnaires, interviewing, examination of records, etc.), with their merits and limitations, are available for the purpose and the researcher may user one or more of these methods which have been discussed in detail in later chapters. While designing data-collection procedure, adequate safeguards against bias and unreliability must be ensured. Whichever method is selected, questions must be well examined and be made unambiguous; interviewers must be instructed not to express their own opinion; observers must be trained so that they uniformly record a given item of behaviour. It is always desirable to pretest the data collection instruments before they are finally used for the study purposes. In other words, we can say that “structured instruments” are used in such studies.
In most of the descriptive/diagnostic studies the researcher takes out sample(s) and then wishes to make statements about the population on the basis of the sample analysis or analyses. More often than not, sample has to be designed. Different sample designs have been discussed in detail in a separate chapter in this book. Here we may only mention that the problem of designing samples should be tackled in such a fashion that the samples may yield accurate information with a minimum amount of research effort. Usually one or more forms of probability sampling, or what is often described as random sampling, are used.

To obtain data free from errors introduced by those responsible for collecting them, it is necessary to supervise closely the staff of field workers as they collect and record information. Checks may be set up to ensure that the data collecting staff perform their duty honestly and without prejudice. “As data are collected, they should be examined for completeness, comprehensibility, consistency and reliability.”
The data collected must be processed and analysed. This includes steps like coding the interview replies, observations, etc.; tabulating the data; and performing several statistical computations. To the extent possible, the processing and analysing procedure should be planned in detail before actual work is started. This will prove economical in the sense that the researcher may avoid unnecessary labour such as preparing tables for which he later finds he has no use or on the other hand, re-doing some tables because he failed to include relevant data. Coding should be done carefully to avoid error in coding and for this purpose the reliability of coders needs to be checked. Similarly, the accuracy of tabulation may be checked by having a sample of the tables re-done. In case of mechanical tabulation the material (i.e., the collected data or information) must be entered on appropriate cards which is usually done by punching holes corresponding to a given code. The accuracy of punching is to be checked and ensured. Finally, statistical computations are needed and as such averages, percentages and various coefficients must be worked out. Probability and sampling analysis may as well be used. The appropriate statistical operations, along with the use of appropriate tests of significance should be carried out to safeguard the drawing of conclusions concerning the study.
Last of all comes the question of reporting the findings. This is the task of communicating the findings to others and the researcher must do it in an efficient manner. The layout of the report needs to be well planned so that all things relating to the research study may be well presented in simple and effective style.
Thus, the research design in case of descriptive/diagnostic studies is a comparative design throwing light on all points narrated above and must be prepared keeping in view the objective(s) of the study and the resources available. However, it must ensure the minimisation of bias and maximisation of reliability of the evidence collected. The said design can be appropriately referred to as a survey design since it takes into account all the steps involved in a survey concerning a phenomenon to be studied.
The difference between research designs in respect of the above two types of research studies can be conveniently summarised in tabular form as under:

Research Design Type of Study
Exploratory of Formulaive Descriptive/Diagnostic
Overall Design Flexible design (Design must provide opportunity for considering different aspects of the problem Rigid design (Design must make enough provision for protection against bias and must maximize reliability)
Sampling Design Non-Probability sampling design (Purpsive or Judgements Sampling) Probability sampling design (Random Sampling)
Statistical Design No Pre-planned design for analysis Pre-planned design for analysis
Observational design Unstructured instruments for collection of data Structured or well thought out instruments for collection of data
Operational Design No fixed decisions about te operational procedures Advanced decisions about operational procedures
  1. Research design in case of hypothesis-testing research studies: Hypothesis-testing research studies (generally known as experimental studies) are those where the researcher tests the hypotheses of causal relationships between variables. Such studies require procedures that will not only reduce bias and increase reliability, but will permit drawing inferences about causality. Usually experiments meet this requirement. Hence, when we talk of research design in such studies, we often mean the design of experiments.
    Professor R.A. Fisher’s name is associated with experimental designs. Beginning of such designs was made by him when he was working at Rothamsted Experimental Station (Centre for Agricultural Research in England). As such the study of experimental designs has its origin in agricultural research. Professor Fisher found that by dividing agricultural fields or plots into different blocks and then by conducting experiments in each of these blocks, whatever information is collected and inferences drawn from them, happens to be more reliable. This fact inspired him to develop certain experimental designs for testing hypotheses concerning scientific investigations. Today, the experimental designs are being used in researches relating to phenomena of several disciplines. Since experimental designs originated in the context of agricultural operations, we still use, though in a technical sense, several terms of agriculture (such as treatment, yield, plot, block etc.) in experimental designs.

Research design: Types of Research design

Research design is defined as a framework of methods and techniques chosen by a researcher to combine various components of research in a reasonably logical manner so that the research problem is efficiently handled. It provides insights about “how” to conduct research using a particular methodology. Every researcher has a list of research questions which need to be assessed – this can be done with research design.

The sketch of how research should be conducted can be prepared using research design. Hence, the market research study will be carried out on the basis of research design.

The design of a research topic is used to explain the type of research (experimental, survey, correlational, semi-experimental, review) and also its sub-type (experimental design, research problem, and descriptive case-study). There are three main sections of research design: Data collection, measurement, and analysis.

The type of research problem an organization is facing will determine the research design and not vice-versa. Variables, designated tools to gather information, how will the tools be used to collect and analyze data and other factors are decided in research design on the basis of a research technique is decided.

An impactful research design usually creates minimum bias in data and increases trust on the collected and analyzed research information. Research design which produces the least margin of error in experimental research can be touted as the best. The essential elements of research design are:

  1. Accurate purpose statement of research design
  2. Techniques to be implemented for collecting details for research
  3. Method applied for analyzing collected details
  4. Type of research methodology
  5. Probable objections for research
  6. Settings for research study
  7. Timeline
  8. Measurement of analysis

Research Design Characteristics

Neutrality: The results projected in research design should be free from bias and neutral. Understand opinions about the final evaluated scores and conclusion from multiple individuals and consider those who agree with the derived results.

Reliability: If a research is conducted on a regular basis, the researcher involved expects similar results to be calculated every time. Research design should indicate how the research questions can be formed to ensure the standard of obtained results and this can happen only when the research design is reliable.

Validity: There are multiple measuring tools available for research design but valid measuring tools are those which help a researcher in gauging results according to the objective of research and nothing else. The questionnaire developed from this research design will be then valid.

Generalization: The outcome of research design should be applicable to a population and not just a restricted sample. Generalization is one of the key characteristics of research design.

Types of Research Design

A researcher must have a clear understanding of the various types of research design to select which type of research design to implement for a study. Research design can be broadly classified into quantitative and qualitative research design.

Qualitative Research Design: Qualitative research is implemented in cases where a relationship between collected data and observation is established on the basis of mathematical calculations. Theories related to a naturally existing phenomenon can be proved or disproved using mathematical calculations. Researchers rely on qualitative research design where they are expected to conclude “why” a particular theory exists along with “what” respondents have to say about it.

Quantitative Research Design: Quantitative research is implemented in cases where it is important for a researcher to have statistical conclusions to collect actionable insights. Numbers provide a better perspective to make important business decisions. Quantitative research design is important for the growth of any organization because any conclusion drawn on the basis of numbers and analysis will only prove to be effective for the business. 

Further, research design can be divided into five types:

  1. Descriptive Research Design:In a descriptive research design, a researcher is solely interested in describing the situation or case under his/her research study. It is a theory-based research design which is created by gather, analyze and presents collected data. By implementing an in-depth research design such as this, a researcher can provide insights into the why and how of research.
  2. Experimental Research Design:Experimental research design is used to establish a relationship between the cause and effect of a situation. It is a causal research design where the effect caused by the independent variable on the dependent variable is observed. For example, the effect of an independent variable such as price on a dependent variable such as customer satisfaction or brand loyalty is monitored. It is a highly practical research design method as it contributes towards solving a problem at hand. The independent variables are manipulated to monitor the change it has on the dependent variable. It is often used in social sciences to observe human behavior by analyzing two groups affect of one group on the other.
  3. Correlational Research Design:Correlational research is a non-experimental research design technique which helps researchers to establish a relationship between two closely connected variables. Two different groups are required to conduct this research design method. There is no assumption while evaluating a relationship between two different variables and statistical analysis techniques are used to calculate the relationship between them.

Correlation between two variables is concluded using a correlation coefficient, whose value ranges between -1 and +1. If the correlation coefficient is towards +1, it indicates a positive relationship between the variables and -1 indicates a negative relationship between the two variables. 

  1. Diagnostic Research Design:In the diagnostic research design, a researcher is inclined towards evaluating the root cause of a specific topic. Elements that contribute towards a troublesome situation are evaluated in this research design method.

There are three parts of diagnostic research design:

  • Inception of the issue
  • Diagnosis of the issue
  • Solution for the issue
  1. Explanatory Research Design:In exploratory research design, the researcher’s ideas and thoughts are key as it is primarily dependent on their personal inclination about a particular topic. Explanation about unexplored aspects of a subject is provided along with details about what, how and why related to the research questions.

Elements of Research Design

research design can be described as a conceptual structure within which research is going to be carried out. It comprises the blueprint for the collection, measurement and analysis of data. Decisions with regards to what, where, when, how much, by what means concerning an enquiry or a research design are taken.

A research design is the arrangement of conditions for collection and evaluation of data in a fashion which is designed to combine relevance to the research purpose with economy in process.

The key elements of a good research design are as under:

  1. Research Design is a plan which identifies the sources and kinds of information strongly related to the research problem.
  2. It is a strategy indicating which method is going to be employed for collecting and analyzing the data.
  3. Additionally, it consists of the time and cost budgets because most research is done under these two constraints. In a nutshell a research design must contain:
  • A clear statement of the research problem.
  • Methods and techniques to be utilized for gathering information from the population to be researched.
  • Approach to be utilized in processing and analyzing data.

Purpose of the Study

  • Exploratory study: Carried out when not much is known about the problem at hand, or no details are available on how similar problems or research issues have been solved in the past.
  • Descriptive study: Carried out as a way to determine and be able to describe the characteristics of the variables of interest in a situation characteristics of the variables of interest in a situation.
  • Studies which engage in hypotheses testing generally explain the nature of certain relationships, or establish the differences among groups or the independence of two or more factors in a situation.

Type of Investigation

  • Causality Research Design: A causal study is an inquiry to understand the cause of one or more problems.
  • A correlational study: Is an inquiry to find out the key variables linked to the problem.

A causal study question:
Does cigarette smoking cause cancer?
A correlational study question:
Are cigarette smoking and cancer associated?
Or
Are cigarette smoking, consuming alcohol, and chewing tobacco related to cancer?
If so, which of these contributes most to the variance in the dependent variable?

Figure: Main Elements of Research Design

Researcher Interference

The extent of interference by the researcher with the normal flow of work at the workplace has a direct effect on whether the study performed is causal or correlational. A correlational study is carried out in the natural environment of the corporation with minimal interference by the researcher with the normal flow of work.

In studies carried out to determine cause-and-effect relationships, the investigator attempts to adjust specific variables in order to study the outcomes of such manipulation on the dependent variable of interest. Put simply, the researcher intentionally changes certain variables in the setting and disrupts the events as they normally happen in the business.

Study Setting

Correlational research is carried out in noncontrived settings (normal settings), as opposed to most causal studies are carried out in contrived settings.

Unit of Analysis

The unit of analysis means the degree of aggregation of the data gathered through the subsequent data analysis.

  • Individual
  • Dyads
  • Groups
  • Organizations
  • Cultures

Time Horizon

Cross-Sectional Studies: A study can be carried out in which data are collected only once, perhaps during a period of days or weeks or months, to be able to answer a research question.

Longitudinal Studies: Researching people or phenomena at several point in time to be able to answer the research question. Due to the fact that data are collected at two different points in time, the study is not cross-sectional kind, but is carried longitudinally across a period of time. Longitudinal studies take a longer period and energy and cost a lot more than cross-sectional studies. Having said that, well-planned longitudinal studies can help you to recognize cause-and-effect relationships.

For example, you can study the product sales before and after an advertising campaign, and provided other environmental changes haven’t influenced on the results, you can attribute the increase in the sales volume, if any, to the advertisement.

good research design must contain: a clear statement, Methods and techniques for data collection, processing and analyzing data.

Types of Research Studies, Scientific & non-Scientific methods

Scientific research is a investigating and acquiring or expanding our understanding whereas nonscientific research is acquiring knowledge and truths about the world using techniques that do not follow the scientific method.

Scientific research is a logically stepped process used for investigating and acquiring or expanding our understanding. The findings of scientific research can be reproduced and demonstrated to be consistent. While in non scientific research, the research it’s not logically stepped process that used for investigating and acquiring or expanding our understanding

Scientific research acquiring knowledge and truths about the data or information using techniques that follow the scientific methods such as identification of a problem, formulation of statement of a problem, formulation of hypothesis, data analysis data recording, presentation and interpretation, testing hypothesis and recommendation and conclusion. while Non scientific acquiring knowledge and truths about the world using techniques without follow the scientific method.

Scientific research is a systematic way of gathering data and harnessing curiosity. This research provides scientific information and theories for the explanation of the nature and the properties of the world. It makes practical applications possible. While non scientific research does not follow systematic way of gathering data and harnessing curiosity

Scientific research is a systematic way of analyzing and interpreting new or existing material through experimentation and observation, While Non scientific research is based upon investigation of natural phenomenon without systematic

In general. Scientific research and non scientific research, both are used in collection of data, information and knowledge that can be added to the existing one. Can be used to solve different disputes such as political conflict economic issues and social conflict.

Basic Postulates of Scientific Method

The scientific method is, thus, based on certain basic postulates which can be stated as under:

(i) It relies on empirical evidence

(ii) It utilizes relevant concepts

(iii) It is committed to only objective considerations

(iv) It presupposes ethical neutrality, i.e., it aims at nothing but making only adequate and correct statements about population objects

(v) It results into probabilistic predictions

(vi) Its methodology is made known to all concerned for critical scrutiny are for use in testing the conclusions through replication

(vii) It aims at formulating most general axioms or what can be termed as scientific theories.

Thus, “the scientific method encourages a rigorous, impersonal mode of procedure dictated by the demands of logic and objective procedure.” Accordingly, scientific method implies an objective, logical and systematic method, i.e., a method free from personal bias or prejudice, a method to ascertain demonstrable qualities of a phenomenon capable of being verified, a method wherein the researcher is guided by the rules of logical reasoning, a method wherein the investigation proceeds inane orderly manner and a method that implies internal consistency.

Five (5) Major Characteristics of the Scientific Method

The scientific method is the system used by scientists to explore data, generate and test hypotheses, develop new theories and confirm or reject earlier results. Although the exact methods used in the different sciences vary (for example, physicists and psychologists work in very different ways), they share some fundamental attributes that may be called characteristics of the scientific method.

1. Empirical Observation

The scientific method is empirical. That is, it relies on direct observation of the world, and disdains hypotheses that run counter to observable fact. This contrasts with methods that rely on pure reason (including that proposed by Plato) and with methods that rely on emotional or other subjective factors.

2. Replicable Experiments

Scientific experiments are replicable. That is, if another person duplicates the experiment, he or she will get the same results. Scientists are supposed to publish enough of their method so that another person, with appropriate training, could replicate the results. This contrasts with methods that rely on experiences that are unique to a particular individual or a small group of individuals.

3. Provisional Results

Results obtained through the scientific method are provisional; they are (or ought to be) open to question and debate. If new data arise that contradict a theory, that theory must be modified. For example, the phlogiston theory of fire and combustion was rejected when evidence against it arose.

4. Objective Approach

The scientific method is objective. It relies on facts and on the world as it is, rather than on beliefs, wishes or desires. Scientists attempt (with varying degrees of success) to remove their biases when making observations.

5. Systematic Observation

Strictly speaking, the scientific method is systematic; that is, it relies on carefully planned studies rather than on random or haphazard observation. Nevertheless, science can begin from some random observation. Isaac Asimov said that the most exciting phrase to hear in science is not “Eureka!” but “That’s funny.” After the scientist notices something funny, he or she proceeds to investigate it systematically.

Attitude Measurement and Scales

The term scaling is applied to the attempts to measure the attitude objectively. Attitude is a resultant of number of external and internal factors. Depending upon the attitude to be measured, appropriate scales are designed. Scaling is a technique used for measuring qualitative responses of respondents such as those related to their feelings, perception, likes, dislikes, interests and preferences.

Types of Scales

Most frequently used Scales

  1. Nominal Scale
  2. Ordinal Scale
  3. Interval Scale
  4. Ratio Scale

Self Rating Scales

  1. Graphic Rating Scale
  2. Itemized Rating Scales
    1. Likert Scale
    2. Semantic Differential Scale
    3. Stapel’s Scale
    4. Multi Dimensional Scaling
    5. Thurston Scales
    6. Guttman Scales/Scalogram Analysis
    7. The Q Sort technique

Four types of scales are generally used for Marketing Research.

1. Nominal Scale

This is a very simple scale. It consists of assignment of facts/choices to various alternative categories which are usually exhaustive as well mutually exclusive. These scales are just numerical and are the least restrictive of all the scales. Instances of Nominal Scale are – credit card numbers, bank account numbers, employee id numbers etc. It is simple and widely used when relationship between two variables is to be studied. In a Nominal Scale numbers are no more than labels and are used specifically to identify different categories of responses. Following example illustrates –

What is your gender?
[  ] Male
[  ] Female

Another example is – a survey of retail stores done on two dimensions – way of maintaining stocks and daily turnover.

How do you stock items at present?
[  ] By product category
[  ] At a centralized store
[  ] Department wise
[  ] Single warehouse

Daily turnover of consumer is?
[  ] Between 100 – 200
[  ] Between 200 – 300
[  ] Above 300

A two way classification can be made as follows

Daily/Stock Turnover Method Product Category Department wise Centralized Store Single Warehouse
100 – 200        
200 – 300        
Above 300        

Mode is frequently used for response category.

2. Ordinal Scale

Ordinal scales are the simplest attitude measuring scale used in Marketing Research. It is more powerful than a nominal scale in that the numbers possess the property of rank order. The ranking of certain product attributes/benefits as deemed important by the respondents is obtained through the scale.

Example 1: Rank the following attributes (1 – 5), on their importance in a microwave oven.

  1. Company Name
  2. Functions
  3. Price
  4. Comfort
  5. Design

The most important attribute is ranked 1 by the respondents and the least important is ranked 5. Instead of numbers, letters or symbols too can be used to rate in a ordinal scale. Such scale makes no attempt to measure the degree of favourability of different rankings.

Example 2 – If there are 4 different types of fertilizers and if they are ordered on the basis of quality as Grade A, Grade B, Grade C, Grade D is again an Ordinal Scale.

Example 3 – If there are 5 different brands of Talcom Powder and if a respondent ranks them based on say, “Freshness” into Rank 1 having maximum Freshness Rank 2 the second maximum Freshness, and so on, an Ordinal Scale results.

Median and mode are meaningful for ordinal scale.

3. Interval Scale

Herein the distance between the various categories unlike in Nominal, or numbers unlike in Ordinal, are equal in case of Interval Scales. The Interval Scales are also termed as Rating Scales. An Interval Scale has an arbitrary Zero point with further numbers placed at equal intervals. A very good example of Interval Scale is a Thermometer.

illustration 1 How do you rate your present refrigerator for the following qualities.

Company Name Less Known 1 2 3 4 5 Well Known
Functions Few 1 2 3 4 5 Many
Price Low 1 2 3 4 5 High
Design Poor 1 2 3 4 5 Good
Overall Satisfaction Very Dis-Satisfied 1 2 3 4 5 Very Satisfied

Such a scale permits the researcher to say that position 5 on the scale is above position 4 and also the distance from 5 to 4 is same as distance from 4 to 3. Such a scale however does not permit conclusion that position 4 is twice as strong as position 2 because no zero position has been established. The data obtained from the Interval Scale can be used to calculate the Mean scores of each attributes over all respondents. The Standard Deviation (a measure of dispersion) can also be calculated.

4. Ratio Scale

Ratio Scales are not widely used in Marketing Research unless a base item is made available for comparison. In the above example of Interval scale, a score of 4 in one quality does not necessarily mean that the respondent is twice more satisfied than the respondent who marks 2 on the scale. A Ratio scale has a natural zero point and further numbers are placed at equally appearing intervals. For example scales for measuring physical quantities like  length, weight, etc.

The ratio scales are very common in physical scenarios. Quantified responses forming a ratio scale analytically are the most versatile. Rati scale possess all he characteristics of an internal scale, and the ratios of the numbers on these scales have meaningful interpretations. Data on certain demographic or descriptive attributes, if they are obtained through open-ended questions, will have ratio-scale properties. Consider the following questions :

Q 1) What is your annual income before taxes? ______ $
Q 2) How far is the Theater from your home ? ______ miles

Answers to these questions have a natural, unambiguous starting point, namely zero. Since starting point is not chosen arbitrarily, computing and interpreting ratio makes sense. For example we can say that a respondent with an annual income of $ 40,000 earns twice as much as one with an annual income of $ 20,000.

Self Rating Scales

1. Graphic Rating Scale

The respondents rate the objects by placing a mark at the appropriate position on a line that runs from one extreme of the criterion variable to another. Example

0
(poor quality)
1
(bad quality)
5
(neither good nor bad)
7
(good quality)

BRAND 1

This is also known as continuous rating scale. The customer can occupy any position. Here one attribute is taken ex-quality of any brand of icecream.

poor good

BRAND 2

This line can be vertical or horizontal and scale points may be provided. No other indication is there on the continuous scale. A range is provided. To quantify the responses to question that “indicate your overall opinion about ice-ream Brand 2 by placing a tick mark at appropriate position on the line”, we measure the physical distance between the left extreme position and the response position on the line.; the greater the distance, the more favourable is the response or attitude towards the brand.

Its limitation is that coding and analysis will require substantial amount of time, since we first have to measure the physical distances on the scale for each respondent.

2. Itemized Rating Scales

These scales are different from continuous rating scales. They have a number of brief descriptions associated with each category. They are widely used in Marketing Research. They essentially take the form of the multiple category questions. The most common are – Likert, Sementic, Staple and Multiple Dimension. Others are – Thurston and Guttman.

a. Likert Scale

It was developed Rensis Likert. Here the respondents are asked to indicate a degree of agreement and disagreement with each of a series of statement. Each scale item has 5 response categories ranging from strongly agree and strongly disagree.

5
Strongly agree
4
Agree
3
Indifferent
2
Disagree
1
Strongly disagree

Each statement is assigned a numerical score ranging from 1 to 5. It can also be scaled as -2 to +2.

-2 -1 0 1 2

For example quality of Mother Diary ice-cream is poor then Not Good is a negative statement and Strongly Agree with this means the quality is not good.

Each degree of agreement is given a numerical score and the respondents total score is computed by summing these scores. This total score of respondent reveals the particular opinion of a person.

Likert Scale are of ordinal type, they enable one to rank attitudes, but not to measure the difference between attitudes. They take about the same amount of efforts to create as Thurston scale and are considered more discriminating and reliable because of the larger range of responses typically given in Likert scale.

A typical Likert scale has 20 – 30 statements. While designing a good Likert Scale, first a large pool of statements relevant to the measurement of attitude has to be generated and then from the pool statements, the statements which are vague and non-discriminating have to be eliminated.

Thus, likert scale is a five point scale ranging from ’strongly agreement’to ’strongly disagreement’. No judging gap is involved in this method.

b. Semantic Differential Scale

This is a seven point scale and the end points of the scale are associated with bipolar labels.

1
Unpleasant
Submissive
2 3 4 5 6 7
Pleasant
Dominant

Suppose we want to know personality of a particular person. We have options-

  1. Unpleasant/Submissive
  2. Pleasant/Dominant

Bi-polar means two opposite streams. Individual can score between 1 to 7 or -3 to 3. On the basis of these responses profiles are made. We can analyse for two or three products and by joining these profiles we get profile analysis. It could take any shape depending on the number of variables.

Profile Analysis

—————/—————
———-/——————–
——–/———————-

Mean and median are used for comparison. This scale helps to determine overall similarities and differences among objects.

When Semantic Differential Scale is used to develop an image profile, it provides a good basis for comparing images of two or more items. The big advantage of this scale is its simplicity, while producing results compared with those of the more complex scaling methods. The method is easy and fast to administer, but it is also sensitive to small differences in attitude, highly versatile, reliable and generally valid.

c. Stapel’s Scale

It was developed by Jan Stapel. This scale has some distinctive features:-

  • Each item has only one word/phrase indicating the dimension it represents.
  1. Each item has ten response categories.
  • Each item has an even number of categories.
  1. The response categories have numerical labels but no verbal labels.

For example, in the following items, suppose for quality of ice cream, we ask respondents to rank from +5 to -5. Select a plus number for words which best describe the ice cream accurately. Select a minus number for words you think do not describe the ice cream quality accurately. Thus, we can select any number from +5,for words we think are very accurate, to -5,for words we think are very inaccurate. This scale is usually presented vertically.

+5
+4
+3
+2
+1
High Quality
-1
-2
-3
-4
-5

This is a unipolar rating scale.

d. Multi Dimensional Scaling

It consists of a group of analytical techniques which are used to study consumer attitudes related to perceptions and preferences. It is used to study-

  • .The major attributes of a given class of products perceivedby the consumers in considering the product and by which they compare the different ranks.
  1. To study which brand competes most directly with each other.
  2. To find out whether the consumers would like a new brand with a combination of characteristics not found in the market.
  • What would be the consumers ideal combination of product attributes.
  1. What sales and advertising messages are compatible with consumers brand perceptions.

It is a computer based technique. The respondents are asked to place the various brands into different groups like similar, very similar, not similar, and so on. A goodness of fit is traded off on a large number of attributes. Then a lack of fit index is calculated by computer program. The purpose is to find a reasonably small number of dimensions which will eliminate most of the stress. After the configuration for the consumer’s preference has been developed, the next step is to determine the preference with regards to the product under study. These techniques attempt to identify the product attributes that are important to consumers and to measure their relative importance.

This scaling involves a unrealistic assumption that a consumer who compares different brands would perceive the differences on the basis of only one attribute. For example, what are the attributes for joining M.Com course. The responses may be -to do PG, to go into teaching line,to get knowledge, appearing in the NET. There are a number of attributes, you can not base decision on one attribute only. Therefore, when the consumers are choosing between brands, they base their decision on various attributes. In practice, the perceptions of the consumers involve different attributes and any one consumer perceives each brand as a composite of a number of different attributes. This is a shortcoming of this scale.

Whenever we choose from a number of alternatives, go for multi- dimensional scaling. There are many possible uses of such scaling like in market segmentation, product life cycle, vendor evaluations and advertising media selection.

The limitation of this scale is that it is difficult to clearly define the concept of similarities and preferences. Further the distances between the items are seen as different

e. Thurston Scales

These are also known as equal appearing interval scales. They are used to measure the attitude towards a given concept or construct. For this purpose a large number of statements are collected that relate to the concept or construct being measured. The judges rate these statements along an 11 category scale in which each category expresses a different degree of favourableness towards the concept. The items are then ranked according to the mean or median ratings assigned by the judges and are used to construct questionnaire of twenty to thirty items that are chosen more or less evenly across the range of ratings.

The statements are worded in such a way so that a person can agree or disagree with them. The scale is then administered to assemble of respondents whose scores are determined by computing the mean or median value of the items agreed with. A person who disagrees with all the items has a score of zero. So, the advantage of this scale is that it is an interval measurement scale. But it is the time consuming method and labour intensive. They are commonly used in psychology and education research.

f. Guttman Scales/Scalogram Analysis

It is based on the idea that items can be arranged along a continuem in such a way that a person who agrees with an item or finds an item acceptable will also agree with or find acceptable all other items expressing a less extreme position. For example – Children should not be allowed to watch indecent programmes or government should ban these programmes or they are not allowed to air on the television. They all are related to one aspect.

In this scale each score represents a unique set of responses and therefore the total score of every individual is obtained. This scale takes a lot of time and effort in development.

They are very commonly used in political science, anthropology, public opinion, research and psychology.

g. The Q Sort technique

It is used to discriminate among large number of objects quickly. It uses a rank order procedure and the objects are sorted into piles based on similarity with respect to some criteria. The number of objects to be sorted should be between 60-140 approximately. For example, here we are taking nine brands. On the basis of taste we classify the brands into tasty, moderate and non tasty.

We can classify on the basis of price also-Low, medium, high. Then we can attain the perception of people that whether they prefer low priced brand, high or moderate. We can classify sixty brands or pile it into three piles. So the number of objects is to be placed in three piles-low, medium or high.

Thus, the Q-sort technique is an attempt to classify subjects in terms of their similarity to attribute under study.

Importance of Sampling

Types of Sampling

There are many different types of sampling methods, here’s a summary of the most common:

Cluster sampling

Units in the population can often be found in certain geographic groups or “clusters” for example, primary school children in Derbyshire.

A random sample of clusters is taken, then all units within the cluster are examined.

Advantages

  • Quick and easy
  • Doesn’t need complete population information
  • Good for face-to-face surveys

Disadvantages

  • Expensive if the clusters are large
  • Greater risk of sampling error

Convenience sampling

Uses those who are willing to volunteer and easiest to involve in the study.

Advantages

  • Subjects are readily available
  • Large amounts of information can be gathered quickly

Disadvantages

  • The sample is not representative of the entire population, so results can’t speak for them inferences are limited.
  • Prone to volunteer bias

Judgement sampling

A deliberate choice of a sample the opposite of random

Advantages

  • Good for providing illustrative examples or case studies

Disadvantages

  • Very prone to bias
  • Samples often small
  • Cannot extrapolate from sample

Quota sampling

The aim is to obtain a sample that is “representative” of the overall population.

The population is divided (“stratified”) by the most important variables such as income, age and location. The required quota sample is then drawn from each stratum.

Advantages

  • Quick and easy way of obtaining a sample

Disadvantages

  • Not random, so some risk of bias
  • Need to understand the population to be able to identify the basis of stratification

Simply random sampling

This makes sure that every member of the population has an equal chance of selection.

Advantages

  • Simple to design and interpret
  • Can calculate both estimate of the population and sampling error

Disadvantages

  • Need a complete and accurate population listing
  • May not be practical if the sample requires lots of small visits over the country

Systematic sampling

  • After randomly selecting a starting point from the population between 1 and *n, every nth unit is selected.

*n equals the population size divided by the sample size.

Advantages

  • Easier to extract the sample than via simple random
  • Ensures sample is spread across the population

Disadvantages

  • Can be costly and time consuming if the sample is not conveniently located

Importance of Sampling Design

Save Time

Contacting everyone in a population takes time. And, invariably, some people will not respond to the first effort at contacting them, meaning researchers have to invest more time for follow-up. Random sampling is much faster than surveying everyone in a population, and obtaining a non-random sample is almost always faster than random sampling. Thus, sampling saves researchers lots of time.

Save Money

The number of people a researcher contacts is directly related to the cost of a study. Sampling saves money by allowing researchers to gather the same answers from a sample that they would receive from the population.

Non-random sampling is significantly cheaper than random sampling, because it lowers the cost associated with finding people and collecting data from them. Because all research is conducted on a budget, saving money is important.

Collect Richer Data

Sometimes, the goal of research is to collect a little bit of data from a lot of people (e.g., an opinion poll). At other times, the goal is to collect a lot of information from just a few people (e.g., a user study or ethnographic interview). Either way, sampling allows researchers to ask participants more questions and to gather richer data than does contacting everyone in a population.

The Importance of Knowing Where to Sample

Efficient sampling has a number of benefits for researchers. But just as important as knowing how to sample is knowing where to sample. Some research participants are better suited for the purposes of a project than others. Finding participants that are fit for the purpose of a project is crucial, because it allows researchers to gather high-quality data.

For example, consider an online research project. A team of researchers who decides to conduct a study online has several different sources of participants to choose from. Some sources provide a random sample, and many more provide a non-random sample. When selecting a non-random sample, researchers have several options to consider. Some studies are especially well-suited to an online panel that offers access to millions of different participants worldwide. Other studies, meanwhile, are better suited to a crowdsourced site that generally has fewer participants overall but more flexibility for fostering participant engagement.

To make these options more tangible, let’s look at examples of when researchers might use different kinds of online samples.

Methods used for collection of different Data Types

Quantitative data collection methods typically use standardized response categories. Surveys are the most common example. Respondents are asked to choose among responses that best characterize their perceptions, attitudes, knowledge, or opinions. The advantage of quantitative data is that it efficiently measures the reactions of many people which facilitates statistical aggregation of the data, including making comparisons by subgroups. Using sound sampling procedures to represent the population and obtaining adequate response rates are critical. Provided your sample size is large enough, and your methods and analysis are sound, this method of data collection provides a broad, generalizable set of findings. This means that they can be used to learn about the entire population that you are studying.

By contrast, qualitative data collection methods typically produce detailed data about a much smaller number of people. Qualitative data can provide rich information through direct quotation and careful description of programs, events, people, interactions, and observed behaviors. The advantage and disadvantage of such descriptions, quotations, and case studies is that they are collected as open-ended narratives. Observations are not fit to categories so rigorous and systematic analysis of content can be tedious and time-consuming.

One of the most common qualitative data collection techniques is the interview which may be with individuals or a group. In a group interview, or focus group, a moderator conducts a discussion among five to ten people in order to learn their opinions, attitudes, and thought processes about a given topic. The group dynamic encourages a deeper level of discussion and allows the moderator to probe for topics that are important. Note that the term focus group is often misused to refer to any meeting of any group of people about a given topic. In actuality, focus groups as well as individual interviews, are systemically structured and discussion is carefully guided to allow for drawing conclusions and making comparisons. Qualitative data can also be collected from written sources such as journals, open-ended survey questions, and reaction sheets completed by observers or participants.

An ethnographic approach to evaluation collects qualitative data. Maribel Alvarez describes in her case study, Two-Way Mirror: Ethnography as a Way to Assess Civic Impact of Arts-based Engagement in Tucson, AZ, that ethnographic evaluation emphasizes listening carefully and observing real-life actions to understand how people make sense of their lives. An ethnographic evaluation produces “data collection” of a distinct kind subjective accounts of how people actually interact with systems, programs, and policies. This data is collected through experiences of the evaluator in the field, side by side with participants.

Data Collection

Data collection is a process of collecting information from all the relevant sources to find answers to the research problem, test the hypothesis and evaluate the outcomes. Data collection methods can be divided into two categories: secondary methods of data collection and primary methods of data collection.

Methods of data collection for primary and secondary Data

(1) Primary data

Primary data are original observations collected by the researcher or his agent for the first time for any investigation and used by them in the statistical analysis.

The primary data is the one type of important data. It is collection of data from first hand information.

This information published by one organization for some purposes. This type of primary data is mostly pure and original data.

The primary data collection is having three different data collection methods are:-

  • Data Collection through Investigation:

In this method, trained investigators are working as employees for collecting the data. The researchers will use the tools like interview and collect the information from  the individual persons.

  • Personal Investigation Methods:

The researchers or the data collectors will conduct the survey and hence they collect the data. In this method we have to collect more accurate data and original data. This method is useful for small data collection only not big collection of data projects.

  • Data Collection through Telephones:

The data researcher uses the tools like telephones, mobile phones to collect the information or data. This is accurate and very quick process for data collection. But information collected is not accurate and true.

(2) Secondary data

The secondary data is the other type of data, which is collection of data from second hand information. This information is known as, given data is already collected from any one persons for some purpose, and it has available for the present issues. And mostly these secondary data’s are not relevant and pure or original data

Two important methods:

a) Official methods:

Data collecting from the ministry of finance, Agriculture, Industry and etc. These data collection methods are official methods. This methods are used the tools of phone calls and surveys.

b) Semi–official methods:

This is the method of data collection from Railway boards, banks, population committee etc. This methods only used for the focusing groups, and interviews, and electronic mail surveys.

Ways of Collections

In this case the data’s are already available, it means the data’s are already collected and analyzed by someone else. It can be either published or unpublished data. When using the secondary data, the following characteristics must be followed:

  • Reliability
  • Suitability
  • Adequate data

These data’s can be collected from the following places:

a) Official

b) Newspapers and journals

c) Research organizations like universities.

Secondary sources are data that already exist

  • Previous research
  • Official statistics
  • Mass media products
  • Diaries
  • Letters
  • Government reports
  • Web information
  • Historical data and information

Types of Data collection

  1. Observation:

Observation method has occupied an important place in descriptive sociological research. It is the most significant and common technique of data collection. Analysis of questionnaire responses is concerned with what people think and do as revealed by what they put on paper. The responses in interview are revealed by what people express in conversation with the interviewer. Observation seeks to ascertain what people think and do by watching them in action as they express themselves in various situations and activities.

Observation is the process in which one or more persons observe what is occurring in some real life situation and they classify and record pertinent happenings according to some planned schemes. It is used to evaluate the overt behaviour of individuals in controlled or uncontrolled situation. It is a method of research which deals with the external behaviour of persons in appropriate situations.

According to P.V. Young, “Observation is a systematic and deliberate study through eye, of spontaneous occurrences at the time they occur. The purpose of observation is to perceive the nature and extent of significant interrelated elements within complex social phenomena, culture patterns or human conduct”.

From this definition it is clearly understood that observation is a systematic viewing with the help of the eye. Its objective is to discover important mutual relations between spontaneously occurring events and explore the crucial facts of an event or a situation. So it is clearly visible that observation is not simply a random perceiving, but a close look at crucial facts. It is a planned, purposive, systematic and deliberate effort to focus on the significant facts of a situation.

According to Oxford Concise Dictionary, “Observation means accurate watching, knowing of phenomena as they occur in nature with regard to cause and effect or mutual relations”.

This definition focuses on two important points:

Firstly, in observation the observer wants to explore the cause-effect relationships between facts of a phenomenon.

Secondly, various facts are watched accurately, carefully and recorded by the observer.

  1. Interview:

Interview as a technique of data collection is very popular and extensively used in every field of social research. The interview is, in a sense, an oral questionnaire. Instead of writing the response, the interviewee or subject gives the needed information verbally in a face-to-face relationship. The dynamics of interviewing, however, involves much more than an oral questionnaire.

Interview is relatively more flexible tool than any written inquiry form and permits explanation, adjustment and variation according to the situation. The observational methods, as we know, are restricted mostly to non-verbal acts. So these are understandably not so effective in giving information about person’s past and private behaviour, future actions, attitudes, perceptions, faiths, beliefs thought processes, motivations etc.

The interview method as a verbal method is quite significant in securing data about all these aspects. In this method a researcher or an interviewer can interact with his respondents and know their inner feelings and reactions. G.W. Allport in his classic statement sums this up beautifully by saying that “if you want to know how people feel, what they experience and what they remember, what their emotions and motives are like and the reasons for acting as they do, why not ask them”.

Interview is a direct method of inquiry. It is simply stated as a social process in which a person known as the interviewer asks questions usually in a face to face contact to the other person or persons known as interviewee or interviewees. The interviewee responds to these and the interviewer collects various information from these responses through a very healthy and friendly social interaction.

However, it does not mean that all the time it is the interviewer who asks the questions. Often the interviewee may also ask certain questions and the interviewer responds to these. But usually the interviewer initiates the interview and collects the information from the interviewee.

Interview is not a simple two-way conversation between an interrogator and informant. According to P.V. Young, “interview may be regarded as a systematic method by which a person enters more or less imaginatively into the life of a comparative stranger”. It is a mutual interaction of each other.

The objectives of the interviewer are to penetrate the outer and inner life of persons and to collect information pertaining to a wide range of their experiences in which the interviewee may wish to rehearse his past, define his present and canvass his future possibilities. These answers of the interviewees may not be only a response to a question but also a stimulus to progressive series of other relevant statements about social and personal phenomena.

In similar fashion, W.J. Goode and P.K Hatt have observed that “interviewing is fundamentally a process of social interaction”. In the interview two persons are not merely present at the same place but also influence each other emotionally and intellectually.

  1. Schedule:

Schedule is one of the very commonly used tools of data collection in scientific investigation. P.V. Young says “The schedule has been used for collection of personal preferences, social attitudes, beliefs, opinions, behaviour patterns, group practices and habits and much other data”. The increasing use of schedule is probably due to increased emphasis by social scientists on quantitative measurement of uniformly accumulated data.

Schedule is very much similar to questionnaire and there is very little difference between the two so far as their construction is concerned. The main difference between these two is that whereas the schedule is used in direct interview on direct observation and in it the questions are asked and filled by the researcher himself, the questionnaire is generally mailed to the respondent, who fills it up and returns it to the researcher. Thus the main difference between them lies in the method of obtaining data.

Goode and Hatt says, “Schedule is the name usually applied to a set of questions which are asked and filled by an interviewer in a face to face situation with other person”. Webster defines a schedule as “a formal list, a catalogue or inventory and may be a counting device, used in formal and standardized inquiries, the sole purpose of which is aiding in the collection of quantitative cross-sectional data”.

The success of schedule largely depends on the efficiency and tactfulness of the interviewer rather than the quality of questions posed. Because the interviewer himself asks all the questions and fills the answers all by himself, here the quality of question has less significance.

  1. Questionnaire:

Questionnaire provides the most speedy and simple technique of gathering data about groups of individuals scattered in a wide and extended field. In this method, a questionnaire form is sent usually by post to the persons concerned, with a request to answer the questions and return the questionnaire.

According to Goode and Hatt “It is a device for securing answers to questions by using a form which the respondent fills in himself. According to GA. Lundberg “Fundamentally the questionnaire is a set of stimuli to which illiterate people are exposed in order to observe their verbal behaviour under these stimuli”.

Often the term “questionnaire” and “schedule” are considered as synonyms. Technically, however, there is a difference between these two terms. A questionnaire consists of a set of questions printed or typed in a systematic order on a form or set of forms. These form or forms are usually sent by the post to the respondents who are expected to read and understand the questions and reply to them in writing in the spaces given for the purposes on the said form or forms. Here the respondents have to answer the questions on their own.

On the other hand schedule is also a form or set of forms containing a number of questions. But here the researcher or field worker puts the question to the respondent in a face to face situation, clarifies their doubts, offers the necessary explanation and most significantly fills their answers in the relevant spaces provided for the purpose.

Since the questionnaire is sent to a selected number of individuals, its scope is rather limited but within its limited scope it can prove to be the most effective means of eliciting information, provided that it is well formulated and the respondent fills it properly.

A properly constructed and administered questionnaire may serve as a most appropriate and useful data gathering device.

  1. Projective Techniques:

The psychologists and psychiatrists had first devised projective techniques for the diagnosis and treatment of patients afflicted by emotional disorders. Such techniques are adopted to present a comprehensive profile of the individual’s personality structure, his conflicts and complexes and his emotional needs. Adoption of such techniques is not an easy affair. It requires intensive specialized training.

The stimuli applied in projective tests may arouse in the individuals, undergoing the tests, varieties of reaction. Hence, in projective tests the individual’s responses to the stimulus situation are not considerate at their face value because there are no ‘right’ or ‘wrong’ answers. Rather emphasis is laid on his perception or the meaning he attaches to it and the way in which the endeavors to manipulate it or organizes it.

The purpose is never clearly indicated by the nature of the stimuli and the way of their presentation. This also does not provide the way of interpretation of the responses. Since the individual is not asked to describe about himself directly and since he is provided with stimulus in the form of a photograph or a picture or on ink- blot, etc., the responses to these stimuli are construed as the indicators of the individual’s own view of the world, his personality structure, his needs, tensions and anxieties etc., says Bell.

  1. Case Study Method:

According to Biesanz and Biesenz “the case study is a form of qualitative analysis involving the very careful and complete observation of a person, a situation or an institution.” In the words of Goode and Hatt, “Case study is a way of organizing social data so as to preserve the unitary character of the social object being studied.” P.V. young defines case study as a method of exploring and analyzing the life of a social unit, be that a person, a family, an institution, cultural group or even entire community.”

In the words of Giddings “the case under investigation may be one human individual only or only an episode in first life or it might conceivably be a Nation or an epoch of history.” Ruth Strong maintains that “the case history or study is a synthesis and interpretation of information about a person and his relationship to his environment collected by means of many techniques.”

Shaw and Clifford hold that “case study method emphasizes the total situation or combination of factors, the description of the process or consequences of events in which behaviour occurs, the study of individual behaviour in its total setting and the analysis and comparison of cases leading to formulation of hypothesis.”

Test of Hypothesis

Hypothesis Testing Concept

Hypothesis testing is a statistical technique that is used in a variety of situations. Though the technical details differ from situation to situation, all hypothesis tests use the same core set of terms and concepts. The following descriptions of common terms and concepts refer to a hypothesis test in which the means of two populations are being compared.

NULL HYPOTHESIS

The null hypothesis is a clear statement about the relationship between two (or more) statistical objects. These objects may be measurements, distributions, or categories. Typically, the null hypothesis, as the name implies, states that there is no relationship.

In the case of two population means, the null hypothesis might state that the means of the two populations are equal.

ALTERNATIVE HYPOTHESIS

Once the null hypothesis has been stated, it is easy to construct the alternative hypothesis. It is essentially the statement that the null hypothesis is false. In our example, the alternative hypothesis would be that the means of the two populations are not equal.

SIGNIFICANCE

The significance level is a measure of the statistical strength of the hypothesis test. It is often characterized as the probability of incorrectly concluding that the null hypothesis is false.

The significance level is something that you should specify up front. In applications, the significance level is typically one of three values: 10%, 5%, or 1%. A 1% significance level represents the strongest test of the three. For this reason, 1% is a higher significance level than 10%.

POWER

Related to significance, the power of a test measures the probability of correctly concluding that the null hypothesis is true. Power is not something that you can choose. It is determined by several factors, including the significance level you select and the size of the difference between the things you are trying to compare.

Unfortunately, significance and power are inversely related. Increasing significance decreases power. This makes it difficult to design experiments that have both very high significance and power.

TEST STATISTIC

The test statistic is a single measure that captures the statistical nature of the relationship between observations you are dealing with. The test statistic depends fundamentally on the number of observations that are being evaluated. It differs from situation to situation.

DISTRIBUTION OF THE TEST STATISTIC

The whole notion of hypothesis rests on the ability to specify (exactly or approximately) the distribution that the test statistic follows. In the case of this example, the difference between the means will be approximately normally distributed (assuming there are a relatively large number of observations).

ONE-TAILED VS. TWO-TAILED TESTS

Depending on the situation, you may want (or need) to employ a one- or two-tailed test. These tails refer to the right and left tails of the distribution of the test statistic. A two-tailed test allows for the possibility that the test statistic is either very large or very small (negative is small). A one-tailed test allows for only one of these possibilities.

In an example where the null hypothesis states that the two population means are equal, you need to allow for the possibility that either one could be larger than the other. The test statistic could be either positive or negative. So, you employ a two-tailed test.

The null hypothesis might have been slightly different, namely that the mean of population 1 is larger than the mean of population 2. In that case, you don’t need to account statistically for the situation where the first mean is smaller than the second. So, you would employ a one-tailed test.

CRITICAL VALUE

The critical value in a hypothesis test is based on two things: the distribution of the test statistic and the significance level. The critical value(s) refer to the point in the test statistic distribution that give the tails of the distribution an area (meaning probability) exactly equal to the significance level that was chosen.

DECISION

Your decision to reject or accept the null hypothesis is based on comparing the test statistic to the critical value. If the test statistic exceeds the critical value, you should reject the null hypothesis. In this case, you would say that the difference between the two population means is significant. Otherwise, you accept the null hypothesis.

P-VALUE

The p-value of a hypothesis test gives you another way to evaluate the null hypothesis. The p-value represents the highest significance level at which your particular test statistic would justify rejecting the null hypothesis. For example, if you have chosen a significance level of 5%, and the p-value turns out to be .03 (or 3%), you would be justified in rejecting the null hypothesis.

Hypothesis testing was introduced by Ronald Fisher, Jerzy Neyman, Karl Pearson and Pearson’s son, Egon Pearson.   Hypothesis testing is a statistical method that is used in making statistical decisions using experimental data.  Hypothesis Testing is basically an assumption that we make about the population parameter.

Hypothesis Testing is done to help determine if the variation between or among groups of data is due to true variation or if it is the result of sample variation. With the help of sample data we form assumptions about the population, then we have to test our assumptions statistically. This is called Hypothesis testing.

Key terms and concepts:

(i) Null hypothesis: Null hypothesis is a statistical hypothesis that assumes that the observation is due to a chance factor.  Null hypothesis is denoted by; H0: μ1 = μ2, which shows that there is no difference between the two population means.

(ii) Alternative hypothesis: Contrary to the null hypothesis, the alternative hypothesis shows that observations are the result of a real effect.

(iii) Level of significance: Refers to the degree of significance in which we accept or reject the null-hypothesis.  100% accuracy is not possible for accepting or rejecting a hypothesis, so we therefore select a level of significance that is usually 5%.

(iv) Type I error: When we reject the null hypothesis, although that hypothesis was true.  Type I error is denoted by alpha.  In hypothesis testing, the normal curve that shows the critical region is called the alpha region.

(v) Type II errors: When we accept the null hypothesis but it is false.  Type II errors are denoted by beta.  In Hypothesis testing, the normal curve that shows the acceptance region is called the beta region.

(vi) Power: Usually known as the probability of correctly accepting the null hypothesis.  1-beta is called power of the analysis.

(vii) One-tailed test: When the given statistical hypothesis is one value like H0: μ1 = μ2, it is called the one-tailed test.

(viii) Two-tailed test: When the given statistics hypothesis assumes a less than or greater than value, it is called the two-tailed test.

Importance of Hypothesis Testing

Hypothesis testing is one of the most important concepts in statistics because it is how you decide if something really happened, or if certain treatments have positive effects, or if groups differ from each other or if one variable predicts another. In short, you want to proof if your data is statistically significant and unlikely to have occurred by chance alone. In essence then, a hypothesis test is a test of significance.

Possible Conclusions

Once the statistics are collected and you test your hypothesis against the likelihood of chance, you draw your final conclusion. If you reject the null hypothesis, you are claiming that your result is statistically significant and that it did not happen by luck or chance. As such, the outcome proves the alternative hypothesis. If you fail to reject the null hypothesis, you must conclude that you did not find an effect or difference in your study. This method is how many pharmaceutical drugs and medical procedures are tested.

Steps in Hypothesis Testing

Step 1: State the Null Hypothesis

The null hypothesis can be thought of as the opposite of the “guess” the research made (in this example the biologist thinks the plant height will be different for the fertilizers).  So the null would be that there will be no difference among the groups of plants.  Specifically in more statistical language the null for an ANOVA is that the means are the same

Step 2: State the Alternative Hypothesis

The reason we state the alternative hypothesis this way is that if the Null is rejected, there are many possibilities.

For example, [Math Processing Error] is one possibility, as is [Math Processing Error]. Many people make the mistake of stating the Alternative Hypothesis as:  [Math Processing Error] which says that every mean differs from every other mean. This is a possibility, but only one of many possibilities. To cover all alternative outcomes, we resort to a verbal statement of ‘not all equal’ and then follow up with mean comparisons to find out where differences among means exist.  In our example, this means that fertilizer 1 may result in plants that are really tall, but fertilizers 2, 3 and the plants with no fertilizers don’t differ from one another.  A simpler way of thinking about this is that at least one mean is different from all others.

Step 3: Set [Math Processing Error]

If we look at what can happen in a hypothesis test, we can construct the following contingency table:

In Reality
Decision H0 is TRUE H0 is FALSE
Accept H0 OK Type II Error
β = probability of Type II Error
Reject H0 Type I Error
α = probability of Type I Error
OK

You should be familiar with type I and type II errors from your introductory course.  It is important to note that we want to set [Math Processing Error] before the experiment (a-priori) because the Type I error is the more ‘grevious’ error to make. The typical value of [Math Processing Error] is 0.05, establishing a 95% confidence level. For this course we will assume [Math Processing Error] =0.05.

Step 4: Collect Data

Remember the importance of recognizing whether data is collected through an experimental design or observational. 

Step 5: Calculate a test statistic

For categorical treatment level means, we use an F statistic, named after R.A. Fisher. We will explore the mechanics of computing the Fstatistic beginning in Lesson 2. The F value we get from the data is labeled Fcalculated.

Step 6: Construct Acceptance / Rejection regions

As with all other test statistics, a threshold (critical) value of F is established. This F value can be obtained from statistical tables, and is referred to as Fcritical or [Math Processing Error].  As a reminder, this critical value is the minimum value for the test statistic (in this case the F test) for us to be able to reject the null. 

The F distribution, [Math Processing Error], and the location of Acceptance / Rejection regions are shown in the graph below:

Step 7: Based on steps 5 and 6, draw a conclusion about H0

If the Fcalculated from the data is larger than the Fα, then you are in the Rejection region and you can reject the Null Hypothesis with (1-α) level of confidence.

Note that modern statistical software condenses step 6 and 7 by providing a p-value. The p-value here is the probability of getting an Fcalculated even greater than what you observe. If by chance, the Fcalculated = [Math Processing Error], then the p-value would exactly equal to α. With larger Fcalculated values, we move further into the rejection region and the p-value becomes less than α. So the decision rule is as follows:

If the p-value obtained from the ANOVA is less than α, then Reject H0 and Accept HA.

Sampling errors

A Sampling error is a statistical error that occurs when an analyst does not select a sample that represents the entire population of data and the results found in the sample do not represent the results that would be obtained from the entire population. Sampling is an analysis performed by selecting a number of observations from a larger population, and the selection can produce both sampling errors and non-sampling errors.

Sampling error can be eliminated when the sample size is increased and also by ensuring that the sample adequately represents the entire population. Assume, for example, that XYZ Company provides a subscription-based service that allows consumers to pay a monthly fee to stream videos and other programming over the web. The firm wants to survey homeowners who watch at least 10 hours of programming over the web each week and pay for an existing video streaming service. XYZ wants to determine what percentage of the population is interested in a lower-priced subscription service. If XYZ does not think carefully about the sampling process, several types of sampling errors may occur.

Examples of Sampling Error

A population specification error means that XYZ does not understand the specific types of consumers who should be included in the sample. If, for example, XYZ creates a population of people between the ages of 15 and 25 years old, many of those consumers do not make the purchasing decision about a video streaming service because they do not work full-time. On the other hand, if XYZ put together a sample of working adults who make purchase decisions, the consumers in this group may not watch 10 hours of video programming each week.

Selection error also causes distortions in the results of a sample, and a common example is a survey that only relies on a small portion of people who immediately respond. If XYZ makes an effort to follow up with consumers who don’t initially respond, the results of the survey may change. Furthermore, if XYZ excludes consumers who don’t respond right away, the sample results may not reflect the preferences of the entire population.

Sample Size and Sampling Error

Given two exactly the same studies, same sampling methods, same population, the study with a larger sample size will have less sampling process error compared to the study with smaller sample size. Keep in mind that as the sample size increases, it approaches the size of the entire population, therefore, it also approaches all the characteristics of the population, thus, decreasing sampling process error.

Non-Sampling Errors

A non-sampling error is an error that results during data collection, causing the data to differ from the true values. Non-sampling error differs from sampling error. A sampling error is limited to any differences between sample values and universe values that arise because the entire universe was not sampled. Sampling error can result even when no mistakes of any kind are made. The “errors” result from the mere fact that data in a sample is unlikely to perfectly match data in the universe from which the sample is taken. This “error” can be minimized by increasing the sample size. Non-sampling errors cover all other discrepancies, including those that arise from a poor sampling technique.

Non-sampling errors may be present in both samples and censuses in which an entire population is surveyed and may be random or systematic. Random errors are believed to offset each other and therefore are of little concern. Systematic errors, on the other hand, affect the entire sample and are therefore present a greater issue. Non-sampling errors can include but are not limited to, data entry errors, biased survey questions, biased processing/decision making, non-responses, inappropriate analysis conclusions and false information provided by respondents.

While increasing sample size will help minimize sampling error, it will not have any effect on reducing non-sampling error. Unfortunately, non-sampling errors are often difficult to detect, and it is virtually impossible to eliminate them entirely.

Methods to Reduce Sampling Error

Of the two types of errors, sampling error is easier to identify. The biggest techniques for reducing sampling error are:

(i) Increase the sample size.

A larger sample size leads to a more precise result because the study gets closer to the actual population size.

(ii) Divide the population into groups.

Instead of a random sample, test groups according to their size in the population. For example, if people of a certain demographic make up 35% of the population, make sure 35% of the study is made up of this variable.

(iii) Know your population.

The error of population specification is when a research team selects an inappropriate population to obtain data. Know who buys your product, uses it, works with you, and so forth. With basic socio-economic information, it is possible to reach a consistent sample of the population. In cases like marketing research, studies often relate to one specific population like Facebook users, Baby Boomers, or even homeowners.

Methods to Non- Reduce Sampling Error

(i) Thoroughly Pretest your Survey Mediums

As discussed in the example above, it is very important to ensure that your survey and its invites run smoothly through any medium or on any device your potential respondents might use. People are much more likely to ignore survey requests if loading times are long, questions do not fit properly on their screens, or they have to work to make the survey compatible with their device. The best advice is to acknowledge your sample`s different forms of communication software and devices and pre-test your surveys and invites on each, ensuring your survey runs smoothly for all your respondents.

(ii) Avoid Rushed or Short Data Collection Periods

One of the worst things a researcher can do is limit their data collection time in order to comply with a strict deadline. Your study’s level of nonresponse bias will climb dramatically if you are not flexible with the time frames respondents have to answer your survey. Fortunately, flexibility is one of the main advantages to online surveys since they do not require interviews (phone or in person) that must be completed at certain times of the day. However, keeping your survey live for only a few days can still severely limit a potential respondent’s ability to answer. Instead, it is recommended to extend a survey collection period to at least two weeks so that participants can choose any day of the week to respond according to their own busy schedule.

(iii) Send Reminders to Potential Respondents

Sending a few reminder emails throughout your data collection period has been shown to effectively gather more completed responses. It is best to send your first reminder email midway through the collection period and the second near the end of the collection period. Make sure you do not harass the people on your email list who have already completed your survey! You can manage your reminders and invites on FluidSurveys through the trigger options found in the invite tool.

(iv) Ensure Confidentiality

Any survey that requires information that is personal in nature should include reassurance to respondents that the data collected will be kept completely confidential. This is especially the case in surveys that are focused on sensitive issues. Make certain someone reading your invite understands that the information they provide will be viewed as part the whole sample and not individually scrutinized.

(v)  Use Incentives

Many people refuse to respond to surveys because they feel they do not have the time to spend answering questions. An incentive is usually necessary to motivate people into taking part in your study. Depending on the length of the survey, the difficulty in finding the correct respondents (ie: one-legged, 15th-century spoon collectors), and the information being asked, the incentive can range from minimal to substantial in value. Remember, most respondents won’t have an invested interest in your study and must feel that the survey is worth their time!

error: Content is protected !!