Process Theories

A process theory is a system of ideas that explains how an entity changes and develops. Process theories are often contrasted with variance theories, that is, systems of ideas that explain the variance in a dependent variable based on one or more independent variables. While process theories focus on how something happens, variance theories focus on why something happens. Examples of process theories include evolution by natural selection, continental drift and the nitrogen cycle.

How Process Theory Works in Measuring Work Motivation?

Using process theory, a type of scientific observation, individuals measure how events in a specific process lead to an outcome. According to this theory, when a company wants to reproduce an outcome, the company must duplicate the process used to derive this objective. When it comes to motivation, process theory provides a means to explain how the needs of workers change.

Equity Theory

Equity Theory within Process Theory measures work motivation by the amount of skills an employee possesses and the efforts of the employer. When an employee feels that she and her employer have made equal investments in each other, she is more likely to feel motivated. Investments on an employer’s behalf can include worker benefits, salaries and promotions. The Equity Theory measures an employee’s perception of workplace fairness and inequalities and looks at how each factor can cause an employee to adjust her behavior. When an employee feels a work situation is unfair, she may reduce her productivity level, feel she is entitled to a high compensation or look for work elsewhere.

Expectancy Theory

Using the Expectancy Theory within Process Theory helps explain how particular efforts link to the desires for specific outcomes as they monitor the success of an outcome. The Expectancy Theory uses the assumption that employers try to predict outcomes and create perceived expectations about future events that are realistic. Therefore, if an outcome looks feasible and an employee knows how to achieve it, he will feel motivated to use the information known to make the predicted outcomes become a reality. Three variables within the Expectancy Theory can affect Process Theory and worker motivation — valence, instrumentality and expectancy. Valence focuses on the outcome or reward an employee anticipates. Instrumentality is an employee’s belief that repeating specific actions will help him achieve the result desired. Expectancy refers to an employee’s belief in his own capabilities. Therefore, an employee finds job satisfaction and motivations from his job performance.

Theory of Goal Setting

Setting goals can help motivate an employee because it makes her feel needed. This feeling can translate in goal-driven behaviors that continue until the employee no longer feels needed. The type of goal can dictate an employee’s level of motivation when she faces more than one objective. Similarly, an employee will increase her level of participation in setting a goal if she feels the process includes fairness and autonomy.

Variance Theory

Variance Theory within the Process Theory compares an employee’s motivation to his behaviors and needs. An employee feels more motivated when he believes that the rewards of achieving a goal will materialize, will meet his needs and will match the energy he put into accomplishing tasks.

Vroom’s Expectancy Theory of Motivation

Victor Vroom, a Canadian psychologist, developed the Expectancy Theory of Motivation in the 1960s. This theory offers insights into how individuals make decisions regarding their behavior in the workplace based on their expectations of outcomes. Vroom’s theory suggests that people are motivated to act in certain ways if they believe that their efforts will lead to desired outcomes.

Key Concepts:

  • Expectancy:

Expectancy refers to an individual’s belief about the likelihood or probability that their efforts will lead to successful performance. It reflects the perceived relationship between effort and performance and is influenced by factors such as skills, abilities, resources, and task difficulty. High expectancy indicates a strong belief that effort will result in successful performance, while low expectancy suggests doubt or uncertainty about the connection between effort and performance.

  • Instrumentality:

Instrumentality refers to an individual’s belief about the likelihood or probability that successful performance will lead to desired outcomes or rewards. It reflects the perceived relationship between performance and outcomes and is influenced by factors such as organizational policies, procedures, and past experiences. High instrumentality indicates a strong belief that successful performance will result in desired outcomes, while low instrumentality suggests skepticism or doubt about the connection between performance and outcomes.

  • Valence:

Valence refers to the value or attractiveness that an individual places on desired outcomes or rewards. It reflects the subjective importance or significance of outcomes and is influenced by individual preferences, needs, and goals. High valence indicates a strong preference for desired outcomes, while low valence suggests indifference or lack of interest in the outcomes.

Expectancy Theory Equation:

Vroom’s Expectancy Theory can be expressed mathematically using the following equation:

π‘€π‘œπ‘‘π‘–π‘£π‘Žπ‘‘π‘–π‘œπ‘› = 𝐸π‘₯π‘π‘’π‘π‘‘π‘Žπ‘›π‘π‘¦ Γ— πΌπ‘›π‘ π‘‘π‘Ÿπ‘’π‘šπ‘’π‘›π‘‘π‘Žπ‘™π‘–π‘‘π‘¦ Γ— π‘‰π‘Žπ‘™π‘’π‘›π‘π‘’

According to this equation, an individual’s motivation to perform a particular behavior or engage in a specific task depends on three factors: expectancy, instrumentality, and valence. These factors interact multiplicatively to determine the strength and direction of motivation.

Application of Expectancy Theory:

  • Performance Management:

Expectancy Theory can be applied to performance management practices such as goal-setting, feedback, and rewards. By setting challenging yet achievable goals, providing clear performance expectations, and offering feedback on progress and achievements, organizations can enhance employees’ expectancy beliefs and motivation to perform.

  • Reward Systems:

Organizations can use expectancy theory to design and implement reward systems that reinforce desired behaviors and outcomes. By ensuring that rewards are linked to performance and perceived as fair, equitable, and meaningful by employees, organizations can enhance instrumentality and valence, thereby increasing motivation and engagement.

  • Training and Development:

Expectancy Theory can inform training and development initiatives by emphasizing the importance of providing employees with the necessary skills, resources, and support to succeed. By enhancing employees’ expectancy beliefs through training and development programs, organizations can increase motivation, confidence, and performance.

  • Job Design:

Job design practices such as job enrichment, job rotation, and job crafting can be informed by expectancy theory principles. By providing employees with opportunities for autonomy, skill variety, task significance, and feedback, organizations can enhance expectancy beliefs and motivation to perform challenging and meaningful work.

Criticisms and Limitations:

  • Complexity:

Vroom’s Expectancy Theory is based on a rational decision-making model that assumes individuals are rational, logical, and able to accurately assess the probabilities of outcomes. However, in reality, decision-making processes are often influenced by cognitive biases, emotions, and social factors that may not align with the assumptions of the theory.

  • Limited Predictive Power:

While expectancy theory provides valuable insights into the cognitive processes underlying motivation, its predictive power may be limited in complex organizational settings where multiple factors influence behavior. Factors such as organizational culture, leadership style, and social dynamics may interact with expectancy, instrumentality, and valence to shape employees’ motivation and behavior.

  • Individual Differences:

Expectancy theory assumes that individuals have similar beliefs, preferences, and goals regarding outcomes. However, individuals vary in their motivational needs, personality traits, and situational contexts, which may influence their expectancy, instrumentality, and valence perceptions.

Valency Four Drive Model

The Four Drive model presents human aspirations as a set of fundamental needs. The theory was introduced in the 2002 book titled Driven. These dynamic needs were acquired over time from human evolutionary past and became a part of the mental stock meant to serve as an advantage in the epochs to come.

The derived drives are elemental and cannot be broken down into smaller elements, yet provide a comprehensive understanding of what is behind human motivation. These complete drives are: acquire, bond, learn, and defend. Each of them is characterized by features influencing communication with other humans, in the workplace included.

Acquire

Acquire is the drive to gain material possessions, achieve a position, or be awarded a status. On one side, it can lead to increased performance, but on the other, lead to detrimental competition. The drive to acquire combines both basic and complex wants varying from essentials for survival to accomplishments and power. Understanding this drive and providing necessary conditions to fulfill the β€œacquisition” by means of job performance should be at the core of creating any satisfying job. To balance out unhealthy competition you can use another drive the drive to bond.

It is completely fine to evaluate the perception of the workplace environment based on these Four Drives. If that is your intention, you will find the four fundamental drives job satisfaction survey below. The content of the survey is meant to point managers to the potential areas of interest and help formulate the right questions to get more accurate results.

The Drive to Acquire and Achieve

  • Does your organization offer monetary rewards for exceptional performance?
  • Is your salary competitive?
  • Are your performance evaluation criteria defined clearly?
  • Does your organization clearly define the need for high performance?
  • Is your performance getting the recognition it deserves?
  • How happy are you with the payment for your work?

Bond

The drive to bond determines the need to find and engage in mutual relationships with others. Extensive research has revealed that we are inclined to bond with other individuals similar in worldview and demographics. People who have a neck for establishing relationships soon can grow to include groups in the workplace. Bonds are, generally, healthy and result in workers supporting each other. The drive to bond is aimed towards other people, while the drive to learn is more personal, directed at work activities for the most part.

The Drive to Bond

  • Does your organization encourage employees to support each other?
  • How does your organization recognize teamwork efforts or collaborations?
  • Does your company encourage best practices and knowledge sharing?
  • Is friendship among employees supported by your organization?
  • Do you see yourself as an indispensable part of the team?
  • Would you define your management as people-oriented?
  • Would you agree with the statement that your management cares for you on a personal level?

Learn

Workplace environments that encourage curiosity and provide means for exploration to improve understanding are perfect for satisfying the drive to learn. This particular drive is also behind the urge to understand one’s role in the organization and what that role is meant to contribute to the greater goal. The satisfaction workers get from taking up challenges at the workplace is a perfect representation of the drive to learn effect. It also works wonders coupled with the drive to bond. The effects of the first three drives we have gone over are all desirable in the workplace. However, the last one β€” the drive to defend β€” you would not want triggered in the work environment.

The Drive to Learn and Comprehend

  • Does your job give you the opportunity to do work that interests you?
  • Is there an opportunity to learn new things at your job?
  • Do you think the work that you do accomplishes something meaningful for your organization?
  • Would you consider your assignments to be challenging?
  • Is there a variety of the assignments you are getting at work?
  • Is personal development and growth supported at your organization?
  • Are you acquiring new skills or knowledge at work?

Defend

Contrary to the active drives to acquire, bond, and learn which people seek to fulfill, the drive to defend is subtle and becomes active only when triggered by a threat. The stimulation to defend can be a result of a threat to the organization, the group, or the individual. In this scenario, it is best for the organization to work out an environment that minimizes or eliminates the source of these threats. With misguided and unintentional triggers handled, the drive to defend allows workers to effectively respond to genuine threats.

The Four Drive model presents human aspiration to acquire, bond, learn, and defend as elemental psychologically engraved needs, either of the drives can be expressed at a different level compared to others. The influence of any given drives varies over time too. A consistent predominant manifestation of one of the drive can be detrimental for organizational as well as personal outcomes. Once a person gets captivated by, for instance, the drive to acquire it can lead to unhealthy competition and greed. The absorption with the drive to defends leads to a person becoming socially distanced or even paranoid. The key aspect of the theory revolves around balancing out all four drives and using them to regulate one another. The same objective should be pursued when structuring a job position and creating a workplace environment.

The Drive to Defend

  • Does your organization have a transparent performance rating system?
  • Do you work in a non-intimidating and welcoming environment?
  • Is your organization’s performance rating system fair?
  • Does your manager play favorites or everyone is treated fairly?
  • Do you personally trust organization’s approach to performance rating?
  • Does everyone, including yourself, have the right to speak up at your organization?

Synergy as a Component of Strategy and its Relevance

In business, people may choose either to work together as a team or work separately to attain goals. Synergy occurs when a company chooses to utilize teams to increase performance, drive strategic growth and reach common goals. Companies may use a synergistic approach to enhance communications, promote knowledge sharing, streamline processes and bridge the generation gap.

Enhance Communications

Synergy extends communications across departments, and teamwork is encouraged to reach strategic goals. For example, the sales department and IT department work together and share skill sets to create a new customer service portal and increase market share. A company that promotes synergy could use technology, such as tablet computers and video conferencing, to provide mobility, ease of access and real-time discussions. This may help employees improve communication skills and deliver exemplary customer service.

Promote Knowledge Sharing

Knowledge sharing permits feedback from co-workers and collaboration between internal and external stakeholders. Synergy may involve the of use customer relationship management products such as Salesforce.com and social networking sites such as Facebook, Twitter and LinkedIn to facilitate the exchange of ideas and to solidify relationships. When individuals work together in a synergistic fashion, expectations, rules and best practices are apparent. This environment fosters learning and growth and spurs innovation, which is advantageous to a company’s competitive standing and strategic value.

Streamline Processes

Collaboration and knowledge sharing across the organization can lead to business process improvement by eliminating redundancy, reducing cycle times and increasing efficiency. If, for example, a marketing department and sales department enter customer account information on separate computer systems, streamlining the process will prevent duplication of efforts and free up resources. This poses opportunities for process automation and a reduction of labor costs, which can positively affect a company’s bottom line.

Efficient Performance

Eliminating structural redundancy also can increase synergy by identifying ways to streamline operations, allowing each department to focus on being maximally efficient within its own role. For instance, forcing several departments to deal with customers in addition to their production responsibilities is less efficient than creating a single, dedicated department for handling customer service. With the creation of the new customer service department, the other departments can hand off difficult client issues to the experts.

Bridge the Generation Gap

A synergistic environment helps bridge the gaps among multiple generations, such as millennials, Generation X and baby boomers. Without it, each group might adapt, communicate and work in different ways. This could negatively affect a company’s productivity and the way it functions as a whole. For example, according to a study published by Ernst & Young, 78 percent of respondents perceive millennials as the most technically capable, but only 45 percent of respondents agree that the same generation works well in teams. A synergistic approach would pair the group with another generation that has strong team skills and poor technical skills, and facilitate team-building exercises and social media activities to encourage members to learn from each other.

Alliances

You also can create synergistic alliances with other businesses that have resources or strategies that sync well with yours. A chocolate maker, for example, might supply its products at a steeply discounted rate to a local bakery, which in turn will promote the chocolate supplier to its patrons. Both businesses benefit from the synergistic connection in ways that neither could alone.

Evaluation of Synergy

When a company acquires another business, it is often justified by the argument that the investment will create synergies. The primary source of synergy in an acquisition is in the presumption that the target firm controls a specialized resource that becomes more valuable if combined with the acquiring firm’s resources. There are two main types, operating synergy and financial synergy, and this guide will focus on the latter.

Value can be created, for example, through revenue enhancement, cost reductions, increased operating cash flow, improved managerial decision making, or the sale of redundant assets. However, the value created from proposed synergies also may have an additional investment cost as well.

Synergy takes the form of revenue enhancement and cost savings.

When two companies in the same industry merge, such as two banks, combined revenues tend to decline to the extent that the businesses overlap in the same market and some customers become alienated.

For the merger to benefit shareholders, there should be cost-saving opportunities to offset the revenue decline. In other terms, the synergies deriving from the merger must exceed the initially lost value.

As a rule of thumb, synergy is a business combination where 2+2 = 5.

Many analysts, however, do not consider these incremental investments or β€œhidden” costs when performing a pricing analysis or valuation of a potential target. Failure to consider the hidden costs often causes the overvaluation of a potential target, which may lead to destroying value rather than creating it.

Synergy appeared due to acquisition should include higher results then it was originally expected.

Acquisition process should be well-planned. Mark Sirower, the US leader of the Merger & Acquisition Strategy and Commercial Diligence practice, named 4 components which should take place in order to achieve successful synergies:

  • Strategic vision
  • Operating strategy
  • Systems integration
  • Power and culture

The buyer should pay out the premium to shareholders of merged company. The higher the premium, the lower the potential benefit for the buyer. Therefore, synergies should not be intangible. It should be carefully forecast and discounted from net cash flows which are feasible within the chosen time frame.

Post-merger integration issues, as well as competitors’ reactions, can contribute to the hidden costs of an acquisition.

Besides the positive impact of revenue enhancements, cost reductions, and other efficiencies, valuation analysts need to price them in, too.

Synergy: Meaning, Concept and Types

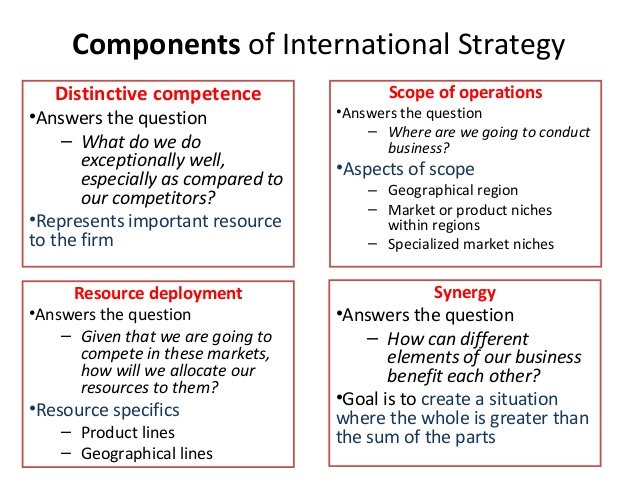
Synergy is the concept that the combined value and performance of two companies will be greater than the sum of the separate individual parts. Synergy is a term that is most commonly used in the context of mergers and acquisitions (M&A). Synergy, or the potential financial benefit achieved through the combining of companies, is often a driving force behind a merger.

Synergy is the concept that the whole of an entity is worth more than the sum of the parts. This logic is typically a driving force behind mergers and acquisitions (M&A), where investment bankers and corporate executives often use synergy as a rationale for the deal. In other words, by combining two companies in a merger, the new company’s value will be greater than the sum of the values of each of the two companies being merged.

Concept of Synergy

Mergers and acquisitions (M&A) are made with the goal of improving the company’s financial performance for the shareholders. Two businesses can merge to form one company that is capable of producing more revenue than either could have been able to independently, or to create one company that is able to eliminate or streamline redundant processes, resulting in significant cost reduction. Because of this principle, the potential synergy is examined during the M&A process. If two companies can merge to create greater efficiency or scale, the result is what is sometimes referred to as a synergy merge.

Shareholders will benefit if a company’s post-merger share price increases due to the synergistic effect of the deal. The expected synergy achieved through the merger can be attributed to various factors, such as increased revenues, combined talent, and technology, or cost reduction.

For example, when Proctor & Gamble Company acquired Gillette in 2005, a P&G news release cited that “the increases to the company’s growth objectives are driven by the identified synergy opportunities from the P&G/Gillette combination. The company continues to expect cost synergies of approximately $1 to $1.2 billion…and an increase in the annual sales run-rate of about $750 million by 2008.” In the same press release, then P&G chairman, president, and chief executive A.G. Lafley stated, “…We are both industry leaders on our own, and we will be even stronger and even better together.” This is the idea behind synergyβ€”that by combining two companies the financial results are greater than what either could have achieved alone.

In addition to merging with another company, a company may also attempt to create synergy by combining products or markets. For example, a retail business that sells clothes may decide to cross-sell products by offering accessories, such as jewelry or belts, to increase revenue.

A company can also achieve synergy by setting up cross-disciplinary workgroups, in which each member of the team brings with him or her a unique skill set or experience. For example, a product development team may consist of marketers, analysts, and R&D experts. This team formation could result in increased capacity and workflow and, ultimately, a better product than all the team members could produce if they work separately.

Β Synergy can also be negative. Negative synergy is derived when the value of the combined entities is less than the value of each entity if it operated alone. This could result if the merged firms experience problems caused by vastly different leadership styles and company cultures.

Synergy is reflected on a company’s balance sheet through its goodwill account. Goodwill is an intangible asset that represents the portion of the business value that cannot be attributed to other business assets. Synergies may not necessarily have a monetary value but could reduce the costs of sales and increase profit margin or future growth. In order for synergy to have an effect on the value, it must produce higher cash flows from existing assets, higher expected growth rates, longer growth periods, or lower cost of capital.

Types of Synergy

  1. Operating Synergy

When the combined value of two firms is greater than the sum of the separate firms apart and, when the combined firm allows for the firms to increase their operating income and achieve higher growth it is termed as β€˜β€™Operating synergy’.’ Operating synergies arise from the following:

Economies of scale, greater pricing power and higher margins resulting from greater market share and lower competition, combination of different functional strengths such as marketing skills and good product line, or higher levels of growth from new and expanded markets.

Operating synergies are achieved through merger, acquisition or takeovers of firms which have competencies in different areas such as production, research and development or marketing and finance can also help achieve operating efficiencies. Tata Steel which is one of the biggest Indian steel companies; it took over Corus which was Europe’s second largest steel company in 2007. Tata Steel’s takeover of the European steel major Corus for the price of $12.02 billion made the Indian company, the world’s fifth-largest steel producer. The acquisition was intended to give Tata steel access to the European markets and to achieve potential synergies in the areas of manufacturing, procurement, R&D, logistics, and back office operations.

  1. Financial Synergy

Financial synergies are most often appraised in the context of mergers and acquisitions, but latest strategic alliances include strategic partnerships. These types of synergies relate to improvement in the financial metric of a combined business such as revenue, debt capacity, cost of capital, profitability, etc. Examples of positive financial synergies include: Increased revenues through a larger customer base, lower costs through streamlined operations, talent and technology harmonies.

In addition to above, financial synergies can result in the following benefits post acquisition: Increased debt capacity, greater cash flows, lower cost of capital, tax benefits etc. The Renault-Nissan (Franco – Japanese) strategic partnership or car making alliance expects to generate 5.5 billion euros ($6 billion) of synergies in 2018 by integrating more divisions and sharing resources better within the partnership. Increased union between the French carmaker and its 43.4 percent-owned Japanese partner generated more than 4 billion euros in synergies in 2015.

The two companies go together to benefit from cost cutting.Β  As of December 2016, the Alliance is the world’s leading plug-in-electric vehicle manufacturer, with global sales since 2010 of almost 425,000 pure electric vehicles, including those manufactured by Mitsubishi Motors which is also now part of the Alliance. The strategic alliance partnership between Renault and Nissan is not a merger or an acquisition. The two companies are joined together through a cross-sharing agreement. The structure was unique in the auto industry during the 1990s consolidation trend and later served as a model for General Motors and PSA Peugeot Citroen.

  1. Marketing synergy

Marketing synergy implies that the marketing-mix makes for overall effectiveness. For example, by grabbing an opportunity which makes it possible to gain increased utilization of existing marketing and distribution facilities, it may be possible to enhance sales revenues without causing a proportionate increase in costs. Hero Honda Ltd was a joint venture between Hero Cycles of India and Honda Motor of Japan. Hero Cycle’s long experience about Indian road conditions including Indian rural and urban customers was wholly combined with Honda Motor’s superior technological capability to create the expectedΒ  synergy effect for producing a highly fuel efficient and sturdy motor cycle to suit the exact requirements of the Indian customers and meet the rough road conditions as early as 1985. The partnership lasted for 26 years.

Models of Strategy Making

Modes of strategic management are the actual kinds of approaches taken by managers in formulating and implementing strategies. They address the issues of who has the major influence in the strategic management process and how the process is carried out. Research indicates that managers tend to use one of three major approaches to, or modes of strategic management: entrepreneurial, adaptive, and planning. The mode selected is likely to influence the degree of innovation that occurs within the organization. Innovation is particularly important in the context of strategic management, because organizations that do not continually incorporate new ideas are likely to fail behind competitively, particularly when the environment is changing rapidly.

  1. Entrepreneurial Mode

β€œEntrepreneurial mode is an approach in which strategy is formulated mainly by a strong visionary chief executive who actively searches for new opportunities, is heavily oriented toward growth, and is willing to make bold strategies rapidly”. The entrepreneurial searches for new mode are most likely to be found in organizations that are young or small, have a strong leader, or are in such serious trouble that bold are their only hope. Not surprisingly, in the entrepreneurial mode, the extent to which the strategic management process encourages innovation depends largely on the orientation of top leaders. Their personalities, power, and information enable them to overcome obstacles and push for change. Conversely, strong leaders also are in a position to threat innovative activities, should they be so inclined.

  1. Adaptive Mode

β€œAdaptive mode is an approach to strategy formulation that emphasizes taking small incremental steps, reacting to problems rather than seeking opportunities, and attempting to satisfy a number of organizational power groups”. The adaptive mode is most likely to be used by managers in established organizations that face a rapidly changing environment and yet have several coalitions, or power blocks, that make it difficult to obtain agreement on clear strategic goals and associated long-term plans. For example, before London-based Grand Metropolitan PLC purchased Pillsbury, including the Burger King Chain, the chain was plagued by constant turnover, marketing problems, inconsistent service, and angry franchisees who frequently told Pillsbury what to do.Β  Grand Metropolitan is now working to put the chain back on track through a strategy that emphasizes, doing β€œwhatever it takes to create a positive, memorable experience.” Concrete measures include increasing the number of field representatives who visit Burger King stores, highlighting cleanliness, and rewarding employees who take the initiative in improving service by doing things differently.

With the adaptive approach, the degree of innovation fostered by the strategic management process is likely to depend on the ability of managers to agree on at least some major goals and basic strategies that set essential directions. In addition, lower-level managers must have some flexibility in carrying out the basic strategy rather than being given extremely detailed plans to follow; this approach might be effective in a more stable environment or one in which agreement among coalitions is easy to obtain. Without at least some agreement among high-level managers on major goals and directions, however the adaptive mode may be ineffective in moving the organization in viable strategic directions.

  1. Planning Mode

Planning mode is an approach to strategy formulation that involves systematic, comprehensive analysis, along with integration of various decisions and strategies”. Martin. With the planning mode, executives often utilize planning specialists to help with the strategic management process. The ultimate aim of the planning mode is to understand the environment well enough to influence it. The planning mode is most likely to be used in large organizations that have enough resources to conduct comprehensive analysis, have an internal situation in which agreement is possible on major goals, and face an environment that has enough stability to enable the formulation and implementation of carefully conceived strategies. For example, Disney’s plans include entry into the convention hotel business with its Dolphin Hotel, operated by the Sheraton Corporation, and Swan Hotel, run by the Westin Hotel Company. Combined, the two hotels offer 2350 rooms and more than 200,000 square feet of convention space inside Disney World. The hotels were heavily booked well in advance of their opening in 1990.

With the planning mode, innovation is most likely to occur when strategies explicitly articulate needs for product and service innovation and when top-level managers, such as those at Disney, help integrate efforts in the direction of encouraging innovation.

Assessing the Strategic Management Modes

Each mode can be relatively successful as long as it is matched to an appropriate situation. In fact, it may be possible to use different modes within the same organization. For example, a top-level manager may adopt an entrepreneurial mode for a new business that is just starting and use the planning mode for strategic management of the rest of the organization.

Each of these modes of strategic management can either promote organizational innovation or stifle it, depending on how the mode is used. Still, operating effectively in any of the three modes requires knowledge of the strategic management process. In carrying out the process, once the mission and strategic goals are determined, managers engage in competitive analysis.

Strategic Analysis & Choice & Implementation

Strategy analysis and choice focuses on generating and evaluating alternative strategies, as well as on selecting strategies to pursue. Strategy analysis and choice seeks to determine alternative courses of action that could best enable the firm to achieve its mission and objectives.

The firm’s present strategies, objectives, and mission together with the external and internal audit information, provide a basis for generating and evaluating feasible alternative strategies. The alternative strategies represent incremental steps that move the firm from its current position to a desired future state.

Alternative strategies are derived from the firm’s vision, mission, objectives, external audit, and internal audit and are consistent with past strategies that have worked well. The strategic analysis discusses the analytical techniques in two stages i.e. techniques applicable at corporate level and then techniques used for business-level strategies.

The techniques that have been discussed for the corporate level include BCG matrix, GE nine-cell planning grid, Hofer’s matrix and Shell Directional Policy Matrix and the techniques for business- level include SWOT analysis, experience curve analysis, grand strategy selection matrix, grand strategy clusters.

The judgmental factors constitute the other aspect on the basis of which strategic choice is made.

As environment changes, companies need to change their strategies to adapt to the environment not only to prosper but also to survive. Based on the multiple strategic choices, each choice is analyze and the best one is selected and implemented.

Strategic analysis and choice are two important components of the implementation stage of the strategic management plan. These two components are crucial links in the strategic management implementation procedure.

Strategic analysis is all about analyzing the strength of businesses’ position and understanding the important external factors that may influence that position. Factors Taken into Consideration for Strategic Analysis and Choice

Key Internal Factors

  • Marketing
  • Management
  • Operations/Production
  • Accounting/Finance
  • Computer Information Systems
  • Research and Development

Key External Factors

  • Political/Governmental/Legal
  • Economy
  • Technological
  • Social/Demographic/Cultural/Environmental
  • Competitive

Techniques Used in Strategic Analysis

The following devices or techniques are used in the procedure of strategic analysis:

  • Five Forces Analysis
  • PEST Analysis (Political, Economic, Social and Technological Analysis)
  • Market segmentation
  • Scenario planning
  • Competitor analysis
  • Directional policy matrix
  • SWOT Analysis (Strength, Weaknesses, Opportunities, and Threats Analysis)
  • Critical Success Factor Analysis

Strategic choice

Strategic choice involves understanding the nature of stakeholders expectations, identifying the strategic option and evaluating and selecting the best/optimal choice amongst all.

Strategic implementation

Strategic implementation is the penultimate stage of strategic management and strategic analysis and choice are two significant constituents of that process.

Characteristics of Strategic Analysis and Choice

Following are the features of strategic analysis and choice:

  • Establishment of long term goals
  • Producing strategy options
  • Choosing strategies to act on
  • Selecting the best option and accomplishing mission and goal

At the time of performing strategic analysis and arriving at strategic choices, long term goals are fixed and different types of strategies are chosen that are most appropriate for the mission of the company and the variable conditions.

Strategic analysis and choice of strategies are done with the help of a number of techniques. If the appropriate strategy is chosen, a company would become more efficient to establish sustainability in competitive advantage and maximize firm valuation.

BCG Matrix

Boston Consulting Group (BCG) Matrix is a four celled matrix (a 2 * 2 matrix) developed by BCG, USA. It is the most renowned corporate portfolio analysis tool. It provides a graphic representation for an organization to examine different businesses in it’s portfolio on the basis of their related market share and industry growth rates. It is a two dimensional analysis on management of SBU’s (Strategic Business Units). In other words, it is a comparative analysis of business potential and the evaluation of environment.

According to this matrix, business could be classified as high or low according to their industry growth rate and relative market share.

Relative Market Share = SBU Sales this year leading competitors sales this year.

Market Growth Rate = Industry sales this year – Industry Sales last year.

The analysis requires that both measures be calculated for each SBU. The dimension of business strength, relative market share, will measure comparative advantage indicated by market dominance. The key theory underlying this is existence of an experience curve and that market share is achieved due to overall cost leadership.

BCG matrix has four cells, with the horizontal axis representing relative market share and the vertical axis denoting market growth rate. The mid-point of relative market share is set at 1.0. if all the SBU’s are in same industry, the average growth rate of the industry is used. While, if all the SBU’s are located in different industries, then the mid-point is set at the growth rate for the economy.

Resources are allocated to the business units according to their situation on the grid. The four cells of this matrix have been called as stars, cash cows, question marks and dogs. Each of these cells represents a particular type of business.

  1. Stars

Stars represent business units having large market share in a fast growing industry. They may generate cash but because of fast growing market, stars require huge investments to maintain their lead. Net cash flow is usually modest. SBU’s located in this cell are attractive as they are located in a robust industry and these business units are highly competitive in the industry. If successful, a star will become a cash cow when the industry matures.

  1. Cash Cows

Cash Cows represents business units having a large market share in a mature, slow growing industry. Cash cows require little investment and generate cash that can be utilized for investment in other business units. These SBU’s are the corporation’s key source of cash, and are specifically the core business. They are the base of an organization. These businesses usually follow stability strategies. When cash cows loose their appeal and move towards deterioration, then a retrenchment policy may be pursued.

  1. Question Marks

Question marks represent business units having low relative market share and located in a high growth industry. They require huge amount of cash to maintain or gain market share. They require attention to determine if the venture can be viable. Question marks are generally new goods and services which have a good commercial prospective. There is no specific strategy which can be adopted. If the firm thinks it has dominant market share, then it can adopt expansion strategy, else retrenchment strategy can be adopted. Most businesses start as question marks as the company tries to enter a high growth market in which there is already a market-share. If ignored, then question marks may become dogs, while if huge investment is made, then they have potential of becoming stars.

  1. Dogs

Dogs represent businesses having weak market shares in low-growth markets. They neither generate cash nor require huge amount of cash. Due to low market share, these business units face cost disadvantages. Generally retrenchment strategies are adopted because these firms can gain market share only at the expense of competitor’s/rival firms. These business firms have weak market share because of high costs, poor quality, ineffective marketing, etc. Unless a dog has some other strategic aim, it should be liquidated if there is fewer prospects for it to gain market share. Number of dogs should be avoided and minimized in an organization.

Limitations of BCG Matrix

The BCG Matrix produces a framework for allocating resources among different business units and makes it possible to compare many business units at a glance. But BCG Matrix is not free from limitations, such as-

  • BCG matrix classifies businesses as low and high, but generally businesses can be medium also. Thus, the true nature of business may not be reflected.
  • Market is not clearly defined in this model.
  • High market share does not always leads to high profits. There are high costs also involved with high market share.
  • Growth rate and relative market share are not the only indicators of profitability. This model ignores and overlooks other indicators of profitability.
  • At times, dogs may help other businesses in gaining competitive advantage. They can earn even more than cash cows sometimes.
  • This four-celled approach is considered as to be too simplistic.

GE 9Cell

GE nine cell planning grid, tries to overcome some of the limitations of BCG matrix in two ways:

  1. It uses multiple factors to assess industry attractiveness and business strength in place of the single measure employed in the BCG matrix.
  2. It expanded the matrix from four cells to nine cells. It replaced the high/low axes with high/medium/low making a finer distinction between business portfolio positions.

Each business is appraised in terms of two major dimensions Market Attractiveness and Business Strength. If one of these factors is missing, then the business will not produce desired results. Neither a strong company operating in an unattractive market, nor a weak company operating in an attractive market will do very well

The vertical axis denotes

Industry attractiveness indicates how hard or easy it will be for a company to compete in the market and earn profits. The more profitable the industry is the more attractive it becomes. When evaluating the industry attractiveness, analysts should look how an industry will change in the long run rather than in the near future, because the investments needed for the product usually require long lasting commitment.

  • Long run growth rate
  • Industry size
  • Industry profitability: entry barriers, exit barriers, supplier power, buyer power, threat of substitutes and available complements (use Porter’s Five Forces analysis to determine this)
  • Industry structure (use Structure-Conduct-Performance framework to determine this)
  • Product life cycle changes
  • Changes in demand
  • Trend of prices
  • Macro environment factors (use PEST or PESTEL for this)
  • Seasonality
  • Availability of labor
  • Market segmentation

Horizontal axis represent

Along the X axis, the matrix measures how strong, in terms of competition, a particular business unit is against its rivals. In other words, managers try to determine whether a business unit has a sustainable competitive advantage (or at least temporary competitive advantage) or not.

  • Total market share
  • Market share growth compared to rivals
  • Brand strength (use brand value for this)
  • Profitability of the company
  • Customer loyalty
  • VRIO resources or capabilities (use VRIO framework to determine this)
  • Your business unit strength in meeting industry’s critical success factors (use Competitive Profile Matrix to determine this)
  • Strength of a value chain (use Value Chain Analysis and Benchmarking to determine this)
  • Level of product differentiation
  • Production flexibility

Green zone

Suggests you to β€˜go ahead’, to grow and build, pushing you through expansion strategies. Businesses in the green zone attract major investment.

Yellow zone

Β Cautions you to β€˜wait and see’ indicating hold and maintain type of strategies aimed at stability.

Red zone

Β Indicates that you have to adopt turnover strategies of divestment and liquidation or rebuilding approach.

Advantages of GE 9CELL

  • Helps to prioritize the limited resources in order to achieve the best returns.
  • The performance of products or business units becomes evident.
  • It’s more sophisticated business portfolio framework than the BCG matrix.
  • Determines the strategic steps the company needs to adopt to improve the performance of its business portfolio.

Disadvantage of GE 9CELL

  • Needs a consultant or an expert to determine industry’s attractiveness and business unit strength as accurately as possible.
  • It is expensive to conduct.
  • It doesn’t take into account the harmony that could exist between two or more business units.

The grid then does rating of each of the company’s business units on multiple sets of strategic factor within each axis of the grid.

In order to assess the industry attractiveness factors such as market growth, size of market, industry profitability, competition, seasonality and cyclical qualities, economies of scale, technology, and social/environmental/ legal/human factors are included.

For assessing business strength factors such as market share, profit margin, ability to compete, customer and market knowledge, competitive position, technology, and management caliber are identified.

The strategists then calculate β€œsubjectively” a business’s position within the planning grid by quantifying the two dimensions of the grid.

The strategist first selects industry attractiveness factors to measure industry attractiveness and then assign each industry attractiveness factor a weight that reflects its perceived importance as compared to other attractiveness factors. Favorable to unfavorable future conditions for those factors are forecast and rated based on some scale (0 to 1 scale is illustrative).

Then a weighted composite scope is obtained for a business’s overall industry attractiveness. In order to assess business, a similar procedure is followed in selecting factors, assigning weights to them, and then rating the business on these dimensions.

Thus the GE planning grid might prove to be a useful tool for assessing a business within a corporate portfolio. Usually several managers are involved during the planning process. The inclusion and exclusion of factors and their rating and weighting are primarily matters of managerial judgment. This classifies businesses in terms of both the projected strength of the business and the projected attractiveness of the industry.

The decisions concerning the resource allocation remain quite similar to those in the BCG approach. Business classified as invest to grow would be treated like the stars in the BCG matrix. These businesses would be provided resources to pursue growth-oriented strategies.

Businesses classified in the harvest/divest category would be managed like the dogs in the BCG matrix. Businesses classified, as selectivity/ earnings would either be managed as cash cows or as question marks.

While the strategic recommendations generated by the GE planning grid are similar to those from the BCG matrix, the GE nine-cell grid improves on the BCG matrix in three fundamental ways.

  • The terminology associated with GE grid is preferable because it is less offensive and more universally understood.
  • The multiple measures associated with each dimension of the GE grid include more factors relevant to business strength and market attractiveness than simply market share and market growth.
  • The nine-cell format allows finer distinction between portfolio positions than does the four-cell BCG format.
error: Content is protected !!