Traditional Vs Modern Portfolio Analysis

Traditional Portfolio theory is one of the subjective analysis but it has provided positive results to many some people who have invested keeping in mind the individual securities. Through this traditional theory, investors have been getting the maximum return at the minimum risk.

On the other hand, modern portfolio theory emphasizes on maximizing of return through a combination of securities. It discusses the relationship between different securities and then draws inter-relationships of risks between them.  This theory states that by combining a low risk security with the one with higher risk will ultimately result in a success by investor in making choice of investment.

Traditional portfolio analysis has been of a very subjective nature but it has provided success to some persons who have made their investments by making analysis of individual securities through evaluation of return and risk conditions in each security.

In fact, the investor has been able to get the maximum return at the minimum risk or achieve his return position at that indifferent curve which states his risk condition. The normal method of calculating the return on an individual security was by finding out the amount of dividends that have been given by the company, the price earning ratios, the common holding period and by an estimation of the market value of the shares.

The modern portfolio theory believes in the maximization of return through a combination of securities. The modern portfolio theory discusses the relationship between different securities and then draws inter-relationships of risks between them.

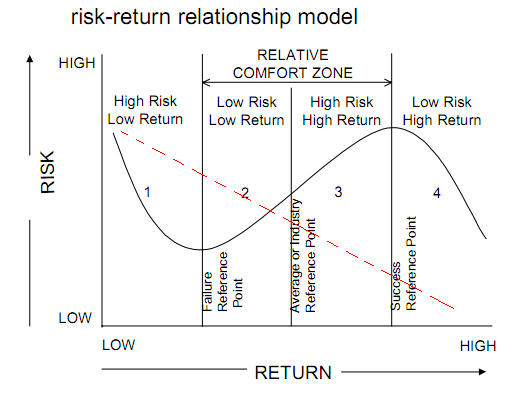
It is not necessary to achieve success, only by trying to get all securities of minimum risk. The theory states that by combining a security of low risk with another security of high risk, success can be achieved by an investor in making a choice of investment outlets.

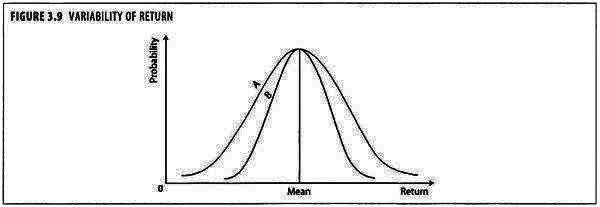
Traditional theory was based on the fact that risk could be measured on each individual security through the process of finding out the standard deviation and that security should be chosen where the deviation was the lowest. Greater variability and higher deviations showed more risk than those securities which had lower variation.

The modern theory is of the view that by diversification risk can be reduced. Diversification can be made by the investor either by having a large number of shares of companies in different regions, in different industries, or those producing different types of product lines.

Diversification is important but the modern theory states that there cannot be only diversification to achieve the maximum return. The securities have to be evaluated and thus diversified to some limited extent within which the maximum achievement can be sought by the investor. The theory of diversification was based on the research work by Harry Markowitz.

Markowitz is of the view that a portfolio should be analysed depending upon:

(a) The attitude of the investor towards risk and return; and

(b) The quantification of risk

Thus, traditional theory and modern theory are both framed under the constraints of risk and return, the former analysing individual securities and the latter believing in the perspective of combination of securities.

Traditional theory believes that the market is inefficient and the fundamental analyst can take advantage of the situation. By analysing internal financial statements of the company, he can make superior profits through higher returns. The technical analyst believed in the market behaviour and past trends to forecast the future of the securities. These analyses were mainly under the risk and return criteria of single security analysis.

Modern portfolio theory, as brought out by Markowitz and Sharpe, is the combination of the securities to get the most efficient portfolio. Combination of securities can be made in many ways. Markowitz developed the theory of diversification through scientific reasoning and method.

Uses of Market Index

Market index refers to a portfolio of securities that represent a particular section of the stock market. The securities that are part of a particular index often come with certain characteristics.

A market index measures the value of a portfolio of holdings with specific market characteristics. Each index has its own methodology which is calculated and maintained by the index provider. Index methodologies will typically be weighted by either price or market cap. A wide variety of investors use market indexes for following the financial markets and managing their investment portfolios. Indexes are deeply entrenched in the investment management business with funds using them as benchmarks for performance comparisons and managers using them as the basis for creating investable index funds.

Uses of Market Indexes

People from many walks of life use and are affected by market indexes. Economists and statisticians use stock-market indexes to study long-term growth patterns in the economy, to analyze and forecast business-cycle patterns, and to relate stock indexes to other time- series measures of economic activity.

Investors, both individual and institutional, use the market index as a benchmark against which to evaluate the performance of their own or institutional portfolios. The answer to the question, “Did you beat the market?” has important ramifications for all types of investors.

Market technicians in many cases base their decisions to buy and sell on the patterns that appear in the time series of the market indexes. The final use of the market index is in portfolio analysis.

In discussions of the market model and systematic it will be evident that the relevant riskiness of a security is determined by the relationship between that security’s return and the return on the market.

Among economists and statisticians one of the major uses of stock-market indexes is to use them as a leading economic indicator. Judging by how long they have been employed, leading indicators of economic activity must be considered in a forecasting success.

Unlike econometric modeling, the leading economic indicator approach to forecasting does not require assumptions about what causes economic behaviour. Instead, it relies on statistically detecting patterns among economic variables that can be used to forecast turning points in economic activity.

Real World Examples

Some of the market’s leading indexes include:

  • S&P 500
  • Dow Jones Industrial Average
  • Nasdaq Composite
  • S&P 100
  • Russell 1000
  • S&P MidCap 400
  • Russell Midcap
  • Russell 2000
  • S&P 600
  • S. Aggregate Bond Market
  • Global Aggregate Bond Market

Methods of computing stock indices

A stock index, or stock market index, is an index that measures a stock market, or a subset of the stock market, that helps investors compare current price levels with past prices to calculate market performance. It is computed from the prices of selected stocks (typically a weighted arithmetic mean).

An index is a statistical measure that represents the value of a batch of stocks. Investors use this measure like a barometer to track the overall progress of the market (or a segment of it).

There are various methods for calculating the stock market index. In this post, we will discuss some of the major methods to calculate stock market index

  1. Full Market Capitalization method

In this method, to determine the scrips weighted in the index, the number of shares outstanding is multiplied by the market price of companies shares. The share with the highest market capitalization would have a higher weighted in the index and would be most influential in the index.  In the end, Market capitalization of all companies will be added and it will be the final value of that index.

The number of shares outstanding means the total number of shares currently held by all its shareholders, including shares held by institutional investors and restricted shares owned by the company’s officers and insiders. S&P 500 index in the USA uses this method.

Full Market Capitalization = No. of shares outstanding * Market Price of one share

  1. Free Float Market Capitalization method

Free Float is the percentage of shares available in the market for trading. It excludes restricted shares held by the government in the form of strategic investment, shares held by companies officers and insiders, shares locked under employee stock option plan etc. Companies in the index are provided with the free float factors based on its percentage of shares in free float. Free float ranges from 0.05 to 1.0 Value of index through this method is calculated using following steps-

  • Free float market Capitalization using the formula = Total number of free float shares * Market price of each share * Free float factor
  • Add Market capitalization of all the companies in the index calculated through step 1.
  • Calculate the index value with the help of following formula.

Index Value = (Current Free Float Market Capitalization of index / Base Free Float Market Capitalization of index) * Base Index Value

Free float market capitalization method is used by both BSE and NSE

  1. Modified Capitalization Weighted

This method seeks to reduce the effect of largest stock in the index which would otherwise dominate the value of the index. This method sets a limit on percentage weight of the largest stock in the group of stocks. NASDAQ 100 uses this method.

  1. Price weighted Index

In price-weighted index calculation method,   each stock influences the index in proportion to its price per share. The value of the index is calculated by adding the prices of each stock in the index and dividing them by the total number of stocks. Stocks with a higher price are given more weight which has a greater influence on the performance of the index. Dow Johns Industrial Average uses this method.

  1. Equal Weighing

In this method, percentage weight of every stock in the index is equal. so, all the stocks have equal influence on the index value. Kansas City Board of Trade (KCBT) uses this method.

Concept of Index

The value of money does not remain constant over time. It rises or falls and is inversely related to the changes in the price level. A rise in the price level means a fall in the value of money and a fall in the price level means a rise in the value of money. Thus, changes in the value of money are reflected by the changes in the general level of prices over a period of time. Changes in the general level of prices can be measured by a statistical device known as ‘index number.’

Index number is a technique of measuring changes in a variable or group of variables with respect to time, geographical location or other characteristics. There can be various types of index numbers, but, in the present context, we are concerned with price index numbers, which measures changes in the general price level (or in the value of money) over a period of time.

Price index number indicates the average of changes in the prices of representative commodities at one time in comparison with that at some other time taken as the base period. According to L.V. Lester, “An index number of prices is a figure showing the height of average prices at one time relative to their height at some other time which is taken as the base period.”

Features of Index Numbers:

(i) Index numbers are a special type of average. Whereas mean, median and mode measure the absolute changes and are used to compare only those series which are expressed in the same units, the technique of index numbers is used to measure the relative changes in the level of a phenomenon where the measurement of absolute change is not possible and the series are expressed in different types of items.

(ii) Index numbers are meant to study the changes in the effects of such factors which cannot be measured directly. For example, the general price level is an imaginary concept and is not capable of direct measurement. But, through the technique of index numbers, it is possible to have an idea of relative changes in the general level of prices by measuring relative changes in the price level of different commodities.

(iii) The technique of index numbers measures changes in one variable or group of related variables. For example, one variable can be the price of wheat, and group of variables can be the price of sugar, the price of milk and the price of rice.

(iv) The technique of index numbers is used to compare the levels of a phenomenon on a certain date with its level on some previous date (e.g., the price level in 1980 as compared to that in 1960 taken as the base year) or the levels of a phenomenon at different places on the same date (e.g., the price level in India in 1980 in comparison with that in other countries in 1980).

Uses:

  • Index numbers are used in the fields of commerce, meteorology, labour, industry, etc.
  • Index numbers measure fluctuations during intervals of time, group differences of geographical position of degree, etc.
  • They are used to compare the total variations in the prices of different commodities in which the unit of measurements differs with time and price, etc.
  • They measure the purchasing power of money.
  • They are helpful in forecasting future economic trends.
  • They are used in studying the difference between the comparable categories of animals, people or items.
  • Index numbers of industrial production are used to measure the changes in the level of industrial production in the country.
  • Index numbers of import prices and export prices are used to measure the changes in the trade of a country.
  • Index numbers are used to measure seasonal variations and cyclical variations in a time series.

A collection of index numbers for different years, locations, etc., is sometimes called an index series.

  • Simple Index Number: A simple index number is a number that measures a relative change in a single variable with respect to a base.
  • Composite Index Number: A composite index number is a number that measures an average relative changes in a group of relative variables with respect to a base.

Types of Index Numbers

The following types of index numbers are usually used: price index numbers and quantity index numbers.

  • Price Index Numbers: Price index numbers measure the relative changes in the price of a commodity between two periods. Prices can be either retail or wholesale.
  • Quantity Index Numbers: These index numbers are considered to measure changes in the physical quantity of goods produced, consumed or sold for an item or a group of items.

Risk-Return Relationship

Investments with high risk tend to have high returns and vice versa. Another way to look at it is that for a given level of return, it is human nature to prefer less risk to more risk. Therefore, the higher the risk of an investment, the higher its returns have to be to attract investors.

The risk-return relationship is a fundamental concept in finance and investment theory, emphasizing that the potential return on an investment is usually directly correlated with the level of risk associated with it. This means that higher risk is typically associated with the potential for higher returns, and conversely, lower risk is associated with lower potential returns. Understanding this relationship is crucial for investors as it helps in making informed decisions that align with their investment goals, risk tolerance, and time horizon.

  1. Direct Relationship between Risk and Return

The direct relationship between risk and return is a fundamental principle in finance that indicates as the level of risk increases, the potential for higher returns also increases, and vice versa. This principle operates under the assumption that rational investors need to be compensated for taking on higher levels of risk, as there is a greater uncertainty associated with achieving the expected return.

(A) High Risk – High Return

According to this type of relationship, if investor will take more risk, he will get more reward. So, he invested million, it means his risk of loss is million dollar. Suppose, he is earning 10% return. It means, his return is Lakh but he invests more million, it means his risk of loss of money is million. Now, he will get Lakh return.

(B) Low Risk – Low Return

It is also direct relationship between risk and return. If investor decreases investment. It means, he is decreasing his risk of loss, at that time, his return will also decrease.

Examples of the Risk-Return Relationship

  • Government Bonds vs. Stocks:

Generally, government bonds are considered low-risk investments compared to stocks. Consequently, government bonds typically offer lower returns than stocks, which carry higher risk but also the potential for higher returns.

  • High-Yield (Junk) Bonds vs. Investment-Grade Bonds:

High-yield bonds offer higher interest rates than investment-grade bonds due to the higher credit risk associated with the issuing companies. Investors in high-yield bonds are compensated for accepting the increased risk of default.

  1. Negative Relationship between Risk and Return

The notion of a negative relationship between risk and return is contrary to the fundamental principles of finance, which typically assert a positive, direct relationship where higher risk is associated with higher expected returns. However, in specific contexts or interpretations, one might perceive scenarios or instances that seem to suggest a “negative” relationship, depending on how risk and return are defined or understood in those situations.

  • Risk-Aversion and Capital Preservation:

For extremely risk-averse investors, the primary goal may be capital preservation rather than growth. In such cases, investors may opt for safer, low-risk investments like government bonds or high-quality fixed deposits, which offer lower returns but also significantly lower risk of loss. Here, the “negative relationship” is more about the investor’s preference for low risk over high return, rather than an inherent characteristic of the investments.

  • Diminishing Marginal Returns to Risk:

In some investment strategies or during certain economic conditions, taking on additional risk does not proportionally increase expected returns. Beyond a certain point, the additional risk can lead to diminishing marginal returns. For instance, in a highly volatile market, aggressive investment strategies might lead to higher chances of loss, reducing the effective return on investment. Here, the perceived “negative relationship” is related to the efficiency of risk management rather than a fundamental principle.

  • Mispriced Assets or Anomalies:

Market inefficiencies or mispriced assets may temporarily lead to situations where lower-risk investments outperform higher-risk ones. For example, defensive stocks (considered lower risk) might outperform the market during economic downturns, while more speculative stocks (higher risk) decline in value. These anomalies, often corrected over time, might suggest a “Negative relationship” between risk and return in the short term.

  • Safe Haven Assets in Crisis Times:

During financial crises or periods of high market turmoil, investors often flock to safe-haven assets like gold or government bonds, which are perceived as lower risk. The increased demand for these assets can drive up their prices, leading to higher returns for these lower-risk investments in specific periods. Conversely, riskier assets like stocks may perform poorly. This flight to quality can create a temporary perception of a negative relationship between risk and return.

(A) High RiskLow Return

Sometime, investor increases investment amount for getting high return but with increasing return, he faces low return because it is nature of that project. There is no benefit to increase investment in such project. Suppose, there are 1,00,000 lotteries in which you will earn the prize of You have bought 50% of total lotteries. But, if you buy 75% of lotteries. Prize will same but at increasing of risk, your return will decrease.

(B) Low RiskHigh Return

There are some projects, if you invest low amount, you can earn high return. For example, Govt. of India need money. Because, govt. needs this money in emergency and Govt. is giving high return on small investment. If you get this opportunity and invest your money, you will get high return on your small risk of loss of money.

Ex-Ante and Ex-Post

Ex-Ante

Ex-ante refers to future events, such as the potential returns of a particular security, or the returns of a company. Transcribed from Latin, it means “before the event.”

Ex-ante is a Latin word that means “before the event,” and it is the estimated return that investors can expect to earn from an investment or the earnings that a company can expect to earn at the end of a specific period. In simple terms, it is the prediction of an event before it actually happens, and the actual outcome is uncertain. By making the prediction of the outcome, the obtained ex-ante value can then be compared to the actual performance when it happens.

Much of the analysis conducted in the markets is ex-ante, focusing on the impacts of long-term cash flows, earnings and revenue. While this type of ex-ante analysis focuses on company fundamentals, it often relates back to asset prices. For example, buy-side analysts often use fundamental factors to determine a price target for a stock, then compare the predicted result to actual performance.

For example, when preparing a merger of two competitors, analysts can predict the expected synergies that will emerge from such a transaction before it actually happens. The synergies may be in terms of changes in the share price, as well as the estimated earnings of the combined entity. The prediction can happen before the merger happens or immediately after the merger happens, but there is uncertainty about the possible effects of the transaction.

Working

Ex-ante is the prediction of an event before it happens, or before the participants become aware of the event. The prediction may involve individual products of a business, a business unit, or the entire business entity. The predicted outcome serves as a basis for comparing the prediction to the actual results (ex-post).

For example, the Federal Reserve makes ex-ante predictions on expected inflation to decide whether to raise or lower interest rates. The prediction is not based on actual data, since the event will occur in the future, and does not know with certainty how the economic performance will be.

For example, if the Fed raises interest rates, we can only know if the decision was right or wrong when the predicted outcome happens. If the increased interest rates and global recession pushed the economy into inflation, it might mean that raising the interest rates was a wrong decision. However, if the economy is still stable and performing above board three to five years later, it means that the Fed’s decision to raise interest rates was appropriate and timely.

Ex-Post

Ex-post is a Latin word that means “after the event,” and it is the opposite of the Latin word “ex-ante.” Investment companies use the concept to forecast the expected returns of a security based on the actual or historical returns earned by the security. Unlike ex-ante, which is based on estimated returns, ex-post represents the actual results attained by the company, which is the return earned by the company’s investors.

The use of historical returns has customarily been the most well-known approach to forecast the probability of incurring a loss on investment on any given day. Ex-post is the opposite of ex-ante, which means “before the event.”

Investors can use the ex-post data to get the actual performance of a security, without including any forecasts or projections that may be affected by market shocks. The ex-post value of a security can be obtained by deducting the price paid by investors from the current market price of the security.

Working

The ex-post value of an asset can be calculated by taking the starting and ending values during a specific period, usually less than a year, and then taking into account the asset value growth or declines, as well as earned income from the asset. The beginning value is the market price of the asset at that time or the price that investors paid for the asset if the purchase occurred within the measurement period. The ending value is the current market price of the asset or the price that potential investors would pay to acquire the asset today.

The value obtained can then be used to analyze investment price fluctuations or earnings, and predict the expected returns of a security or investment. The ex-post value (actual returns based on historical returns) can then be compared to the predicted returns to determine the accuracy of the risk assessment methods used. For example, when measuring the returns of a security from October 1 to December 31, calculate the difference between the starting value on October 1 and the ending value on December 31.

Risk and Return of a Single Asset

The typical object of investment is to make current income from investments in the form of dividends and interest income. The investments should earn reasonable and expected rate of return on investments. Certain investments like bank deposits, public deposits, debentures, bonds etc. will carry a fixed rate of return payable periodically.

In case of investments in shares of companies, the periodical payments in the form of dividends are not assured, but it may ensure higher returns than fixed income investments. But the investments in equity shares of companies carry higher risk than fixed income instruments.

Another form of return is in the form of capital appreciation. This element of return is the difference between the purchase price and the price at which the asset can be sold, it can be a capital gain or capital loss arising due to change in the price of the investment.

The rate of return of a particular investment is calculated as follows:

Annual Rate of Return:

The annual rate of return of a particular investment can be calculated as follows:

R = {D1+(P1-P0)}/P0

Were,

R = Annual rate of return of a share

D1 = Dividend paid at the end of the year

P0 = Market price of share at the beginning of the year

P1 = Market price of share at the end of the year

The above formula is used for calculation of annual return of an investment in shares. In the above formula, D1/P0 represents dividend yield and (P1 – P0)/P0 represents capital gain or loss.

Average Rate of Return:

The rate of return can also be calculated for a period more than one year. The average rate of return represents the average of annual rates of return over a period of years.

The formula used for calculation of average rate of return is given below:

R̅ = 1/n (R1+R2+…. +Rn)

Where, R̅ = Average rate of return

R1, R2 …..Rn = Annual rate of return in period 1, 2,…..

n = Total number of periods

Risk on Single Asset:

The concept of risk is more difficult to quantify. Statistically we can express risk in terms of standard deviation of return. For example, in case of gilt edged security or government bonds, the risk is nil since the return does not vary – it is fixed. But strictly speaking if we consider inflation and calculate real rate of return (inflation adjusted) we find that even government bonds have some amount of risk since the rate of inflation may vary.

Return from unsecured fixed deposits appear to have zero variability and hence zero risk. But there is a risk of default of interest as well as the principal. In such case the rate of return can be negative. Hence, this investment has high risk though apparently it carries zero risk. For other investments like shares, business etc., where the rate of return is not fixed, there may be a schedule of return with associated probability for each rate of return.

The mean of the probable returns gives the expected rate of return and the standard deviation or variance which is square of standard deviation measures risk. Higher the range of the probable return, higher the standard deviation and hence higher the risk. A risk averse investor will look for return where the range is low. Hence, low standard deviation means low risk.

The problem in portfolio management is to minimize the standard deviation without sacrificing expected rate of return. This is possible by diversification. Risk is measured in terms of variability of returns. If Investment ‘A’ and Investment ‘B’ whose mean rate of return is same as shown in figure 3.9.

Variability of Return

The returns of Investment ‘A’ show more variability than Investment ‘B’. In view of the variability of returns, Investment ‘A’ is riskier, even though both the investments are having the same mean returns.

Types of Risks

Risk is the probability that actual results will differ from expected results. In the Capital Asset Pricing Model (CAPM), risk is defined as the volatility of returns. The concept of “risk and return” is that riskier assets should have higher expected returns to compensate investors for the higher volatility and increased risk.

  1. Reputation Risk

There has always been the risk that an unhappy customer, product failure, negative press or lawsuit can adversely impact a company’s brand reputation. However, social media has amplified the speed and scope of reputation risk. Just one negative tweet or bad review can decrease your customer following and cause revenue to plummet.

To prepare for this risk, leverage reputation management strategies to regularly monitor what others are saying about the company online and offline. Be ready to respond to those comments and help address any concerns immediately. Keep quality top of mind to avoid lawsuits and product failures that can also damage your company’s reputation.

  1. Operational Risk

This business risk can happen internally, externally or involve a combination of factors. Something could unexpectedly happen that causes you to lose business continuity.

That unexpected event could be a natural disaster or fire that damages or destroys your physical business. Or, it might involve a server outage caused by technical problems, people, or power cut. Many operational risks are also people-related. An employee might make mistakes that cost time and money.

Whether it’s a people or process failure, these operational risks can adversely impact your business in terms of money, time and reputation. Address each of these potential operational risks through training and a business continuity plan. Both tactics provide a way to think about what could go wrong and establish a backup system or proactive measures to ensure operations aren’t affected.

  1. Economic Risk

The economy is constantly changing as the markets fluctuate. Some positive changes are good for the economy, which lead to booming purchase environments, while negative events can reduce sales. It’s important to watch changes and trends to potentially identify and plan for an economic downturn.

To counteract economic risk, save as much money as possible to maintain a steady cash flow. Also, operate with a lean budget with low overhead through all economic cycles as part of your business plan.

  1. Compliance Risk

Business owners face an abundance of laws and regulations to comply with. For example, recent data protection and payment processing compliance could impact how you handle certain aspects of your operation. Staying well versed in applicable laws from federal agencies like the Occupational Safety and Health Administration (OSHA) or the Environmental Protection Agency (EPA) as well as state and local agencies can help minimize compliance risks.

  1. Competition (or Comfort) Risk

While a business may be aware that there is always some competition in their industry, it’s easy to miss out on what businesses are offering that may appeal to your customers.

In this case, the business risk involves a company leader becoming so comfortable with their success and the status quo that they don’t look for ways to pivot or make continual improvements. Increasing competition combined with an unwillingness to change may result in a loss of customers.

Enterprise risk management means a company must continually reassess their performance, refine their strategy, and maintain strong, interactive relationships with their audience and customers. Additionally, it’s important to keep an eye on the competition by regularly researching how they use online and social media channels.

  1. Security and Fraud Risk

As more customers use online and mobile channels to share personal data, there are also greater opportunities for hacking. News stories about data breaches, identity theft and payment fraud illustrate how this type of risk is growing for businesses.

Not only does this risk impact trust and reputation, but a company is also financially liable for any data breaches or fraud. To achieve effective enterprise risk management, focus on security solutions, fraud detection tools and employee and customer education about how to detect any potential issues.

  1. Financial Risk

This business risk may involve credit extended to customers or your own company’s debt load. Interest rate fluctuations can also be a threat.

Making adjustments to your business plan will help you avoid harming cash flow or creating an unexpected loss. Keep debt to a minimum and create a plan that will start lowering that debt load as soon as possible. If you rely on all your income from one or two clients, your financial risk could be significant if one or both no longer use your services. Start marketing your services to diversify your base so the loss of one won’t devastate your bottom line.

Causes of Risk

Business risk refers to a threat to the company’s ability to achieve its financial goals. In business, risk means that a company’s or an organization’s plans may not turn out as originally planned or that it may not meet its target or achieve its goals.

Such risks cannot always be blamed on the owner of the company, as risk can be influenced by various external factors, which may include rising prices of raw materials for production, growing competition, or changes or additions to existing government regulations.

Factors responsible for causing risks in investment

  1. Demand and supply forces

In securities market, the role played by the demand and supply forces is very vital. When they cannot be properly predicted, then the security prices will show wide variations. Fluctuations in prices make the securities risky.

  1. Maturity period

If investments have a longer maturity period, then they will invite more risks because of the duration of the investment.

  1. Security

Investment may be secured or unsecured. If the investment is secured by collateral securities, then the risk will be less.

  1. Unsatisfactory credit worthiness of the issuer

Generally, the securities of Government and semi-government bodies are having a high degree of credit worthiness. But securities issued by the companies in the private sector do not command much credit worthiness. In situations where the credit worthiness of the issuer is not satisfactory, risks are bound to arise.

  1. Selection of the highly risky investment instruments

There is different nature of investments such as corporate shares or bonds, chit funds, Nidhis, Benefit funds, etc. These investments are considered to be highly risky as they relate to the unorganized sector. But some instruments like bank deposits, post office certificates like National saving certificates, Kisan Vikas Patras, etc, are less risky. Because these instruments ensure certainty of payment of interest and principal.

  1. Incorrect decision taken with regard to investment

In investments, what to buy and sell are the main decisions to be made. The decision to buy or sell depends upon the estimation of the fair intrinsic value of the shares, over valuation or under valuation of the share and also a number of other factors. Any mistake committed while making an investment decision, therefore, causes considerable risk in investment.

  1. Failure to judge the correct timing of investment

The most important factor in the investment programme is the timing of purchase or sale of securities. The prices of stock fluctuate with each stock having its own cycle of fluctuations. If the investor is able to forecast these price changes, he is in a position to make a higher profit.

In boom periods, the prices of stock rise and during depression they fall. An analysis of the price behavior of the individual scrip will help to locate the buy and sell points.

  1. Amount of investment

Investing a huge amount in a particular security is quite risky. The higher the amount invested in any security, more will be the risk. On the other hand, judicious mix of investments in small quantities may be ideal.

  1. Nature of Business

Selection of a risky industry for investment is only inviting the trouble. As any business is prone to ups and downs, its prosperity should not be taken for granted. Any unfavorable trend in the industry will affect the company also.

  1. Terms of lending

Terms of lending such as periodicity of servicing, redemption periods, etc., are the factors which cause risk in the investment concerned.

  1. National and international factors

In the days of sophisticated means of communication, even the changes taking place in foreign markets influence the markets of other parts of world. Similarly, changes in conditions within the country are quickly reflected in security prices. So, national and international factors cause risk in investment.

Investment Vs Speculation

Investment

Investment refers to the acquisition of the asset, in the expectation of generating income. In a wider sense, it refers to the sacrifice of present money or other resources for the benefits that will arise in future. The two main element of investment is time and risk

Nowadays, there is a range of investment options available in the market as you can deposit money in the bank account, or you can acquire property, or purchase shares of the company, or invest your money in government bonds or contribute in the funds like EPF or PPF.

Investments are majorly divided into two categories i.e. fixed income investment and variable income investment. In fixed income investment there is a pre-specified rate of return like bonds, preference shares, provident fund and fixed deposits while in variable income investment, the return is not fixed like equity shares or property.

Speculation

Speculation is a trading activity that involves engaging in a risky financial transaction, in expectation of making enormous profits, from fluctuations in the market value of financial assets. In speculation, there is a high risk of losing maximum or all initial outlay, but it is offset by the probability of significant profit. Although, the risk is taken by speculators is properly analysed and calculated.

Speculation ca be seen in markets where the high fluctuations in the price of securities such as the market for stocks, bonds, derivatives, currency, commodity futures, etc.

An Investment is an asset acquired with the intent of generating income or appreciation in the future, whereas Speculation is a financial transaction that has a substantial risk of losing all value, but with the expectation of a significant gain.

Investors and traders take on calculated risk as they attempt to profit from transactions they make in the markets. The level of risk undertaken in the transactions is the main difference between investing and speculating.

Whenever a person spends money with the expectation that the endeavor will return a profit, they are investing. In this scenario, the undertaking bases the decision on a reasonable judgment made after a thorough investigation of the soundness that the endeavor has a good probability of success.

But what if the same person spends money on an undertaking that shows a high probability of failure? In this case, they are speculating. The success or failure depends primarily on chance, or on uncontrollable (external) forces or events.

The primary difference between investing and speculating is the amount of risk undertaken. High-risk speculation is typically akin to gambling, whereas lower-risk investing uses a basis of fundamentals and analysis.

As per Benjamin Graham, an American economist, and professional investor, investment is an activity, which upon complete analysis assures the safety of the amount invested and adequate return. Conversely, speculation is an activity which does not satisfy these requirements.

The basic distinguishing point amidst these two is that income in the investment is consistent, but in the case of speculation is inconsistent. So this article makes an attempt to clear the differences between investment and speculation.

Investment vs Speculation: They can be compared on the basis of 4 major criteria’s they are:

  • Time Horizon
  • Risk Levels
  • Decision Criteria
  • Investors Attitude
  1. Time Horizon

Investment are generally held for a long term this may range from 2-5 years or more than that whereas speculation is held for a very short time span this is basically less than a year.

  1. Risk Levels

The amount of risk is relatively moderate in investment when compared with speculation. Speculation generally involves greater risk than investing like options, futures, financial derivatives and similar financial instruments. Speculators ofter tent to be looking for a larger and quicker payout than long-term investors. Both involve risk but as the things move fast in speculations it is riskier than investing.

  1. Decision Criteria

Investors tend to have a more basic fundamental approach whereas speculators, on the other hand, focus more on trends, market or investors psychology, they usually focus on these factors for a booking a quick profit.

  1. Investors Attitude

Investors mostly have cautious and conservative considering their risk appetite, they know their capability and invest as per the risk that they can absorb, in case of speculator they are more aggressive with a high-risk appetite.

Differences

  1. Investment refers to the purchase of an asset with the hope of getting returns. The term speculation denotes an act of conducting a risky financial transaction, in the hope of substantial profit.
  2. In investment, the decisions are taken on the basis of fundamental analysis, i.e. performance of the company. On the other hand, in speculation decisions are based on hearsay, technical charts, and market psychology.
  3. The quantity of risk is moderate in investment and high in case of speculation.
  4. Investments are held for at least one year. Hence, it has a longer time horizon than speculation, where speculators hold assets for short term only.
  5. The investors, expect profit from the change in the value of the asset. As opposed to speculators who expect profit from the change in the prices, due to demand and supply forces.
  6. An investor expects the modest rate of return on the investment. On the contrary, a speculator expects higher profits from the speculation in exchange for the risk borne by him.
  7. The investor uses his own funds for investment purposes. Conversely, speculator uses borrowed capital for speculation.
  8. In speculation, the stability of income is absent it is uncertain and erratic which is not in the case of investment.
  9. The psychological attitude of investors is conservative and cautious. In contrast, speculators are daring and careless.
error: Content is protected !!