Evaluation of Synergy

When a company acquires another business, it is often justified by the argument that the investment will create synergies. The primary source of synergy in an acquisition is in the presumption that the target firm controls a specialized resource that becomes more valuable if combined with the acquiring firm’s resources. There are two main types, operating synergy and financial synergy, and this guide will focus on the latter.

Value can be created, for example, through revenue enhancement, cost reductions, increased operating cash flow, improved managerial decision making, or the sale of redundant assets. However, the value created from proposed synergies also may have an additional investment cost as well.

Synergy takes the form of revenue enhancement and cost savings.

When two companies in the same industry merge, such as two banks, combined revenues tend to decline to the extent that the businesses overlap in the same market and some customers become alienated.

For the merger to benefit shareholders, there should be cost-saving opportunities to offset the revenue decline. In other terms, the synergies deriving from the merger must exceed the initially lost value.

As a rule of thumb, synergy is a business combination where 2+2 = 5.

Many analysts, however, do not consider these incremental investments or “hidden” costs when performing a pricing analysis or valuation of a potential target. Failure to consider the hidden costs often causes the overvaluation of a potential target, which may lead to destroying value rather than creating it.

Synergy appeared due to acquisition should include higher results then it was originally expected.

Acquisition process should be well-planned. Mark Sirower, the US leader of the Merger & Acquisition Strategy and Commercial Diligence practice, named 4 components which should take place in order to achieve successful synergies:

  • Strategic vision
  • Operating strategy
  • Systems integration
  • Power and culture

The buyer should pay out the premium to shareholders of merged company. The higher the premium, the lower the potential benefit for the buyer. Therefore, synergies should not be intangible. It should be carefully forecast and discounted from net cash flows which are feasible within the chosen time frame.

Post-merger integration issues, as well as competitors’ reactions, can contribute to the hidden costs of an acquisition.

Besides the positive impact of revenue enhancements, cost reductions, and other efficiencies, valuation analysts need to price them in, too.

Synergy: Meaning, Concept and Types

Synergy is the concept that the combined value and performance of two companies will be greater than the sum of the separate individual parts. Synergy is a term that is most commonly used in the context of mergers and acquisitions (M&A). Synergy, or the potential financial benefit achieved through the combining of companies, is often a driving force behind a merger.

Synergy is the concept that the whole of an entity is worth more than the sum of the parts. This logic is typically a driving force behind mergers and acquisitions (M&A), where investment bankers and corporate executives often use synergy as a rationale for the deal. In other words, by combining two companies in a merger, the new company’s value will be greater than the sum of the values of each of the two companies being merged.

Concept of Synergy

Mergers and acquisitions (M&A) are made with the goal of improving the company’s financial performance for the shareholders. Two businesses can merge to form one company that is capable of producing more revenue than either could have been able to independently, or to create one company that is able to eliminate or streamline redundant processes, resulting in significant cost reduction. Because of this principle, the potential synergy is examined during the M&A process. If two companies can merge to create greater efficiency or scale, the result is what is sometimes referred to as a synergy merge.

Shareholders will benefit if a company’s post-merger share price increases due to the synergistic effect of the deal. The expected synergy achieved through the merger can be attributed to various factors, such as increased revenues, combined talent, and technology, or cost reduction.

For example, when Proctor & Gamble Company acquired Gillette in 2005, a P&G news release cited that “the increases to the company’s growth objectives are driven by the identified synergy opportunities from the P&G/Gillette combination. The company continues to expect cost synergies of approximately $1 to $1.2 billion…and an increase in the annual sales run-rate of about $750 million by 2008.” In the same press release, then P&G chairman, president, and chief executive A.G. Lafley stated, “…We are both industry leaders on our own, and we will be even stronger and even better together.” This is the idea behind synergy—that by combining two companies the financial results are greater than what either could have achieved alone.

In addition to merging with another company, a company may also attempt to create synergy by combining products or markets. For example, a retail business that sells clothes may decide to cross-sell products by offering accessories, such as jewelry or belts, to increase revenue.

A company can also achieve synergy by setting up cross-disciplinary workgroups, in which each member of the team brings with him or her a unique skill set or experience. For example, a product development team may consist of marketers, analysts, and R&D experts. This team formation could result in increased capacity and workflow and, ultimately, a better product than all the team members could produce if they work separately.

 Synergy can also be negative. Negative synergy is derived when the value of the combined entities is less than the value of each entity if it operated alone. This could result if the merged firms experience problems caused by vastly different leadership styles and company cultures.

Synergy is reflected on a company’s balance sheet through its goodwill account. Goodwill is an intangible asset that represents the portion of the business value that cannot be attributed to other business assets. Synergies may not necessarily have a monetary value but could reduce the costs of sales and increase profit margin or future growth. In order for synergy to have an effect on the value, it must produce higher cash flows from existing assets, higher expected growth rates, longer growth periods, or lower cost of capital.

Types of Synergy

  1. Operating Synergy

When the combined value of two firms is greater than the sum of the separate firms apart and, when the combined firm allows for the firms to increase their operating income and achieve higher growth it is termed as ‘’Operating synergy’.’ Operating synergies arise from the following:

Economies of scale, greater pricing power and higher margins resulting from greater market share and lower competition, combination of different functional strengths such as marketing skills and good product line, or higher levels of growth from new and expanded markets.

Operating synergies are achieved through merger, acquisition or takeovers of firms which have competencies in different areas such as production, research and development or marketing and finance can also help achieve operating efficiencies. Tata Steel which is one of the biggest Indian steel companies; it took over Corus which was Europe’s second largest steel company in 2007. Tata Steel’s takeover of the European steel major Corus for the price of $12.02 billion made the Indian company, the world’s fifth-largest steel producer. The acquisition was intended to give Tata steel access to the European markets and to achieve potential synergies in the areas of manufacturing, procurement, R&D, logistics, and back office operations.

  1. Financial Synergy

Financial synergies are most often appraised in the context of mergers and acquisitions, but latest strategic alliances include strategic partnerships. These types of synergies relate to improvement in the financial metric of a combined business such as revenue, debt capacity, cost of capital, profitability, etc. Examples of positive financial synergies include: Increased revenues through a larger customer base, lower costs through streamlined operations, talent and technology harmonies.

In addition to above, financial synergies can result in the following benefits post acquisition: Increased debt capacity, greater cash flows, lower cost of capital, tax benefits etc. The Renault-Nissan (Franco – Japanese) strategic partnership or car making alliance expects to generate 5.5 billion euros ($6 billion) of synergies in 2018 by integrating more divisions and sharing resources better within the partnership. Increased union between the French carmaker and its 43.4 percent-owned Japanese partner generated more than 4 billion euros in synergies in 2015.

The two companies go together to benefit from cost cutting.  As of December 2016, the Alliance is the world’s leading plug-in-electric vehicle manufacturer, with global sales since 2010 of almost 425,000 pure electric vehicles, including those manufactured by Mitsubishi Motors which is also now part of the Alliance. The strategic alliance partnership between Renault and Nissan is not a merger or an acquisition. The two companies are joined together through a cross-sharing agreement. The structure was unique in the auto industry during the 1990s consolidation trend and later served as a model for General Motors and PSA Peugeot Citroen.

  1. Marketing synergy

Marketing synergy implies that the marketing-mix makes for overall effectiveness. For example, by grabbing an opportunity which makes it possible to gain increased utilization of existing marketing and distribution facilities, it may be possible to enhance sales revenues without causing a proportionate increase in costs. Hero Honda Ltd was a joint venture between Hero Cycles of India and Honda Motor of Japan. Hero Cycle’s long experience about Indian road conditions including Indian rural and urban customers was wholly combined with Honda Motor’s superior technological capability to create the expected  synergy effect for producing a highly fuel efficient and sturdy motor cycle to suit the exact requirements of the Indian customers and meet the rough road conditions as early as 1985. The partnership lasted for 26 years.

Models of Strategy Making

Modes of strategic management are the actual kinds of approaches taken by managers in formulating and implementing strategies. They address the issues of who has the major influence in the strategic management process and how the process is carried out. Research indicates that managers tend to use one of three major approaches to, or modes of strategic management: entrepreneurial, adaptive, and planning. The mode selected is likely to influence the degree of innovation that occurs within the organization. Innovation is particularly important in the context of strategic management, because organizations that do not continually incorporate new ideas are likely to fail behind competitively, particularly when the environment is changing rapidly.

  1. Entrepreneurial Mode

“Entrepreneurial mode is an approach in which strategy is formulated mainly by a strong visionary chief executive who actively searches for new opportunities, is heavily oriented toward growth, and is willing to make bold strategies rapidly”. The entrepreneurial searches for new mode are most likely to be found in organizations that are young or small, have a strong leader, or are in such serious trouble that bold are their only hope. Not surprisingly, in the entrepreneurial mode, the extent to which the strategic management process encourages innovation depends largely on the orientation of top leaders. Their personalities, power, and information enable them to overcome obstacles and push for change. Conversely, strong leaders also are in a position to threat innovative activities, should they be so inclined.

  1. Adaptive Mode

“Adaptive mode is an approach to strategy formulation that emphasizes taking small incremental steps, reacting to problems rather than seeking opportunities, and attempting to satisfy a number of organizational power groups”. The adaptive mode is most likely to be used by managers in established organizations that face a rapidly changing environment and yet have several coalitions, or power blocks, that make it difficult to obtain agreement on clear strategic goals and associated long-term plans. For example, before London-based Grand Metropolitan PLC purchased Pillsbury, including the Burger King Chain, the chain was plagued by constant turnover, marketing problems, inconsistent service, and angry franchisees who frequently told Pillsbury what to do.  Grand Metropolitan is now working to put the chain back on track through a strategy that emphasizes, doing “whatever it takes to create a positive, memorable experience.” Concrete measures include increasing the number of field representatives who visit Burger King stores, highlighting cleanliness, and rewarding employees who take the initiative in improving service by doing things differently.

With the adaptive approach, the degree of innovation fostered by the strategic management process is likely to depend on the ability of managers to agree on at least some major goals and basic strategies that set essential directions. In addition, lower-level managers must have some flexibility in carrying out the basic strategy rather than being given extremely detailed plans to follow; this approach might be effective in a more stable environment or one in which agreement among coalitions is easy to obtain. Without at least some agreement among high-level managers on major goals and directions, however the adaptive mode may be ineffective in moving the organization in viable strategic directions.

  1. Planning Mode

Planning mode is an approach to strategy formulation that involves systematic, comprehensive analysis, along with integration of various decisions and strategies”. Martin. With the planning mode, executives often utilize planning specialists to help with the strategic management process. The ultimate aim of the planning mode is to understand the environment well enough to influence it. The planning mode is most likely to be used in large organizations that have enough resources to conduct comprehensive analysis, have an internal situation in which agreement is possible on major goals, and face an environment that has enough stability to enable the formulation and implementation of carefully conceived strategies. For example, Disney’s plans include entry into the convention hotel business with its Dolphin Hotel, operated by the Sheraton Corporation, and Swan Hotel, run by the Westin Hotel Company. Combined, the two hotels offer 2350 rooms and more than 200,000 square feet of convention space inside Disney World. The hotels were heavily booked well in advance of their opening in 1990.

With the planning mode, innovation is most likely to occur when strategies explicitly articulate needs for product and service innovation and when top-level managers, such as those at Disney, help integrate efforts in the direction of encouraging innovation.

Assessing the Strategic Management Modes

Each mode can be relatively successful as long as it is matched to an appropriate situation. In fact, it may be possible to use different modes within the same organization. For example, a top-level manager may adopt an entrepreneurial mode for a new business that is just starting and use the planning mode for strategic management of the rest of the organization.

Each of these modes of strategic management can either promote organizational innovation or stifle it, depending on how the mode is used. Still, operating effectively in any of the three modes requires knowledge of the strategic management process. In carrying out the process, once the mission and strategic goals are determined, managers engage in competitive analysis.

Strategic Analysis & Choice & Implementation

Strategy analysis and choice focuses on generating and evaluating alternative strategies, as well as on selecting strategies to pursue. Strategy analysis and choice seeks to determine alternative courses of action that could best enable the firm to achieve its mission and objectives.

The firm’s present strategies, objectives, and mission together with the external and internal audit information, provide a basis for generating and evaluating feasible alternative strategies. The alternative strategies represent incremental steps that move the firm from its current position to a desired future state.

Alternative strategies are derived from the firm’s vision, mission, objectives, external audit, and internal audit and are consistent with past strategies that have worked well. The strategic analysis discusses the analytical techniques in two stages i.e. techniques applicable at corporate level and then techniques used for business-level strategies.

The techniques that have been discussed for the corporate level include BCG matrix, GE nine-cell planning grid, Hofer’s matrix and Shell Directional Policy Matrix and the techniques for business- level include SWOT analysis, experience curve analysis, grand strategy selection matrix, grand strategy clusters.

The judgmental factors constitute the other aspect on the basis of which strategic choice is made.

As environment changes, companies need to change their strategies to adapt to the environment not only to prosper but also to survive. Based on the multiple strategic choices, each choice is analyze and the best one is selected and implemented.

Strategic analysis and choice are two important components of the implementation stage of the strategic management plan. These two components are crucial links in the strategic management implementation procedure.

Strategic analysis is all about analyzing the strength of businesses’ position and understanding the important external factors that may influence that position. Factors Taken into Consideration for Strategic Analysis and Choice

Key Internal Factors

  • Marketing
  • Management
  • Operations/Production
  • Accounting/Finance
  • Computer Information Systems
  • Research and Development

Key External Factors

  • Political/Governmental/Legal
  • Economy
  • Technological
  • Social/Demographic/Cultural/Environmental
  • Competitive

Techniques Used in Strategic Analysis

The following devices or techniques are used in the procedure of strategic analysis:

  • Five Forces Analysis
  • PEST Analysis (Political, Economic, Social and Technological Analysis)
  • Market segmentation
  • Scenario planning
  • Competitor analysis
  • Directional policy matrix
  • SWOT Analysis (Strength, Weaknesses, Opportunities, and Threats Analysis)
  • Critical Success Factor Analysis

Strategic choice

Strategic choice involves understanding the nature of stakeholders expectations, identifying the strategic option and evaluating and selecting the best/optimal choice amongst all.

Strategic implementation

Strategic implementation is the penultimate stage of strategic management and strategic analysis and choice are two significant constituents of that process.

Characteristics of Strategic Analysis and Choice

Following are the features of strategic analysis and choice:

  • Establishment of long term goals
  • Producing strategy options
  • Choosing strategies to act on
  • Selecting the best option and accomplishing mission and goal

At the time of performing strategic analysis and arriving at strategic choices, long term goals are fixed and different types of strategies are chosen that are most appropriate for the mission of the company and the variable conditions.

Strategic analysis and choice of strategies are done with the help of a number of techniques. If the appropriate strategy is chosen, a company would become more efficient to establish sustainability in competitive advantage and maximize firm valuation.

BCG Matrix

Boston Consulting Group (BCG) Matrix is a four celled matrix (a 2 * 2 matrix) developed by BCG, USA. It is the most renowned corporate portfolio analysis tool. It provides a graphic representation for an organization to examine different businesses in it’s portfolio on the basis of their related market share and industry growth rates. It is a two dimensional analysis on management of SBU’s (Strategic Business Units). In other words, it is a comparative analysis of business potential and the evaluation of environment.

According to this matrix, business could be classified as high or low according to their industry growth rate and relative market share.

Relative Market Share = SBU Sales this year leading competitors sales this year.

Market Growth Rate = Industry sales this year – Industry Sales last year.

The analysis requires that both measures be calculated for each SBU. The dimension of business strength, relative market share, will measure comparative advantage indicated by market dominance. The key theory underlying this is existence of an experience curve and that market share is achieved due to overall cost leadership.

BCG matrix has four cells, with the horizontal axis representing relative market share and the vertical axis denoting market growth rate. The mid-point of relative market share is set at 1.0. if all the SBU’s are in same industry, the average growth rate of the industry is used. While, if all the SBU’s are located in different industries, then the mid-point is set at the growth rate for the economy.

Resources are allocated to the business units according to their situation on the grid. The four cells of this matrix have been called as stars, cash cows, question marks and dogs. Each of these cells represents a particular type of business.

  1. Stars

Stars represent business units having large market share in a fast growing industry. They may generate cash but because of fast growing market, stars require huge investments to maintain their lead. Net cash flow is usually modest. SBU’s located in this cell are attractive as they are located in a robust industry and these business units are highly competitive in the industry. If successful, a star will become a cash cow when the industry matures.

  1. Cash Cows

Cash Cows represents business units having a large market share in a mature, slow growing industry. Cash cows require little investment and generate cash that can be utilized for investment in other business units. These SBU’s are the corporation’s key source of cash, and are specifically the core business. They are the base of an organization. These businesses usually follow stability strategies. When cash cows loose their appeal and move towards deterioration, then a retrenchment policy may be pursued.

  1. Question Marks

Question marks represent business units having low relative market share and located in a high growth industry. They require huge amount of cash to maintain or gain market share. They require attention to determine if the venture can be viable. Question marks are generally new goods and services which have a good commercial prospective. There is no specific strategy which can be adopted. If the firm thinks it has dominant market share, then it can adopt expansion strategy, else retrenchment strategy can be adopted. Most businesses start as question marks as the company tries to enter a high growth market in which there is already a market-share. If ignored, then question marks may become dogs, while if huge investment is made, then they have potential of becoming stars.

  1. Dogs

Dogs represent businesses having weak market shares in low-growth markets. They neither generate cash nor require huge amount of cash. Due to low market share, these business units face cost disadvantages. Generally retrenchment strategies are adopted because these firms can gain market share only at the expense of competitor’s/rival firms. These business firms have weak market share because of high costs, poor quality, ineffective marketing, etc. Unless a dog has some other strategic aim, it should be liquidated if there is fewer prospects for it to gain market share. Number of dogs should be avoided and minimized in an organization.

Limitations of BCG Matrix

The BCG Matrix produces a framework for allocating resources among different business units and makes it possible to compare many business units at a glance. But BCG Matrix is not free from limitations, such as-

  • BCG matrix classifies businesses as low and high, but generally businesses can be medium also. Thus, the true nature of business may not be reflected.
  • Market is not clearly defined in this model.
  • High market share does not always leads to high profits. There are high costs also involved with high market share.
  • Growth rate and relative market share are not the only indicators of profitability. This model ignores and overlooks other indicators of profitability.
  • At times, dogs may help other businesses in gaining competitive advantage. They can earn even more than cash cows sometimes.
  • This four-celled approach is considered as to be too simplistic.

GE 9Cell

GE nine cell planning grid, tries to overcome some of the limitations of BCG matrix in two ways:

  1. It uses multiple factors to assess industry attractiveness and business strength in place of the single measure employed in the BCG matrix.
  2. It expanded the matrix from four cells to nine cells. It replaced the high/low axes with high/medium/low making a finer distinction between business portfolio positions.

Each business is appraised in terms of two major dimensions Market Attractiveness and Business Strength. If one of these factors is missing, then the business will not produce desired results. Neither a strong company operating in an unattractive market, nor a weak company operating in an attractive market will do very well

The vertical axis denotes

Industry attractiveness indicates how hard or easy it will be for a company to compete in the market and earn profits. The more profitable the industry is the more attractive it becomes. When evaluating the industry attractiveness, analysts should look how an industry will change in the long run rather than in the near future, because the investments needed for the product usually require long lasting commitment.

  • Long run growth rate
  • Industry size
  • Industry profitability: entry barriers, exit barriers, supplier power, buyer power, threat of substitutes and available complements (use Porter’s Five Forces analysis to determine this)
  • Industry structure (use Structure-Conduct-Performance framework to determine this)
  • Product life cycle changes
  • Changes in demand
  • Trend of prices
  • Macro environment factors (use PEST or PESTEL for this)
  • Seasonality
  • Availability of labor
  • Market segmentation

Horizontal axis represent

Along the X axis, the matrix measures how strong, in terms of competition, a particular business unit is against its rivals. In other words, managers try to determine whether a business unit has a sustainable competitive advantage (or at least temporary competitive advantage) or not.

  • Total market share
  • Market share growth compared to rivals
  • Brand strength (use brand value for this)
  • Profitability of the company
  • Customer loyalty
  • VRIO resources or capabilities (use VRIO framework to determine this)
  • Your business unit strength in meeting industry’s critical success factors (use Competitive Profile Matrix to determine this)
  • Strength of a value chain (use Value Chain Analysis and Benchmarking to determine this)
  • Level of product differentiation
  • Production flexibility

Green zone

Suggests you to ‘go ahead’, to grow and build, pushing you through expansion strategies. Businesses in the green zone attract major investment.

Yellow zone

 Cautions you to ‘wait and see’ indicating hold and maintain type of strategies aimed at stability.

Red zone

 Indicates that you have to adopt turnover strategies of divestment and liquidation or rebuilding approach.

Advantages of GE 9CELL

  • Helps to prioritize the limited resources in order to achieve the best returns.
  • The performance of products or business units becomes evident.
  • It’s more sophisticated business portfolio framework than the BCG matrix.
  • Determines the strategic steps the company needs to adopt to improve the performance of its business portfolio.

Disadvantage of GE 9CELL

  • Needs a consultant or an expert to determine industry’s attractiveness and business unit strength as accurately as possible.
  • It is expensive to conduct.
  • It doesn’t take into account the harmony that could exist between two or more business units.

The grid then does rating of each of the company’s business units on multiple sets of strategic factor within each axis of the grid.

In order to assess the industry attractiveness factors such as market growth, size of market, industry profitability, competition, seasonality and cyclical qualities, economies of scale, technology, and social/environmental/ legal/human factors are included.

For assessing business strength factors such as market share, profit margin, ability to compete, customer and market knowledge, competitive position, technology, and management caliber are identified.

The strategists then calculate “subjectively” a business’s position within the planning grid by quantifying the two dimensions of the grid.

The strategist first selects industry attractiveness factors to measure industry attractiveness and then assign each industry attractiveness factor a weight that reflects its perceived importance as compared to other attractiveness factors. Favorable to unfavorable future conditions for those factors are forecast and rated based on some scale (0 to 1 scale is illustrative).

Then a weighted composite scope is obtained for a business’s overall industry attractiveness. In order to assess business, a similar procedure is followed in selecting factors, assigning weights to them, and then rating the business on these dimensions.

Thus the GE planning grid might prove to be a useful tool for assessing a business within a corporate portfolio. Usually several managers are involved during the planning process. The inclusion and exclusion of factors and their rating and weighting are primarily matters of managerial judgment. This classifies businesses in terms of both the projected strength of the business and the projected attractiveness of the industry.

The decisions concerning the resource allocation remain quite similar to those in the BCG approach. Business classified as invest to grow would be treated like the stars in the BCG matrix. These businesses would be provided resources to pursue growth-oriented strategies.

Businesses classified in the harvest/divest category would be managed like the dogs in the BCG matrix. Businesses classified, as selectivity/ earnings would either be managed as cash cows or as question marks.

While the strategic recommendations generated by the GE planning grid are similar to those from the BCG matrix, the GE nine-cell grid improves on the BCG matrix in three fundamental ways.

  • The terminology associated with GE grid is preferable because it is less offensive and more universally understood.
  • The multiple measures associated with each dimension of the GE grid include more factors relevant to business strength and market attractiveness than simply market share and market growth.
  • The nine-cell format allows finer distinction between portfolio positions than does the four-cell BCG format.

Porter Five Forces Model

The main purpose of industry analysis, in the context of strategic choice is to determine the industry attractiveness, and to understand the structure and dynamics of the industry with a view to find out the continued relevance to strategic alternatives that are there before a firm.

It follows that, for instance, if the industry is not, or no longer, sufficiently attractive (i.e. it does not offer long-term growth opportunities), then the strategic alternatives that lie within the industry should not be considered. It also means that alternative may have to be sought outside the industry calling for diversification moves.

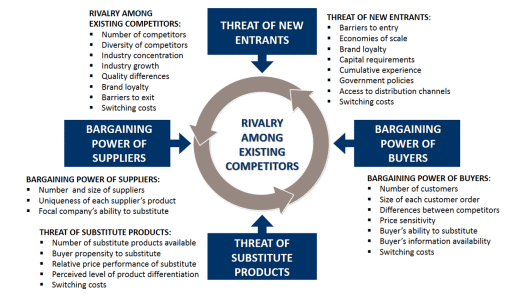
Porter’s Five Forces is a business analysis model that helps to explain why different industries are able to sustain different levels of profitability. The model was originally published in Michael Porter’s book, “Competitive Strategy: Techniques for Analyzing Industries and Competitors” in 1980.

The model is widely used to analyze the industry structure of a company as well as its corporate strategy. Porter identified five undeniable forces that play a part in shaping every market and industry in the world. The forces are frequently used to measure competition intensity, attractiveness and profitability of an industry or market.

These Forces are:

  1. Threat of New entrants

This force determines how easy (or not) it is to enter a particular industry. If an industry is profitable and there are few barriers to enter, rivalry soon intensifies. When more organizations compete for the same market share, profits start to fall. It is essential for existing organizations to create high barriers to enter to deter new entrants.

  • Low amount of capital is required to enter a market;
  • Existing companies can do little to retaliate;
  • Existing firms do not possess patents, trademarks or do not have established brand reputation;
  • There is no government regulation;
  • Customer switching costs are low (it doesn’t cost a lot of money for a firm to switch to other industries);
  • There is low customer loyalty;
  • Products are nearly identical;
  • Economies of scale can be easily achieved.

New entrants raise the level of competition in an industry and reduce its attractiveness. Threat of new entrants depends on barriers to entry. More barriers to entry reduce the threat of new entrants. Some of the key entry barriers are:

  • Economies of scale

Industries where the fixed investment is high (such as automobiles), yield higher profits with larger scale of operations. In such industries, established players may have economies of scale of production which new entrants will not have, thus acting as a barrier.

  • Capital requirements

Industries that require large seed capital for establishing the business (such as steel) discourage new entrants that cannot invest this amount.

  • Switching costs

Customers may face some switching cost like having to buy new spare parts or train employees to run the new machine, in moving from one company to the other, thus discouraging movement of customers from existing players to new entrants.

  • Access to distribution

Established players may have access to the most efficient distribution channels. Distribution channel members may not tie up with new entrants who pose competition to their existing partners.

  • Expected retaliation

If existing players have large stakes in continuing their business (large investment, substantial revenues, strategic importance), or if they are dominant players, they would retaliate strongly to any new entrant.

  • Brand equity

Existing players have established product reputation and built a strong brand image over the years. New players would find it hard to convince customers to switch over to their offering. To incumbent competitors, industry attractiveness can be increased by raising entry barriers. In fact, one of the main objectives of existing players in the industry is to erect strong entry barriers to prevent new competitors from entering the industry.

  1. Bargaining Power of Suppliers

Strong bargaining power allows suppliers to sell higher priced or low quality raw materials to their buyers. This directly affects the buying firms’ profits because it has to pay more for materials. Suppliers have strong bargaining power when:

  • There are few suppliers but many buyers
  • Suppliers are large and threaten to forward integrate
  • Few substitute raw materials exist
  • Suppliers hold scarce resources
  • Cost of switching raw materials is especially high

Bargaining power of suppliers will be high when:

  • Many buyers and few sellers

There are many buyers and few dominant suppliers. Suppliers would be in a position to charge higher prices or cause instability in supply of essential products. The buyers should develop more suppliers by agreeing to invest in them and helping them with technologies.

  • Differentiated supplies

When suppliers offer differentiated and highly valued components, their bargaining power is higher, since the buyer cannot switch suppliers easily. When many suppliers offer a standardized product, their bargaining power reduces. The buyer should bring the processes that enable the supplier to make differentiated products in-house and buy only standard components from the supplier.

  • Crucial supplies

If the product sold by the supplier is a key component for the buyer, or it is crucial for its smooth operations, then the bargaining power of suppliers is higher. The buyer should always keep the production of key components with itself.

  • Forward integration

When there is a threat of forward integration into the industry by the suppliers, their bargaining power is higher. There is a strong threat of forward integration when the supplier supplies a very crucial part of the final product. The supplier of engines to an automobile maker is in a very strong position to contemplate making automobiles because it already has expertise over a key component of the final product.

  • Backward integration

When there is threat of backward integration by buyers, the bargaining power of suppliers becomes weaker, as the supplier may become redundant if the buyer starts making the same product. The buyer should always have an idea of the technologies that are being employed in making crucial and differentiated products and should be capable of putting together the resources to make these components. Suppliers should always understand that if the buyer is cornered, he will start making the components himself.

  • Level of dependence

When the industry is not a key customer group for suppliers, their bargaining power increases. Buyers are dependent on suppliers, though suppliers do not focus on the customer group. The suppliers can survive even when they stop supplying to the buyers as the major part of their business is coming from some other industry. The buyers should be careful in selecting their suppliers. They should select suppliers who have strong stake in the buyers’ industry and not those who only have peripheral interests in the buyers’ industry.

  1. Bargaining Power of Buyers

Buyers have the power to demand lower price or higher product quality from industry producers when their bargaining power is strong. Lower price means lower revenues for the producer, while higher quality products usually raise production costs. Both scenarios result in lower profits for producers. Buyers exert strong bargaining power when:

  • Buying in large quantities or control many access points to the final customer
  • Only few buyers exist
  • Switching costs to other supplier are low
  • They threaten to backward integrate
  • There are many substitutes
  • Buyers are price sensitive

Higher bargaining power of customers implies that they can seek greater compliance from the companies of the industry.

  • Few dominant customers

When there are few dominant customers and many sellers, customers can exercise greater choice. They also dictate terms and conditions to the supplier. This is true in industrial markets where many suppliers make standard components for a few Original Equipment Manufacturers. The OEMs are able to extract big concessions on price and coerce the suppliers to provide expensive services like just-in-time supplies. The suppliers have to agree to debilitating terms of the buyers if they have to continue to supply to them.

  • Non-differentiated products

If products sold by the players in the industry are standardized, or there are little differences among them, buyers can easily switch over to competitors, increasing their bargaining power. This is increasingly happening in consumer markets. Customers are not able to tell one manufacturer’s product from that of another. The result is that the customers are buying mostly on price and the manufacturers are reducing prices to lure customers.

The problem with such an approach is that with reduced profits, a company’s ability to differentiate its product further goes down. The manufacturer is caught in the spiral of low differentiation-low price-low profits- further low differentiation-further low prices-further low profits. The manufacturer has to break this chain and collect resources to differentiate its product so that it can fetch a higher price and profit.

  • Small proportion of customer’s total purchase

If the product offered by the firm is not important or critical for the customer, the bargaining power of customers is higher. The product may be of a relatively smaller value in the overall disposable income of the customer. This may work out to be to the advantage of the seller.

The customer will not be overly worried if the supplier raises its price by small amount as the slightly increased expenditure will not be a big dent in the income of the customer. As level of economic prosperity rises, manufacturers of packaged foods and other fast moving consumer goods can increase the quality and price of their products. Customers would not mind paying slightly higher prices for better products.

  • Backward integration

Customers may threaten to integrate backward into the industry, and compete with suppliers. This may be a reality in industrial markets but it is very rare in consumer markets. Most customers do not have the resources to start making what they buy.

  • Forward integration

Suppliers can threaten to integrate forward into customers’ industry. The customers have to understand and contain the imminent threat of competition from their suppliers. This threat is meaningless in consumer markets but the threat is real in industrial markets, particularly when the supplier is supplying a key component.

  • Key supplies

The industry is not a key supplying group for buyers. In consumer markets, one manufacturer supplies only a small fraction of his total purchases.

  1. Threat of Substitutes

This force is especially threatening when buyers can easily find substitute products with attractive prices or better quality and when buyers can switch from one product or service to another with little cost. For example, to switch from coffee to tea doesn’t cost anything, unlike switching from car to bicycle.

  • Buyer’s willingness to substitute

Buyers will substitute when the industry’s product is not strongly differentiated, so the buyers will not have developed strong preference for the product. In industrial markets, the product should be either enhancing value of the final product it becomes a part of, or is enhancing the operation of the buyer.

  •  Relative prices and performance of substitutes

If the substitute enhances the operation of the customer without incurring additional costs, substitute product would be preferred.

  • Costs of switching over to substitutes

In industrial markets, if a company has to buy another manufacturer’s product, the company will have to buy new spare parts and will have to train its operations and maintenance staff on the new machine.

The substitute products satisfy the same general need of the customer. The customer evaluates various aspects of the substitute products such as prices, quality, availability, ease of use etc. Relative substitutability of products varies among customers. The threat of substitute products depends on how sophisticated the needs of the buyers are, and how strongly entrenched their habits are. Some people will continue to drink coffee, and will never ever switch to drinking tea, no matter how costly coffee may become.

A company can lower threat of substitute products by building up switching costs, which may be monetary or psychological-by creating strong distinctive brand personalities and maintaining a price differential commensurate with perceived consumer value.

  1. Rivalry among existing competitors

This force is the major determinant on how competitive and profitable an industry is. In competitive industry, firms have to compete aggressively for a market share, which results in low profits. Rivalry among competitors is intense when:

  • There are many competitors
  • Exit barriers are high
  • Industry of growth is slow or negative
  • Products are not differentiated and can be easily substituted
  • Competitors are of equal size
  • Low customer loyalty

The intensity of rivalry between competitors depends on:

  • Structure of competition

An industry witnesses intense rivalry amongst its players, when it has large number of small companies or a few equally entrenched companies. An industry witnesses less rivalry when it has a clear market leader. The market leader is significantly larger than the industry’s second largest player, and it also has a low cost structure.

  • Structure of costs

In an industry which has high fixed costs, a player will cut price to attract competitors’ customers to fill capacity. A player may be willing to price just above its marginal cost, and since the industry’s marginal cost is low, it is not unusual to see price cuts of 50-70 per cent Such price cuts are almost always matched by competitors, because all of them are trying to fill capacity. The inevitable result is a price war.

  • Degree of differentiation

Players of an industry whose products are commoditized will essentially compete on price, and hence price cuts of a player will be swiftly matched by competitors, resulting in intense rivalry. But when players of an industry can differentiate their products, they understand that customers do not associate the industry’s products with a single price, and that the price of a product is dependent on its features, benefits and brand strength. Players of such an industry compete on features, benefits and brand strength, and hence rivalry is less intense. When a player cuts price, its competitor can react by adding more features, providing more benefits, or hiring a celebrity in its advertisements, instead of cutting price.

  • Switching costs

Switching cost is high when product is highly specialized, and when the customer has expended lot of resources and efforts to learn how to use it. Switching cost is also high when the customer has made investments that will become worthless if he uses any other product. Since a customer of a company is not likely to be lured by competitors’ price cuts and other manoeuvres, competitive rivalry is less in such an industry.

  • Strategic objectives

When competitors are pursuing build strategies, they will match the price cuts of a player because they do not want to lose market share to the player who has cut price. Therefore, rivalry will be intense. But when competitors are pursuing hold or harvest strategies, they will not be too keen to match the price cuts of a player, because they are more interested in profits than market share. Therefore, rivalry will be less intense.

  • Exit barriers

When players cannot leave an industry due to factors such as lack of opportunities elsewhere, high vertical integration, emotional barriers or high cost of closing down a plant, rivalry will be more intense. In such an industry, players will compete bitterly as they do not have the option to quit. But, when exit barriers are low, players who are not good enough, or who have found more attractive industries to enter, can exit. With fewer numbers of players in the industry now, rivalry will be less intense.

Although, Porter originally introduced five forces affecting an industry, scholars have suggested including the sixth force: complements. Complements increase the demand of the primary product with which they are used, thus, increasing firm’s and industry’s profit potential. For example, iTunes was created to complement iPod and added value for both products. As a result, both iTunes and iPod sales increased, increasing Apple’s profits.

McKinsey’s 7’s Framework, Elements, Scope, Steps

McKinsey’s 7-S Framework is a Management model developed in the 1980s by McKinsey consultants, including Tom Peters and Robert Waterman, to diagnose and organize a company effectively. It outlines seven interdependent factors that are categorized as either “hard” or “soft” elements: Strategy, Structure, and Systems are “hard” elements that are tangible and easier to identify. They refer to the actual processes and organizational arrangements necessary for operations. Shared Values, Skills, Style, and Staff are “soft” elements, often less tangible and influenced by culture. These components must be aligned for a company to achieve success. The framework is particularly useful for understanding organizational change and ensuring that all aspects of the organization work harmoniously towards common goals.

Elements of McKinsey’s 7’s Framework:

McKinsey’s 7-S Framework is a comprehensive model that breaks down the essential elements that organizations need to align for effective strategy implementation and organizational performance. Each element interacts with the others, making it crucial that they are all aligned when any change is made.

  1. Strategy:

The plan devised to maintain and build competitive advantage over the competition. It defines how the organization intends to achieve its goals.

  1. Structure:

The way the organization is structured and who reports to whom. This includes the organizational hierarchy, departmental setup, and reporting lines.

  1. Systems:

The daily activities and procedures that staff members engage in to get the job done. This includes all formal and informal procedures that govern everyday operations.

  1. Shared Values:

Originally called “Superordinate goals,” these are the core values of the company that are evident in the corporate culture and the general work ethic. This is the central element of the model that ties all other elements together.

  1. Skills:

Actual skills and competencies of the employees within the organization. It encompasses the capabilities and abilities that the workforce brings to their work engagements.

  1. Style:

Style of leadership adopted by the organization. This can refer to how key managers behave in achieving the organization’s goals, how decisions are made, and how leaders interact with their teams.

  1. Staff:

The employees and their general capabilities. It involves how the organization recruits, develops, and retains its staff.

Scope of McKinsey’s 7’s Framework:

  • Organizational Alignment and Change Management:

Helps in aligning departments and processes during a change. The framework ensures that all aspects of the organization are harmonized to support the change, making it ideal for managing mergers, acquisitions, or any major organizational restructuring.

  • Strategy Development and Implementation:

Facilitates a holistic view of the organization when planning and implementing strategies. It ensures that the strategy is supported across all seven elements for effective execution.

  • Performance Improvement:

Assists in identifying areas of improvement by examining the interactions between the elements. Organizations can use the framework to pinpoint why certain areas are underperforming and what can be optimized.

  • Organizational Design and Structure:

Guides the design or restructuring of an organization’s architecture by considering how various elements like structure, systems, and staff need to interrelate.

  • Integration of New Processes or Technology:

Supports the integration of new technology or processes by checking alignment across the elements to ensure that the adoption is seamless and enhances operational effectiveness.

  • Cultural Assessment and Development:

Helps in understanding and evolving an organization’s culture. By analyzing shared values, style, and staff, leaders can better cultivate a culture that supports the organization’s goals.

  • Leadership Development and Team Building:

Useful in developing leadership styles and team dynamics that are congruent with achieving organizational objectives. It examines how leadership (style) and team capabilities (staff) align with the overall strategy.

  • Corporate Diagnostics:

Acts as a diagnostic tool to assess the health of the organization across multiple dimensions, identifying misalignments that could hinder performance and suggesting areas for improvement.

Steps of McKinsey’s 7’s Framework:

  • Identify the Objective:

Start by clarifying what you want to achieve with the framework. This could be to facilitate a merger, support a new strategy, or improve organizational efficiency.

  • Assess Current State:

Collect data and analyze each of the seven elements (Strategy, Structure, Systems, Shared Values, Skills, Style, Staff) to understand their current state. This assessment should identify how each element is currently aligned with the others.

  • Compare Against Desired State:

Define the ideal state for each of the seven elements aligned with the organizational goals and objectives. This involves outlining how you ideally want each element to operate and interact with the others.

  • Identify Gaps and Inconsistencies:

Compare the current state with the desired state to identify discrepancies and areas that require change. This gap analysis will highlight where changes are needed and what those changes should involve.

  • Develop Action Plans:

Based on the gaps identified, create detailed action plans for each of the seven elements. These plans should specify what needs to be changed, how the change should be implemented, who will be responsible, and by when these changes should be completed.

  • Implement Changes:

Execute the action plans, ensuring that changes in one element are complemented by and supportive of changes in the others. This step may involve restructuring, retraining staff, changing management practices, or updating systems and processes.

  • Monitor and Adjust:

Continuously monitor the effects of these changes and evaluate how they are impacting the organization. Use feedback to adjust elements and further refine strategies and operations. This step ensures that the organization remains aligned with its strategic objectives and can adapt to new challenges or opportunities.

  • Review and Reinforce:

Regularly review the entire framework and reinforce the changes made. This may involve ongoing training, repeated assessments, and recalibrations of strategies and structures to ensure long-term alignment and success.

Implementation: Meaning and Steps

Strategy implementation is the translation of chosen strategy into organizational action so as to achieve strategic goals and objectives. Strategy implementation is also defined as the manner in which an organization should develop, utilize, and amalgamate organizational structure, control systems, and culture to follow strategies that lead to competitive advantage and a better performance. Organizational structure allocates special value developing tasks and roles to the employees and states how these tasks and roles can be correlated so as maximize efficiency, quality, and customer satisfaction-the pillars of competitive advantage. But, organizational structure is not sufficient in itself to motivate the employees.

Strategic implementation is critical to a company’s success, addressing the who, where, when, and how of reaching the desired goals and objectives. It focuses on the entire organization. Implementation occurs after environmental scans, SWOT analyses, and identifying strategic issues and goals. Implementation involves assigning individuals to tasks and timelines that will help an organization reach its goals.

An organizational control system is also required. This control system equips managers with motivational incentives for employees as well as feedback on employees and organizational performance. Organizational culture refers to the specialized collection of values, attitudes, norms and beliefs shared by organizational members and groups.

Following are the main steps in implementing a strategy:

  • Developing an organization having potential of carrying out strategy successfully.
  • Disbursement of abundant resources to strategy-essential activities.
  • Creating strategy-encouraging policies.
  • Employing best policies and programs for constant improvement.
  • Linking reward structure to accomplishment of results.
  • Making use of strategic leadership.

Steps in Strategy Implementation

To ensure an effective and successful implementation of strategies, it’s a good idea to have a system to go about it. Take a look at the steps to ensure that happens.

Step 1: Evaluation and communication of the Strategic Plan

The strategic plan, which was developed during the Strategy Formulation stage, will be distributed for implementation. However, there is still a need to evaluate the plan, especially with respect to the initiatives, budgets and performance. After all, it is possible that there are still inputs that will crop up during evaluation but were missed during strategy formulation.

There are several sub-steps to be undertaken in this step.

(a) Align the strategies with the initiatives

First things first, check that the strategies on the plan are following the same path leading to the mission and strategic goals of the organization.

(b) Align budget to the annual goals and objectives

Financial assessments conducted prior will provide an insight on budgetary issues. You have to evaluate how these budgetary issues will impact the attainment of objectives, and see to it that the budget provides sufficient support for it. In the event that there are budgetary constraints or limitations, they must first be addressed before launching fully into implementation mode.

(c) Communicate and clarify the goals, objectives and strategies to all members of the organization

Regardless of their position in the organization’s hierarchy, everyone must know and understand the goals and objectives of the organization, and the strategies that will be employed to achieve them.

Step 2: Development of an implementation structure

The next step is to create a vision, or a structure, that will serve as a guide or framework for the implementation of strategies.

  • Establish a linking or coordination mechanism between and among the various departments and their respective divisions and units. This is mainly for purposes of facilitating the delegation of authority and responsibility.
  • Formulate the work plans and procedures to be followed in the implementation of the tactics in the strategies.
  • Determine the key managerial tasks and responsibilities to be performed, and the qualifications required of the person who will perform them.
  • Determine the key operational tasks and responsibilities to be performed, and the qualifications required of the person who will perform them.
  • Assign the tasks to the appropriate departments of the organization.
  • Evaluate the current staffing structure, checking if you have enough manpower, and if they have the necessary competencies to carry out the tasks. This may result to some reorganization or reshuffling of people. In some cases, it may also require additional training for current staff members, or even hiring new employees with the required skills and competencies. This is also where the organization will decide if it will outsource some activities instead.
  • Communicate the details to the members of the organization. This may be in the form of models, manuals or guidebooks.

Step 3: Development of implementation-support policies and programs

Some call them “strategy-encouraging policies” while others refer to them as “constant improvement programs”. Nonetheless, these are policies and programs that will be employed in aid of implementation.

(a) Establish a performance tracking and monitoring system

This will be the basis of evaluating the progress of the implementation of strategies, and monitoring the rate of accomplishment of results, or if they were accomplished at all. Define the indicators for measuring the performance of every employee, of every unit or section, of every division, and of every department.

(b) Establish a performance management system

Quite possibly, the aspect of performance management that will encourage employee involvement is a recognition and reward structure. When creating the reward structure, make sure that it has a clear and direct link to the accomplishment of results, which will be indicated in the performance tracking and monitoring system.

(c) Establish an information and feedback system

Establish an information and feedback system that will gather feedback and results data, to be used for strategy evaluation later on.

Again, communicate these policies and programs to the members of the organization.

Step 4: Budgeting and allocation of resources

It is now time to equip the implementors with the tools and other capabilities to perform their tasks and functions.

  • Allocate the resources to the various departments, depending on the results of financial assessments as to their budgetary requirements.
  • Disburse the necessary resources to the departments, and make sure everything is properly and accurately documented.
  • Maintain a system of checks and balances to monitor whether the departments are operating within their budgetary limits, or they have gone above and beyond their allocation.

Step 5: Discharge of functions and activities

It is time to operationalize the tactics and put the strategies into action, aided by strategic leadership, utilizing participatory management and leadership styles.

Throughout this step, the organization should also ensure the following:

  • Continuous engagement of personnel by providing trainings and reorientations.
  • Enforce the applicable control measures in the performance of the tasks.
  • Evaluate performance at every level and identify performance gaps, if any, to enable adjusting and corrective actions. It is possible that the corrective actions may entail changes in the policies, programs and structures established and set in earlier steps. That’s all right. Make the changes when necessary.

Basically, the results or accomplishments in Step 5 will be the input in the next step, which is the third stage of Strategic Management: “strategy evaluation”.

Some argue that implementation of strategies is more important than the strategies themselves. But this is not about taking sides or weighing and making comparisons, especially considering how these two are important stages in Strategic Management. Thus, it is safe to say that formulating winning strategies is just half the battle, and the other half is their implementation.

Implementation at Project

In project implementation or project execution, we put it all together. Project planning is complete, as detailed as possible, yet providing enough flexibility for necessary changes. In a customer-contractor relationship, the contract is signed, based on the right decisions about the contract structures, and including clauses for change and claim management.

  1. Prepare the infrastructure

Many solutions are implemented into a production environment that is separate and distinct from where the solution was developed and tested. It is important that the characteristics of the production environment be accounted for. This strategy includes a review of hardware, software, communications, etc. In our example above, the potential desktop capacity problem would have been revealed if we had done an evaluation of the production (or real-world) environment. When you are ready for implementation, the production infrastructure needs to be in place.

  1. Coordinate with the organizations involved in implementation

This may be as simple as communicating to your client community. However, few solutions today can be implemented without involving a number of organizations. For IT solutions, there are usually one or more operations and infrastructure groups that need to be communicated to ahead of time. Many of these groups might actually have a role in getting the solution successfully deployed. Part of the implementation work is to coordinate the work of any other groups that have a role to play. In some cases, developers simply failed to plan ahead and make sure the infrastructure groups were prepared to support the implementation. As a result, the infrastructure groups were forced to drop everything to make the implementation a success.

  1. Implement training

Many solutions require users to attend training or more informal coaching sessions. This type of training could be completed in advance, but the further out the training is held, the less information will be retained when implementation rolls around. Training that takes place close to the time of implementation should be made part of the actual implementation plan.

  1. Install the production solution

This is the piece everyone remembers. Your solution needs to be moved from development to test. If the solution is brand new, this might be finished in a leisurely and thoughtful manner over a period of time. If this project involves a major change to a current solution, you may have a lot less flexibility in terms of when the new solution moves to production, since the solution might need to be brought down for a period of time. You have to make sure all of your production components are implemented successfully, including new hardware, databases, and program code.

  1. Convert the data

Data conversion, changing data from one format to another, needs to take place once the infrastructure and the solution are implemented.

  1. Perform final verification in production

You should have prepared to test the production solution to ensure everything is working as you expect. This may involve a combination of development and client personnel. The first check is just to make sure everything is up and appears okay. The second check is to actually push data around in the solution, to make sure that the solution is operating as it should. Depending on the type of solution being implemented, this verification step could be extensive.

  1. Implement new processes and procedures

Many IT solutions require changes to be made to business processes as well. These changes should be implemented at the same time that the actual solution is deployed.

  1. Monitor the solution

Usually the project team will spend some period of time monitoring the implemented solution. If there are problems that come up immediately after implementation, the project team should address and fix them.

error: Content is protected !!