Risk and Return of a Single Asset

The typical object of investment is to make current income from investments in the form of dividends and interest income. The investments should earn reasonable and expected rate of return on investments. Certain investments like bank deposits, public deposits, debentures, bonds etc. will carry a fixed rate of return payable periodically.

In case of investments in shares of companies, the periodical payments in the form of dividends are not assured, but it may ensure higher returns than fixed income investments. But the investments in equity shares of companies carry higher risk than fixed income instruments.

Another form of return is in the form of capital appreciation. This element of return is the difference between the purchase price and the price at which the asset can be sold, it can be a capital gain or capital loss arising due to change in the price of the investment.

The rate of return of a particular investment is calculated as follows:

Annual Rate of Return:

The annual rate of return of a particular investment can be calculated as follows:

R = {D1+(P1-P0)}/P0

Were,

R = Annual rate of return of a share

D1 = Dividend paid at the end of the year

P0 = Market price of share at the beginning of the year

P1 = Market price of share at the end of the year

The above formula is used for calculation of annual return of an investment in shares. In the above formula, D1/P0 represents dividend yield and (P1 – P0)/P0 represents capital gain or loss.

Average Rate of Return:

The rate of return can also be calculated for a period more than one year. The average rate of return represents the average of annual rates of return over a period of years.

The formula used for calculation of average rate of return is given below:

R̅ = 1/n (R1+R2+…. +Rn)

Where, R̅ = Average rate of return

R1, R2 …..Rn = Annual rate of return in period 1, 2,…..

n = Total number of periods

Risk on Single Asset:

The concept of risk is more difficult to quantify. Statistically we can express risk in terms of standard deviation of return. For example, in case of gilt edged security or government bonds, the risk is nil since the return does not vary – it is fixed. But strictly speaking if we consider inflation and calculate real rate of return (inflation adjusted) we find that even government bonds have some amount of risk since the rate of inflation may vary.

Return from unsecured fixed deposits appear to have zero variability and hence zero risk. But there is a risk of default of interest as well as the principal. In such case the rate of return can be negative. Hence, this investment has high risk though apparently it carries zero risk. For other investments like shares, business etc., where the rate of return is not fixed, there may be a schedule of return with associated probability for each rate of return.

The mean of the probable returns gives the expected rate of return and the standard deviation or variance which is square of standard deviation measures risk. Higher the range of the probable return, higher the standard deviation and hence higher the risk. A risk averse investor will look for return where the range is low. Hence, low standard deviation means low risk.

The problem in portfolio management is to minimize the standard deviation without sacrificing expected rate of return. This is possible by diversification. Risk is measured in terms of variability of returns. If Investment ‘A’ and Investment ‘B’ whose mean rate of return is same as shown in figure 3.9.

Variability of Return

The returns of Investment ‘A’ show more variability than Investment ‘B’. In view of the variability of returns, Investment ‘A’ is riskier, even though both the investments are having the same mean returns.

Types of Risks

Risk is the probability that actual results will differ from expected results. In the Capital Asset Pricing Model (CAPM), risk is defined as the volatility of returns. The concept of “risk and return” is that riskier assets should have higher expected returns to compensate investors for the higher volatility and increased risk.

  1. Reputation Risk

There has always been the risk that an unhappy customer, product failure, negative press or lawsuit can adversely impact a company’s brand reputation. However, social media has amplified the speed and scope of reputation risk. Just one negative tweet or bad review can decrease your customer following and cause revenue to plummet.

To prepare for this risk, leverage reputation management strategies to regularly monitor what others are saying about the company online and offline. Be ready to respond to those comments and help address any concerns immediately. Keep quality top of mind to avoid lawsuits and product failures that can also damage your company’s reputation.

  1. Operational Risk

This business risk can happen internally, externally or involve a combination of factors. Something could unexpectedly happen that causes you to lose business continuity.

That unexpected event could be a natural disaster or fire that damages or destroys your physical business. Or, it might involve a server outage caused by technical problems, people, or power cut. Many operational risks are also people-related. An employee might make mistakes that cost time and money.

Whether it’s a people or process failure, these operational risks can adversely impact your business in terms of money, time and reputation. Address each of these potential operational risks through training and a business continuity plan. Both tactics provide a way to think about what could go wrong and establish a backup system or proactive measures to ensure operations aren’t affected.

  1. Economic Risk

The economy is constantly changing as the markets fluctuate. Some positive changes are good for the economy, which lead to booming purchase environments, while negative events can reduce sales. It’s important to watch changes and trends to potentially identify and plan for an economic downturn.

To counteract economic risk, save as much money as possible to maintain a steady cash flow. Also, operate with a lean budget with low overhead through all economic cycles as part of your business plan.

  1. Compliance Risk

Business owners face an abundance of laws and regulations to comply with. For example, recent data protection and payment processing compliance could impact how you handle certain aspects of your operation. Staying well versed in applicable laws from federal agencies like the Occupational Safety and Health Administration (OSHA) or the Environmental Protection Agency (EPA) as well as state and local agencies can help minimize compliance risks.

  1. Competition (or Comfort) Risk

While a business may be aware that there is always some competition in their industry, it’s easy to miss out on what businesses are offering that may appeal to your customers.

In this case, the business risk involves a company leader becoming so comfortable with their success and the status quo that they don’t look for ways to pivot or make continual improvements. Increasing competition combined with an unwillingness to change may result in a loss of customers.

Enterprise risk management means a company must continually reassess their performance, refine their strategy, and maintain strong, interactive relationships with their audience and customers. Additionally, it’s important to keep an eye on the competition by regularly researching how they use online and social media channels.

  1. Security and Fraud Risk

As more customers use online and mobile channels to share personal data, there are also greater opportunities for hacking. News stories about data breaches, identity theft and payment fraud illustrate how this type of risk is growing for businesses.

Not only does this risk impact trust and reputation, but a company is also financially liable for any data breaches or fraud. To achieve effective enterprise risk management, focus on security solutions, fraud detection tools and employee and customer education about how to detect any potential issues.

  1. Financial Risk

This business risk may involve credit extended to customers or your own company’s debt load. Interest rate fluctuations can also be a threat.

Making adjustments to your business plan will help you avoid harming cash flow or creating an unexpected loss. Keep debt to a minimum and create a plan that will start lowering that debt load as soon as possible. If you rely on all your income from one or two clients, your financial risk could be significant if one or both no longer use your services. Start marketing your services to diversify your base so the loss of one won’t devastate your bottom line.

Causes of Risk

Business risk refers to a threat to the company’s ability to achieve its financial goals. In business, risk means that a company’s or an organization’s plans may not turn out as originally planned or that it may not meet its target or achieve its goals.

Such risks cannot always be blamed on the owner of the company, as risk can be influenced by various external factors, which may include rising prices of raw materials for production, growing competition, or changes or additions to existing government regulations.

Factors responsible for causing risks in investment

  1. Demand and supply forces

In securities market, the role played by the demand and supply forces is very vital. When they cannot be properly predicted, then the security prices will show wide variations. Fluctuations in prices make the securities risky.

  1. Maturity period

If investments have a longer maturity period, then they will invite more risks because of the duration of the investment.

  1. Security

Investment may be secured or unsecured. If the investment is secured by collateral securities, then the risk will be less.

  1. Unsatisfactory credit worthiness of the issuer

Generally, the securities of Government and semi-government bodies are having a high degree of credit worthiness. But securities issued by the companies in the private sector do not command much credit worthiness. In situations where the credit worthiness of the issuer is not satisfactory, risks are bound to arise.

  1. Selection of the highly risky investment instruments

There is different nature of investments such as corporate shares or bonds, chit funds, Nidhis, Benefit funds, etc. These investments are considered to be highly risky as they relate to the unorganized sector. But some instruments like bank deposits, post office certificates like National saving certificates, Kisan Vikas Patras, etc, are less risky. Because these instruments ensure certainty of payment of interest and principal.

  1. Incorrect decision taken with regard to investment

In investments, what to buy and sell are the main decisions to be made. The decision to buy or sell depends upon the estimation of the fair intrinsic value of the shares, over valuation or under valuation of the share and also a number of other factors. Any mistake committed while making an investment decision, therefore, causes considerable risk in investment.

  1. Failure to judge the correct timing of investment

The most important factor in the investment programme is the timing of purchase or sale of securities. The prices of stock fluctuate with each stock having its own cycle of fluctuations. If the investor is able to forecast these price changes, he is in a position to make a higher profit.

In boom periods, the prices of stock rise and during depression they fall. An analysis of the price behavior of the individual scrip will help to locate the buy and sell points.

  1. Amount of investment

Investing a huge amount in a particular security is quite risky. The higher the amount invested in any security, more will be the risk. On the other hand, judicious mix of investments in small quantities may be ideal.

  1. Nature of Business

Selection of a risky industry for investment is only inviting the trouble. As any business is prone to ups and downs, its prosperity should not be taken for granted. Any unfavorable trend in the industry will affect the company also.

  1. Terms of lending

Terms of lending such as periodicity of servicing, redemption periods, etc., are the factors which cause risk in the investment concerned.

  1. National and international factors

In the days of sophisticated means of communication, even the changes taking place in foreign markets influence the markets of other parts of world. Similarly, changes in conditions within the country are quickly reflected in security prices. So, national and international factors cause risk in investment.

Meaning of Risk, Risk Vs Uncertainty

Risk, in the context of finance and investment, refers to the uncertainty regarding the financial returns or outcomes of an investment, and the potential for an investor to experience losses or gains different from what was initially expected. It is a fundamental concept that underpins nearly all financial decisions and strategies. The essence of risk is the variability of returns, which can be influenced by a myriad of factors, including economic changes, market volatility, political instability, and specific events affecting individual companies or industries.

Dimensions and Types of Risk:

  • Market Risk (Systematic Risk):

This type of risk affects all investments to some degree because it is linked to factors that impact the entire market, such as economic recessions, interest rate changes, political turmoil, and natural disasters. Market risk is inherent and cannot be eliminated through diversification.

  • Credit Risk (Default Risk):

Credit risk arises when there is a possibility that a borrower will default on their debt obligations, leading to losses for the lender. It is a significant consideration in bond investing and lending activities.

  • Liquidity Risk:

Liquidity risk refers to the potential difficulty in buying or selling an asset without causing a significant movement in its price. Investments in thinly traded or illiquid markets are particularly susceptible to this risk.

  • Operational Risk:

This risk stems from internal processes, people, and systems, or from external events that could disrupt a company’s operations. It includes risks from business operations, fraud, legal risks, and environmental risks.

  • Country and Political Risk:

Investments across different countries are subject to risks from political instability, changes in government policy, taxation laws, and currency fluctuations.

  • Interest Rate Risk:

This is the risk that changes in interest rates will affect the value of fixed-income securities. Generally, as interest rates rise, the value of fixed-income securities falls, and vice versa.

Risk is quantified and managed through various statistical measures and techniques, such as standard deviation, beta, value at risk (VaR), and stress testing. These measures help investors and managers understand the volatility of investments and the potential for losses.

Understanding and managing risk is crucial for achieving investment objectives. While risk cannot be completely avoided, it can be managed and mitigated through strategies such as diversification, asset allocation, and hedging. Diversification, for instance, involves spreading investments across various asset classes and securities to reduce the impact of any single investment’s poor performance on the overall portfolio.

Investors’ attitudes towards risk, known as risk tolerance, vary widely. Some are risk-averse, preferring investments with lower returns but less variability in returns. Others are more risk-tolerant, willing to accept higher volatility for the chance of higher returns. Identifying one’s risk tolerance is a critical step in developing an investment strategy that aligns with one’s financial goals and comfort level with uncertainty.

Uncertainty

Uncertainty refers to situations where the outcomes, probabilities, or implications of events are unknown or cannot be precisely quantified. It permeates various aspects of life and decision-making, especially prominent in economics, finance, and strategic planning. In these contexts, uncertainty arises due to incomplete information about the future, unpredictability of external factors, or complexity in underlying systems. Unlike risk, which can often be measured or assigned probabilities based on historical data or models, uncertainty defies precise calculation, making it challenging for individuals and organizations to make informed decisions.

In financial markets, uncertainty can stem from volatile economic conditions, political instability, or unforeseen global events, leading to erratic market behaviors. For businesses, strategic uncertainty might arise from unpredictable consumer preferences, technological innovation, or regulatory changes. The presence of uncertainty requires flexibility, robust contingency planning, and sometimes, a tolerance for making decisions without clear outcomes. Coping strategies include diversification, scenario planning, and maintaining liquidity. Understanding that uncertainty is an inherent part of decision-making processes is crucial, as it encourages the development of adaptive strategies and resilience in the face of the unknown.

Risk Vs. Uncertainty

Aspect Risk Uncertainty
Nature Quantifiable Not quantifiable
Probability Measurable Not measurable
Information Available Insufficient or unavailable
Decision-making Based on probabilities Often based on judgment
Predictability Higher Lower
Management Possible through diversification Requires contingency planning
Outcome Potential for estimation Outcomes unknown
Economic Models Often applicable Less applicable
Financial Tools Risk assessment tools available Limited tools for measurement
Investment Strategy Can be optimized More reliant on flexibility
Impact on planning Can be incorporated into plans Plans must allow for adjustments
Example Market risk, credit risk Political instability, technological innovation

Investment Vs Speculation

Investment

Investment refers to the acquisition of the asset, in the expectation of generating income. In a wider sense, it refers to the sacrifice of present money or other resources for the benefits that will arise in future. The two main element of investment is time and risk

Nowadays, there is a range of investment options available in the market as you can deposit money in the bank account, or you can acquire property, or purchase shares of the company, or invest your money in government bonds or contribute in the funds like EPF or PPF.

Investments are majorly divided into two categories i.e. fixed income investment and variable income investment. In fixed income investment there is a pre-specified rate of return like bonds, preference shares, provident fund and fixed deposits while in variable income investment, the return is not fixed like equity shares or property.

Speculation

Speculation is a trading activity that involves engaging in a risky financial transaction, in expectation of making enormous profits, from fluctuations in the market value of financial assets. In speculation, there is a high risk of losing maximum or all initial outlay, but it is offset by the probability of significant profit. Although, the risk is taken by speculators is properly analysed and calculated.

Speculation ca be seen in markets where the high fluctuations in the price of securities such as the market for stocks, bonds, derivatives, currency, commodity futures, etc.

An Investment is an asset acquired with the intent of generating income or appreciation in the future, whereas Speculation is a financial transaction that has a substantial risk of losing all value, but with the expectation of a significant gain.

Investors and traders take on calculated risk as they attempt to profit from transactions they make in the markets. The level of risk undertaken in the transactions is the main difference between investing and speculating.

Whenever a person spends money with the expectation that the endeavor will return a profit, they are investing. In this scenario, the undertaking bases the decision on a reasonable judgment made after a thorough investigation of the soundness that the endeavor has a good probability of success.

But what if the same person spends money on an undertaking that shows a high probability of failure? In this case, they are speculating. The success or failure depends primarily on chance, or on uncontrollable (external) forces or events.

The primary difference between investing and speculating is the amount of risk undertaken. High-risk speculation is typically akin to gambling, whereas lower-risk investing uses a basis of fundamentals and analysis.

As per Benjamin Graham, an American economist, and professional investor, investment is an activity, which upon complete analysis assures the safety of the amount invested and adequate return. Conversely, speculation is an activity which does not satisfy these requirements.

The basic distinguishing point amidst these two is that income in the investment is consistent, but in the case of speculation is inconsistent. So this article makes an attempt to clear the differences between investment and speculation.

Investment vs Speculation: They can be compared on the basis of 4 major criteria’s they are:

  • Time Horizon
  • Risk Levels
  • Decision Criteria
  • Investors Attitude
  1. Time Horizon

Investment are generally held for a long term this may range from 2-5 years or more than that whereas speculation is held for a very short time span this is basically less than a year.

  1. Risk Levels

The amount of risk is relatively moderate in investment when compared with speculation. Speculation generally involves greater risk than investing like options, futures, financial derivatives and similar financial instruments. Speculators ofter tent to be looking for a larger and quicker payout than long-term investors. Both involve risk but as the things move fast in speculations it is riskier than investing.

  1. Decision Criteria

Investors tend to have a more basic fundamental approach whereas speculators, on the other hand, focus more on trends, market or investors psychology, they usually focus on these factors for a booking a quick profit.

  1. Investors Attitude

Investors mostly have cautious and conservative considering their risk appetite, they know their capability and invest as per the risk that they can absorb, in case of speculator they are more aggressive with a high-risk appetite.

Differences

  1. Investment refers to the purchase of an asset with the hope of getting returns. The term speculation denotes an act of conducting a risky financial transaction, in the hope of substantial profit.
  2. In investment, the decisions are taken on the basis of fundamental analysis, i.e. performance of the company. On the other hand, in speculation decisions are based on hearsay, technical charts, and market psychology.
  3. The quantity of risk is moderate in investment and high in case of speculation.
  4. Investments are held for at least one year. Hence, it has a longer time horizon than speculation, where speculators hold assets for short term only.
  5. The investors, expect profit from the change in the value of the asset. As opposed to speculators who expect profit from the change in the prices, due to demand and supply forces.
  6. An investor expects the modest rate of return on the investment. On the contrary, a speculator expects higher profits from the speculation in exchange for the risk borne by him.
  7. The investor uses his own funds for investment purposes. Conversely, speculator uses borrowed capital for speculation.
  8. In speculation, the stability of income is absent it is uncertain and erratic which is not in the case of investment.
  9. The psychological attitude of investors is conservative and cautious. In contrast, speculators are daring and careless.

Objectives of Investment Management

An investment is essentially an asset that is created with the intention of allowing money to grow. The wealth created can be used for a variety of objectives such as meeting shortages in income, saving up for retirement, or fulfilling certain specific obligations such as repayment of loans, payment of tuition fees, or purchase of other assets.

Investment may generate income for you in two ways. One, if you invest in a saleable asset, you may earn income by way of profit. Second, if Investment is made in a return generating plan, then you will earn an income via accumulation of gains. In this sense, ‘what is investment’ can be understood by saying that investments are all about putting your savings into assets or objects that become worth more than their initial worth or those that will help produce an income with time.

Objectives of Investment

Before you decide to invest your earnings in any one of the many investment plans available in India, it’s essential to understand the reasons behind investing. While the individual objectives of investment may vary from one investor to another, the overall goals of investing money may be any one of the following reasons.

  1. To Meet your Financial Goals

Investing can also help you achieve your short-term and long-term financial goals without too much stress or trouble. Some investment options, for instance, come with short lock-in periods and high liquidity. These investments are ideal instruments to park your funds in if you wish to save up for short-term targets like funding home improvements or creating an emergency fund. Other investment options that come with a longer lock-in period are perfect for saving up for long-term goals.

  1. To Help Money Grow

Another common objective of investing money is to ensure that it grows into a sizable corpus over time. Capital appreciation is generally a long-term goal that helps people secure their financial future. To make the money you earn grow into wealth, you need to consider investment options that offer a significant return on the initial amount invested. Some of the best investments to achieve growth include real estate, mutual funds, commodities, and equity. The risk associated with these options may be high, but the return is also generally significant.

  1. To Minimize the Burden of Tax

Aside from capital growth or preservation, investors also have another compelling incentive to consider certain investments. This motivation comes in the form of tax benefits offered by the Income Tax Act, 1961. Investing in options such as Unit Linked Insurance Plans (ULIPs), Public Provident Fund (PPF), and Equity Linked Savings Schemes (ELSS) can be deducted from your total income. This has the effect of reducing your taxable income, thereby bringing down your tax liability.

  1. To Keep Money Safe

Capital preservation is one of the primary reasons people invest their money. Some investments help keep hard-earned money safe from being eroded with time. By parking your funds in these instruments or schemes, you can ensure that you don’t outlive your savings. Fixed deposits, government bonds, and even an ordinary savings account can help keep your money safe. Although the return on investment may be lower here, the objective of capital preservation is easily met.

  1. To Earn a Steady Stream of Income

Investments can also help you earn a steady source of secondary (or primary) income. Examples of such investments include fixed deposits that pay out regular interest or stocks of companies that pay investors dividends consistently. Income-generating investments can help you pay for your everyday expenses after you’ve retired. Alternatively, they can also act as excellent sources of supplementary income during your working years by providing you with additional money to meet outlays like college expenses or EMIs.

  1. To Save up for Retirement

Saving up for retirement is a necessity. It’s essential to have a retirement fund you can fall back on in your golden years, because you may not be able to continue working forever. Additionally, it would be unfair to depend on your children to support you later in life, particularly if they have children of their own to raise. By investing the money you earn during your working years in the right investment options, you can allow your funds to grow enough to sustain you after you’ve retired.

Investment Management

The word “investment” can be defined in many ways according to different theories and principles. It is a term that can be used in a number of contexts. However, the different meanings of “investment” are more alike than dissimilar. Generally, investment is the application of money for earning more money. Investment also means savings or savings made through delayed consumption. According to economics, investment is the utilization of resources in order to increase income or production output in the future.

An amount deposited into a bank or machinery that is purchased in anticipation of earning income in the long run is both examples of investments. Although there is a general broad definition to the term investment, it carries slightly different meanings to different industrial sectors.

According to economists, investment refers to any physical or tangible asset, for example, a building or machinery and equipment. On the other hand, finance professionals define an investment as money utilized for buying financial assets, for example stocks, bonds, bullion, real properties, and precious items.

According to finance, the practice of investment refers to the buying of a financial product or any valued item with anticipation that positive returns will be received in the future. The most important feature of financial investments is that they carry high market liquidity. The method used for evaluating the value of a financial investment is known as valuation. According to business theories, investment is that activity in which a manufacturer buys a physical asset, for example, stock or production equipment, in expectation that this will help the business to prosper in the long run.

Types of investments

Investments may be classified as financial investments or economic investments. In Finance investment is putting money into something with the expectation of gain that upon thorough analysis has a high degree of security for the principal amount, as well as security of return, within an expected period of time. In contrast putting money into something with an expectation of gain without thorough analysis, without security of principal, and without security of return is speculation or gambling. Investment is related to saving or deferring consumption. Investment is involved in many areas of the economy, such as business management and finance whether for households, firms, or governments.

Economic investments are undertaken with an expectation of increasing the current economy’s capital stock that consists of goods and services. Capital stock is used in the production of other goods and services desired by the society. Investment in this sense implies the expectation of formation of new and productive capital in the form of new constructions, plant and machinery, inventories, and so on. Such investments generate physical assets and also industrial activity. These activities are undertaken by corporate entities that participate in the capital market.

Financial investments and economic investments are, however, related and dependent. The money invested in financial investments is ultimately converted into physical assets. Thus, all investments result in the acquisition of some asset, either financial or physical. In this sense, markets are also closely related to each other. Hence, the perfect financial market should reflect the progress pattern of the real market since, in reality, financial markets exist only as a support to the real market.

Nature of investment

The features of economic and financial investments can be summarized as return, risk, safety, and liquidity.

Return

All investments are characterized by the expectation of a return. In fact, investments are made with the primary objective of deriving a return.

The return may be received in the form of yield plus capital appreciation.

The difference between the sale price and the purchase price is capital appreciation.

The dividend or interest received from the investment is theyield.

The return from an investment depends upon the nature of the investment, the maturity period and a host of other factors.

Return = Capital Gain + Yield (interest, dividend etc.)

  1. Risk

Risk refers to the loss of principal amount of an investment. It is one of the major characteristics of an investment.

The risk depends on the following factors:

The investment maturity period is longer; in this case, investor will take larger risk.

Government or Semi Government bodies are issuing securities which have less risk.

In the case of the debt instrument or fixed deposit, the risk of above investment is less due to their secured and fixed interest payable on them. For instance debentures.

In the case of ownership instrument like equity or preference shares, the risk is more due to their unsecured nature and variability of their return and ownership character.

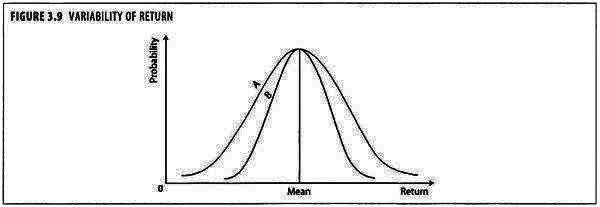
The risk of degree of variability of returns is more in the case of ownership capital compare to debt capital.

The tax provisions would influence the return of risk.

  1. Safety:

Safety refers to the protection of investor principal amount and expected rate of return.

Safety is also one of the essential and crucial elements of investment. Investor prefers safety about his capital. Capital is the certainty of return without loss of money or it will take time to retain it. If investor prefers less risk securities, he chooses Government bonds. In the case, investor prefers high rate of return investor will choose private Securities and Safety of these securities is low.

  1. Liquidity:

Liquidity refers to an investment ready to convert into cash position. In other words, it is available immediately in cash form. Liquidity means that investment is easily realizable, saleable or marketable. When the liquidity is high, then the return may be low. For example, UTI units. An investor generally prefers liquidity for his investments, safety of funds through a minimum risk and maximization of return from an investment.

 Four main investment objectives cover how you accomplish most financial goals. These investment objectives are important because certain products and strategies work for one objective, but may produce poor results for another objective. It is quite likely you will use several of these investment objectives simultaneously to accomplish different objectives without any conflict. Let’s examine these objectives and see how they differ.

Capital Appreciation

Capital appreciation is concerned with long-term growth. This strategy is most familiar in retirement plans where investments work for many years inside a qualified plan. However, investing for capital appreciation is not limited to qualified retirement accounts. If this is your objective, you are planning to hold the stocks for many years. You are content to let them grow within your portfolio, reinvesting dividends to purchase more shares. A typical strategy employs making regular purchases. You are not very concerned with day-to-day fluctuations, but keep a close eye on the fundamentals of the company for changes that could affect long-term growth.

Current Income

If your objective is current income, you are most likely interested in stocks that pay a consistent and high dividend. You may also include some top-quality real estate investment trusts (REITs) and highly-rated bonds. All of these products produce current income on a regular basis. Many people who pursue a strategy of current income are retired and use the income for living expenses. Other people take advantage of a lump sum of capital to create an income stream that never touches the principal, yet provides cash for certain current needs (college, for example).

Capital Preservation

Capital preservation is a strategy you often associate with elderly people who want to make sure they don’t outlive their money. Retired on nearly retired people often use this strategy to hold on the detention has. For this investor, safety is extremely important even to the extent of giving up return for security. The logic for this safety is clear. If they lose their money through foolish investment and are retired, it is unlike they will get a chance to replace it. Investors who use capital preservation tend to invest in bank CDs, U.S. Treasury issues and savings accounts.

Speculation

The speculator is not a true investor, but a trader who enjoys jumping into and out of stocks as if they were bad shoes. Speculators or traders are interested in quick profits and used advanced trading techniques like shorting stocks, trading on the margin, options and other special equipment. They have no love for the companies they trade and, in fact may not know much about them at all other than the stock is volatile and ripe for a quick profit. Speculators keep their eyes open for a quick profit situation and hope to trade in and out without much thought about the underlying companies. Many people try speculating in the stock market with the misguided goal of getting rich. It doesn’t work that way. If you want to try your hand, make sure you are using money you can afford to lose. It’s easy to get addicted, so make sure you understand the real possibilities of losing your investment.

The secondary objectives are tax minimization and Marketability or liquidity.

Tax Minimization:

An investor may pursue certain investments in order to adopt tax minimization as part of his or her investment strategy. A highly-paid executive, for example, may want to seek investments with favorable tax treatment in order to lessen his or her overall income tax burden. Making contributions to an IRA or other tax-sheltered retirement plan can be an effective tax minimization strategy.

Marketability/Liquidity:

Many of the investments we have discussed are reasonably illiquid, which means they cannot be immediately sold and easily converted into cash. Achieving a degree of liquidity, however, requires the sacrifice of a certain level of income or potential for capital gains.

Common stock is often considered the most liquid of investments, since it can usually be sold within a day or two of the decision to sell. Bonds can also be fairly marketable, but some bonds are highly illiquid, or non-tradable, possessing a fixed term. Similarly, money market instruments may only be redeemable at the precise date at which the fixed term ends. If an investor seeks liquidity, money market assets and non-tradable bonds aren’t likely to be held in his or her portfolio.

F-Test

An F-test is any statistical test in which the test statistic has an F-distribution under the null hypothesis. It is most often used when comparing statistical models that have been fitted to a data set, in order to identify the model that best fits the population from which the data were sampled. Exact “F-tests” mainly arise when the models have been fitted to the data using least squares. The name was coined by George W. Snedecor, in honour of Sir Ronald A. Fisher. Fisher initially developed the statistic as the variance ratio in the 1920s.

Formula and calculation

Most F-tests arise by considering a decomposition of the variability in a collection of data in terms of sums of squares. The test statistic in an F-test is the ratio of two scaled sums of squares reflecting different sources of variability. These sums of squares are constructed so that the statistic tends to be greater when the null hypothesis is not true. In order for the statistic to follow the F-distribution under the null hypothesis, the sums of squares should be statistically independent, and each should follow a scaled χ²-distribution. The latter condition is guaranteed if the data values are independent and normally distributed with a common variance.

Common examples of the use of F-tests include the study of the following cases:

  • The hypothesis that the means of a given set of normally distributed populations, all having the same standard deviation, are equal. This is perhaps the best-known F-test, and plays an important role in the analysis of variance (ANOVA).
  • The hypothesis that a proposed regression model fits the data well. See Lack-of-fit sum of squares.
  • The hypothesis that a data set in a regression analysis follows the simpler of two proposed linear models that are nested within each other.

Assumptions

Several assumptions are made for the test. Your population must be approximately normally distributed (i.e. fit the shape of a bell curve) in order to use the test. Plus, the samples must be independent events. In addition, you’ll want to bear in mind a few important points:

  • The larger variance should always go in the numerator (the top number) to force the test into a right-tailed test. Right-tailed tests are easier to calculate.
  • For two-tailed tests, divide alpha by 2 before finding the right critical value.
  • If you are given standard deviations, they must be squared to get the variances.
  • If your degrees of freedom aren’t listed in the F Table, use the larger critical value. This helps to avoid the possibility of Type I errors.

F Test to Compare Two Variances

A Statistical F Test uses an F Statistic to compare two variances, s1 and s2, by dividing them. The result is always a positive number (because variances are always positive). The equation for comparing two variances with the f-test is:

F = S^2 1 / s^2 2

If the variances are equal, the ratio of the variances will equal 1. For example, if you had two data sets with a sample 1 (variance of 10) and a sample 2 (variance of 10), the ratio would be 10/10 = 1.

Chi Square Test

A chi-squared test, also written as χ2 test, is a statistical hypothesis test that is valid to perform when the test statistic is chi-squared distributed under the null hypothesis, specifically Pearson’s chi-squared test and variants thereof. Pearson’s chi-squared test is used to determine whether there is a statistically significant difference between the expected frequencies and the observed frequencies in one or more categories of a contingency table.

In the standard applications of this test, the observations are classified into mutually exclusive classes. If the null hypothesis that there are no differences between the classes in the population is true, the test statistic computed from the observations follows a χ2 frequency distribution. The purpose of the test is to evaluate how likely the observed frequencies would be assuming the null hypothesis is true.

Test statistics that follow a χ2 distribution occur when the observations are independent and normally distributed, which are assumptions often justified under the central limit theorem. There are also χ2 tests for testing the null hypothesis of independence of a pair of random variables based on observations of the pairs.

Chi-squared tests often refers to tests for which the distribution of the test statistic approaches the χ2 distribution asymptotically, meaning that the sampling distribution (if the null hypothesis is true) of the test statistic approximates a chi-squared distribution more and more closely as sample sizes increase.

There are two types of chi-square tests. Both use the chi-square statistic and distribution for different purposes:

  • A chi-square goodness of fit test determines if sample data matches a population. For more details on this type, see: Goodness of Fit Test.
  • A chi-square test for independence compares two variables in a contingency table to see if they are related. In a more general sense, it tests to see whether distributions of categorical variables differ from each another.
  • A very small chi square test statistic means that your observed data fits your expected data extremely well. In other words, there is a relationship.
  • A very large chi square test statistic means that the data does not fit very well. In other words, there isn’t a relationship.

The formula for the chi-square statistic used in the chi square test is:

Fig:

The subscript “c” is the degrees of freedom. “O” is your observed value and E is your expected value. It’s very rare that you’ll want to actually use this formula to find a critical chi-square value by hand. The summation symbol means that you’ll have to perform a calculation for every single data item in your data set. As you can probably imagine, the calculations can get very, very, lengthy and tedious. Instead, you’ll probably want to use technology:

T-Test

Essentially, a t-test allows us to compare the average values of the two data sets and determine if they came from the same population. In the above examples, if we were to take a sample of students from class A and another sample of students from class B, we would not expect them to have exactly the same mean and standard deviation. Similarly, samples taken from the placebo-fed control group and those taken from the drug prescribed group should have a slightly different mean and standard deviation.

A t-test is a type of inferential statistic used to determine if there is a significant difference between the means of two groups, which may be related in certain features. It is mostly used when the data sets, like the data set recorded as the outcome from flipping a coin 100 times, would follow a normal distribution and may have unknown variances. A t-test is used as a hypothesis testing tool, which allows testing of an assumption applicable to a population.

A t-test looks at the t-statistic, the t-distribution values, and the degrees of freedom to determine the statistical significance. To conduct a test with three or more means, one must use an analysis of variance.

Mathematically, the t-test takes a sample from each of the two sets and establishes the problem statement by assuming a null hypothesis that the two means are equal. Based on the applicable formulas, certain values are calculated and compared against the standard values, and the assumed null hypothesis is accepted or rejected accordingly.

If the null hypothesis qualifies to be rejected, it indicates that data readings are strong and are probably not due to chance. The t-test is just one of many tests used for this purpose. Statisticians must additionally use tests other than the t-test to examine more variables and tests with larger sample sizes. For a large sample size, statisticians use a z-test. Other testing options include the chi-square test and the f-test.

T-Test Assumptions

  • The first assumption made regarding t-tests concerns the scale of measurement. The assumption for a t-test is that the scale of measurement applied to the data collected follows a continuous or ordinal scale, such as the scores for an IQ test.
  • The second assumption made is that of a simple random sample, that the data is collected from a representative, randomly selected portion of the total population.
  • The third assumption is the data, when plotted, results in a normal distribution, bell-shaped distribution curve.
  • The final assumption is the homogeneity of variance. Homogeneous, or equal, variance exists when the standard deviations of samples are approximately equal.

Calculating T-Tests

Calculating a t-test requires three key data values. They include the difference between the mean values from each data set (called the mean difference), the standard deviation of each group, and the number of data values of each group.

The outcome of the t-test produces the t-value. This calculated t-value is then compared against a value obtained from a critical value table (called the T-Distribution Table). This comparison helps to determine the effect of chance alone on the difference, and whether the difference is outside that chance range. The t-test questions whether the difference between the groups represents a true difference in the study or if it is possibly a meaningless random difference.

T-Distribution Tables

The T-Distribution Table is available in one-tail and two-tails formats. The former is used for assessing cases which have a fixed value or range with a clear direction (positive or negative). For instance, what is the probability of output value remaining below -3, or getting more than seven when rolling a pair of dice? The latter is used for range bound analysis, such as asking if the coordinates fall between -2 and +2.

The t-test produces two values as its output: t-value and degrees of freedom. The t-value is a ratio of the difference between the mean of the two sample sets and the variation that exists within the sample sets. While the numerator value (the difference between the mean of the two sample sets) is straightforward to calculate, the denominator (the variation that exists within the sample sets) can become a bit complicated depending upon the type of data values involved. The denominator of the ratio is a measurement of the dispersion or variability. Higher values of the t-value, also called t-score, indicate that a large difference exists between the two sample sets. The smaller the t-value, the more similarity exists between the two sample sets.

  • A large t-score indicates that the groups are different.
  • A small t-score indicates that the groups are similar.

Degrees of freedom refers to the values in a study that has the freedom to vary and are essential for assessing the importance and the validity of the null hypothesis. Computation of these values usually depends upon the number of data records available in the sample set.

Correlated (or Paired) T-Test

The correlated t-test is performed when the samples typically consist of matched pairs of similar units, or when there are cases of repeated measures. For example, there may be instances of the same patients being tested repeatedly before and after receiving a particular treatment. In such cases, each patient is being used as a control sample against themselves.

This method also applies to cases where the samples are related in some manner or have matching characteristics, like a comparative analysis involving children, parents or siblings. Correlated or paired t-tests are of a dependent type, as these involve cases where the two sets of samples are related.

The formula for computing the t-value and degrees of freedom for a paired t-test is:

T = (Mean1-Mean2)

         s(diff)/√n

  • mean1 and mean2=The average values of each of the sample sets
  • s(diff)=The standard deviation of the differences of the paired data values
  • n=The sample size (the number of paired differences)
  • n−1=The degrees of freedom​
error: Content is protected !!