Transaction Processing System (TPS)

Transaction Process System (TPS) is an information processing system for business transactions involving the collection, modification and retrieval of all transaction data. Characteristics of a TPS include performance, reliability and consistency.

TPS is also known as transaction processing or real-time processing.

A transaction process system and transaction processing are often contrasted with a batch process system and batch processing, where many requests are all executed at one time. The former requires the interaction of a user, whereas batch processing does not require user involvement. In batch processing the results of each transaction are not immediately available. Additionally, there is a delay while the many requests are being organized, stored and eventually executed. In transaction processing there is no delay and the results of each transaction are immediately available. During the delay time for batch processing, errors can occur. Although errors can occur in transaction processing, they are infrequent and tolerated, but do not warrant shutting down the entire system.

To achieve performance, reliability and consistency, data must be readily accessible in a data warehouse, backup procedures must be in place and the recovery process must be in place to deal with system failure, human failure, computer viruses, software applications or natural disasters.

Features of Transaction Processing System

There are several features involved in a good transaction processing system. A few of these critical features are described below.

  1. Performance

The concept behind the use of TPS is to efficiently generate timely results for transactions. Effectiveness is based on the number of transactions they can process at a particular time.

  1. Continuous availability

The transaction processing system should be a very stable and reliable system that must not crash easily. Disruption of TPS in an organization can lead to work disturbance and financial loss.

  1. Data integrity

The TPS must maintain the same method for all transactions processed, the system must be designed to effectively protect data and overcome any hardware/ software issues.

  1. Ease of use

The TPS should be user-friendly in order to encourage the use and also decrease errors from inputting data. It should be structured in such a way that it makes it easy to understand as well as guarding users against making errors during data-entry.

  1. Modular growth

The TPS hardware and software components should be able to be upgraded individually without requiring a complete overhaul.

  1. Controlled processing

Only authorized personnel, staff members, or employees should be able to access the system at a time.

Types of Transaction Processing Systems

  1. Batch processing

Batch processing is when clusters of transactions are refined simultaneously using a computer system.

This method, although designed to be efficient for breaking down bulky series of programs, has a drawback as there is a delay in the transaction result.

  1. Real-time Processing

Real-time processing carries out its transactions exclusively; this method ensures a swift reply on the condition of the transaction result. It is an ideal technique for dealing with singular transactions.

How does a Transaction Processing System Work?

  1. Processing in a batch

Processing batch transactions requires data collection and batch grouping. Data collected are stored in the form of batches and may be processed anytime.  This long-established technique was used widely in the absence of infotech.

  1. Processing in real-time

Recent technology innovations gave rise to real-time processing. RTP ensures instant data processing with the aim of providing a quick verification of the transaction. It is highly versatile as it can work effectively as a multi-user interface and can also be accessed anywhere there is an online network.

Components of Transaction Processing System

Below are some of the components involved in a TPS:

  • Inputs: These are source documents gotten from transactions which serve as inputs into the computer’s accounting system examples are invoices, and customer orders.
  • Processing: This requires the breaking down of information provided by the inputs.
  • Storage: This is saved information in TPS memory, it may be in the form of ledgers.
  • Output: Any generated record may serve as the output

Examples of Transaction Processing System

  • TPS accumulates data about transactions and also initiates processing that transforms stored data. Examples include order processing, employee records, and hotel reservation systems.
  • Batch transaction process examples include bill generation and check clearances.
  • Examples of real-time transaction processes are the point of sale terminals (P.O.S) and microfinance loan systems.

Limitations of Transaction Processing Systems

  • Managing operations with the TPS can be complicated if the company is not big enough to efficiently use the transaction processing system.
  • TPS needs both hardware and software components to efficiently manage high data volume. This capacity makes TPSs susceptible to software security breaches in the form of the virus and faulty hardware issues such as power outage can disrupt the whole system.
  • Effective integration of a TPS in a company operation requires skilled personnel, it also requires a link with associate company branches to maintain a secure flow of information. This high requirement can create instability and flux in the company’s daily operations.

Functions of Transaction Processing System

Transaction Processing Systems can execute input, output, storage, and processing functions.

(i) Input functions

This includes the securing of data on the source document, entering of input data in the system and also validate data.

(ii) Output functions

This includes the production of the report of the transaction via monitor or paper, examples are exception reports, detail reports, and summary reports.

(iii) Storage functions

This is the process by which data is stored. It entails the storage of information, accessing, sorting, and updating stored data.

(iv) Processing functions

This entails the transformation of data, it includes calculation, computation, and apt result.

Types of Recovery

  • Backup Recovery: this can be used to reverse required changes to a record.
  • Forward Recovery: this can be used to save transactions made between the last backup and the up to date time.it works by backing up a copy of the database and it is more proficient because it does not need to save each transaction.

A Transaction Processing System (TPS) is an infotech used to accumulate, store, modify and retrieve data transactions. Transaction processing systems present a unique response to user requirements, although planning to choose the most appropriate method relies heavily on the quantity of data and the type of business.

Information System and its Major Components

An information system (IS) is a formal, sociotechnical, organizational system designed to collect, process, store, and distribute information. In a sociotechnical perspective, information systems are composed by four components: task, people, structure (or roles), and technology.

A computer information system is a system composed of people and computers that processes or interprets information. The term is also sometimes used in more restricted senses to refer to only the software used to run a computerized database or to refer to only a computer system.

Information Systems is an academic study of systems with a specific reference to information and the complementary networks of hardware and software that people and organizations use to collect, filter, process, create and also distribute data. An emphasis is placed on an information system having a definitive boundary, users, processors, storage, inputs, outputs and the aforementioned communication networks.

Any specific information system aims to support operations, management and decision-making. An information system is the information and communication technology (ICT) that an organization uses, and also the way in which people interact with this technology in support of business processes.

Some authors make a clear distinction between information systems, computer systems, and business processes. Information systems typically include an ICT component but are not purely concerned with ICT, focusing instead on the end use of information technology. Information systems are also different from business processes. Information systems help to control the performance of business processes.

Alter argues for advantages of viewing an information system as a special type of work system. A work system is a system in which humans or machines perform processes and activities using resources to produce specific products or services for customers. An information system is a work system whose activities are devoted to capturing, transmitting, storing, retrieving, manipulating and displaying information.

As such, information systems inter-relate with data systems on the one hand and activity systems on the other. An information system is a form of communication system in which data represent and are processed as a form of social memory. An information system can also be considered a semi-formal language which supports human decision making and action.

Components of Information Systems

The computer age introduced a new element to businesses, universities, and a multitude of other organizations: a set of components called the information system, which deals with collecting and organizing data and information. An information system is described as having five components.

  1. Computer hardware

This is the physical technology that works with information. Hardware can be as small as a smartphone that fits in a pocket or as large as a supercomputer that fills a building. Hardware also includes the peripheral devices that work with computers, such as keyboards, external disk drives, and routers. With the rise of the Internet of things, in which anything from home appliances to cars to clothes will be able to receive and transmit data, sensors that interact with computers are permeating the human environment.

  1. Computer software

The hardware needs to know what to do, and that is the role of software. Software can be divided into two types: system software and application software. The primary piece of system software is the operating system, such as Windows or iOS, which manages the hardware’s operation. Application software is designed for specific tasks, such as handling a spreadsheet, creating a document, or designing a Web page.

  1. Telecommunications

This component connects the hardware together to form a network. Connections can be through wires, such as Ethernet cables or fibre optics, or wireless, such as through Wi-Fi. A network can be designed to tie together computers in a specific area, such as an office or a school, through a local area network (LAN). If computers are more dispersed, the network is called a wide area network (WAN). The Internet itself can be considered a network of networks.

  1. Databases and Data Warehouses

This component is where the “material” that the other components work with resides. A database is a place where data is collected and from which it can be retrieved by querying it using one or more specific criteria. A data warehouse contains all of the data in whatever form that an organization needs. Databases and data warehouses have assumed even greater importance in information systems with the emergence of “big data,” a term for the truly massive amounts of data that can be collected and analyzed.

  1. Human Resources and Procedures

The final, and possibly most important, component of information systems is the human element: the people that are needed to run the system and the procedures they follow so that the knowledge in the huge databases and data warehouses can be turned into learning that can interpret what has happened in the past and guide future action.

Technologies within Information Systems:

  • Data Management:

This involves techniques for collecting, organizing, and storing data efficiently. It includes database management systems (DBMS), data modeling, data normalization, and data governance.

  • Information Retrieval:

Techniques for retrieving relevant information from large datasets or databases. This includes search algorithms, indexing methods, and information retrieval models.

  • Networking and Telecommunications:

Technologies that facilitate the transmission of data between computers and devices. This includes network protocols, wireless communication, and internet technologies.

  • Systems Analysis and Design:

Methodologies for analyzing organizational processes and designing information systems to support them. This involves requirements gathering, system modeling, and the use of tools such as Unified Modeling Language (UML).

  • Software Development:

Techniques for building software applications to automate business processes or provide decision support. This includes programming languages, software development methodologies (e.g., Agile, Waterfall), and software testing techniques.

  • Cybersecurity:

Measures to protect information systems from unauthorized access, data breaches, and other security threats. This includes encryption, firewalls, intrusion detection systems, and security policies.

  • Cloud Computing:

Delivery of computing services over the internet, allowing organizations to access resources such as storage, processing power, and software on-demand. This includes Infrastructure as a Service (IaaS), Platform as a Service (PaaS), and Software as a Service (SaaS) models.

  • Business Intelligence and Analytics:

Techniques for analyzing and interpreting data to gain insights and support decision-making. This includes data mining, predictive analytics, business intelligence tools, and visualization techniques.

  • Enterprise Resource Planning (ERP):

Integrated software systems that facilitate the management of core business processes, such as accounting, human resources, and supply chain management.

  • Emerging Technologies:

Constantly evolving technologies that have the potential to disrupt traditional Information Systems, such as artificial intelligence (AI), machine learning, blockchain, and the Internet of Things (IoT).

Business Data Processing, Functions, Process, Components, Uses

Business Data Processing refers to the collection, organization, analysis, and use of data to support business activities and decision making. It involves converting raw data such as sales figures, customer details, and transaction records into meaningful information. In Indian businesses, data processing is used in accounting, payroll, inventory control, banking, and customer management systems. Computers and software help process large amounts of data quickly and accurately. Proper data processing improves efficiency, reduces errors, and helps managers plan better strategies. For example, companies use processed data to track profits, control costs, and understand customer trends. With the growth of digital payments and online business in India, business data processing has become an essential part of modern business operations and technology.

Functions of Business Data Processing:

1. Data Collection and Capture

This is the foundational function of gathering raw data from its various sources. It involves systematically recording business transactions and events at their point of origin. This can be done manually (via forms, surveys) or automatically through digital means like point-of-sale (POS) scanners, website cookies, IoT sensors, or customer relationship management (CRM) system entries. The goal is to ensure all relevant data is acquired completely and accurately for future processing. Efficient capture, often using technologies like Optical Character Recognition (OCR), minimizes entry errors and forms the reliable input for the entire data processing cycle.

2. Data Validation and Verification

Once data is captured, this function ensures its quality, accuracy, and integrity before further processing. Validation checks if data meets predefined rules (e.g., a date field contains a valid date, a price is a positive number). Verification confirms the data’s correctness, often by comparing it against a trusted source or using checksums. This step is critical to prevent “garbage in, garbage out” scenarios, where erroneous input leads to faulty outputs and business decisions. Automated validation rules in software forms and database constraints are key tools for maintaining high-quality, trustworthy data.

3. Data Classification and Organization

This function involves sorting and categorizing the validated raw data into logical, structured formats for efficient storage and retrieval. Data is classified based on shared characteristics, such as transaction type, customer segment, product category, or date. It is then organized into records and fields within a structured database or data warehouse. Proper classification, often using coding schemes or taxonomies, transforms chaotic data into an organized resource. This enables systematic analysis, supports reporting by various dimensions (e.g., sales by region), and is essential for implementing effective data management policies.

4. Data Calculation and Aggregation

This is the core computational function where raw data is transformed into meaningful information. It involves performing arithmetic and logical operations. This includes calculation (computing values like sales tax, total invoice amounts, or profit margins) and aggregation (summarizing detailed data into totals, averages, counts, or other statistical measures—e.g., total quarterly revenue, average customer spend). These processes convert individual transaction data into consolidated figures that reveal trends, performance metrics, and key business insights, forming the basis for managerial reporting and financial statements.

5. Data Storage and Retrieval

This function pertains to the secure and efficient archiving of processed and unprocessed data for future use. Processed information is stored in organized databases, data warehouses, or cloud storage systems. An effective system must allow for rapid retrieval of specific data or reports when needed by authorized users. This involves database management systems (DBMS) that use queries (e.g., SQL) to locate information. Proper storage ensures data durability, supports historical analysis, and provides a reliable audit trail, all while balancing cost, accessibility, and security requirements.

6. Data Analysis and Reporting

This function transforms stored, aggregated data into actionable intelligence for decision-makers. Analysis involves examining data using statistical tools, Business Intelligence (BI) software, or data mining techniques to identify patterns, correlations, and trends (e.g., seasonal sales spikes). Reporting is the process of presenting this analyzed information in a structured format—such as standard printed reports, interactive digital dashboards, or visual charts. The goal is to communicate key performance indicators (KPIs) and insights clearly and timely to various stakeholders, enabling informed operational control and strategic planning.

7. Data Communication and Distribution

This function ensures that processed information—reports, analyses, transactional confirmations—reaches the correct internal or external users in a usable format. Internally, it involves distributing sales reports to managers or inventory alerts to the warehouse. Externally, it includes sending invoices to customers, remittance advices to suppliers, or regulatory filings to government bodies. Modern systems automate this via email, enterprise portals, EDI (Electronic Data Interchange), or API integrations. Effective communication ensures all stakeholders have the information they need to act, closing the loop between data processing and business action.

8. Data Security and Integrity Maintenance

This is the protective function that safeguards data throughout its lifecycle. It ensures confidentiality (preventing unauthorized access via encryption, access controls), integrity (preventing unauthorized alteration via checksums, audit logs), and availability (ensuring data is accessible when needed via backups, redundancy). It involves implementing cybersecurity measures, establishing clear data governance policies, and complying with regulations like GDPR or India’s DPDP Act. This function is critical for maintaining trust, preventing financial loss from breaches or corruption, and ensuring business continuity, making it a non-negotiable aspect of modern data processing.

Process of Business Data Processing:

1. Origination: The Data Creation Point

This is the initial stage where a business transaction or event occurs, generating raw data. It is the source of all subsequent processing. Examples include a customer placing an order online, an employee logging hours, or a sensor reading inventory levels. The goal at this stage is to capture the data accurately at its point of origin. How data is originated (e.g., digital form, paper invoice, IoT stream) significantly impacts the efficiency and accuracy of the entire process. Effective origination often involves designing user-friendly interfaces and automated data capture to minimize initial errors.

2. Input: Data Entry and Collection

In this stage, the raw data from the source is converted into a machine-readable format and entered into the business’s information system. This can be manual (a clerk keying in invoice details) or automated (a barcode scanner reading a product SKU, an API pulling data from a website form). The focus is on efficient and error-free data entry. Techniques like source data automation (using scanners, sensors) and input validation rules are crucial here to ensure quality and completeness before the data moves to the next phase of the cycle.

3. Processing: The Transformation Core

This is the central stage where input data is manipulated, calculated, and transformed into meaningful information. Processing involves actions like:

  • Classifying: Sorting data into categories (e.g., sales region).

  • Sorting: Arranging data in a sequence (e.g., alphabetical, by date).

  • Calculating: Performing arithmetic (e.g., computing totals, taxes, discounts).

  • Summarizing: Aggregating data (e.g., creating daily sales totals).

This can be done via batch processing (processing accumulated transactions at once, often overnight) or real-time/online processing (handling each transaction immediately, as in ATM withdrawals).

4. Output: Information Delivery

In this stage, the processed data is converted into a useful, human-intelligible format and presented to the end-user. Output can take many forms: printed reports (payroll registers), visual dashboards on a screen, electronic files (e-mailed invoices), or even audio responses. The key is that the data is now organized information ready to support decision-making. Effective output design ensures the information is clear, relevant, timely, and accessible to the intended audience, whether it’s a manager, a customer, or another system.

5. Storage: Data Archiving and Retrieval

After processing, both the raw input data and the processed information are stored for future reference. This involves saving data to secure, organized storage media like databases, data warehouses, or cloud servers. Storage serves multiple purposes: it creates a permanent audit trail for transactions, provides historical data for trend analysis, and allows for the retrieval of information for subsequent reporting or processing cycles. A robust storage strategy balances accessibility, security, and cost, ensuring data integrity and compliance with data retention policies.

6. Distribution and Communication

This step involves transmitting the processed information (output) to the people or systems that need it to take action or make decisions. Distribution can be internal (sending a sales report to regional managers via a company portal) or external (e-mailing an invoice to a customer, submitting a regulatory filing via a government gateway). Modern systems automate this through workflows, EDI (Electronic Data Interchange), and integrated communication channels, ensuring the right information reaches the right destination promptly and securely to facilitate business operations and responses.

7. Feedback and Control Loop

This final, critical stage ensures the entire data processing cycle remains accurate and effective. Feedback involves monitoring the system’s output and comparing it against expected results or predefined standards (e.g., does the trial balance match?). If discrepancies or errors are found—such as a reporting anomaly or an input error—corrective control actions are taken. This could mean re-entering data, adjusting processing rules, or refining collection methods. This closed-loop process allows for continuous system verification, error correction, and improvement, maintaining the reliability and relevance of the business’s information system.

Components of Business Data Processing:

1. Input Devices and Data Capture Tools

These are the hardware and software components used to collect raw data from its source and convert it into a digital format for the system. This includes traditional tools like keyboards, barcodes, and scanners, as well as modern interfaces like web forms, mobile app inputs, IoT sensors, and APIs that automatically capture data from external systems. Their efficiency and accuracy directly impact data quality. Modern businesses prioritize source data automation (e.g., QR code scanners, OCR) to minimize manual entry errors and accelerate the initial stage of the processing cycle.

2. Central Processing Unit (CPU) and Servers

The CPU is the “brain” of the computer system where the actual processing occurs—performing calculations, executing logical operations, and controlling other components. In a business context, this function is scaled through servers and data centers (or cloud computing resources) that handle massive volumes of concurrent transactions. These systems run the software algorithms that sort, classify, calculate, and summarize raw data. Their processing power, speed, and reliability are critical for handling complex business logic, from real-time inventory updates to large-scale financial batch processing.

3. Storage Media and Databases

This component provides the permanent and temporary memory for holding data at every stage—input, in-process, and output. It includes primary storage (RAM for immediate processing) and secondary storage like hard disks, solid-state drives, and cloud storage for long-term retention. Database Management Systems (DBMS) like Oracle, MySQL, or SQL Server are specialized software that organize, store, and manage this data in structured, relational formats, enabling efficient querying, retrieval, and data integrity. This infrastructure is the foundation for a company’s “single source of truth” and historical record-keeping.

4. Output Devices and Presentation Layer

These are the components that communicate the processed information back to the end-user in a comprehensible format. They transform digital data into usable business intelligence. This includes physical devices like monitors, printers, and speakers, as well as the software interfaces that present the data: report generatorsBusiness Intelligence (BI) dashboardsdata visualization tools (like graphs and charts), and automated channels like email or portal notifications. An effective presentation layer is crucial for translating complex processed data into actionable insights for decision-makers at all levels.

5. System Software and Operating Environment

This is the foundational software that manages the hardware resources and provides a platform for running application software. The Operating System (OS) (like Windows Server, Linux) controls basic functions, while utility programs handle tasks like data backup, security, and disk management. This layer ensures all physical components (input, CPU, storage, output) work together harmoniously. It provides the essential services—file management, memory allocation, and user access control—that allow business application software to execute data processing tasks efficiently and securely.

6. Application Software and Business Logic

This is the specialized software programmed to perform the specific data processing tasks of the business. It contains the business rules and logic (e.g., formulas for tax calculation, rules for inventory reordering). Examples include Enterprise Resource Planning (ERP), Customer Relationship Management (CRM), and custom accounting software. This software uses the system software and hardware to execute the core functions of the data processing cycle: it accepts input, processes it according to defined procedures, directs storage, and generates the required reports and outputs that drive daily business operations.

7. Communication Networks and Connectivity

This component enables the flow of data between all other components, users, and sometimes external entities. It includes the physical networking hardware (routers, switches, modems) and protocols/software (TCP/IP) that connect input devices to servers, servers to storage, and the system to output channels. In modern distributed environments, this also encompasses internet connectivity, VPNs, and cloud integration. Robust network infrastructure is vital for real-time data processing, supporting e-commerce, cloud-based applications, and seamless data exchange across departments and geographic locations, ensuring the system operates as a cohesive unit.

8. Procedures and Human Resources

The most critical component is the set of documented procedures, rules, and instructions that govern how the system is used, and the people who execute them. This includes the IT staff who design and maintain the system, data entry operators, managers who interpret outputs, and end-users who initiate transactions. Clear procedures for data entry, error handling, backup, and security protocols are essential. Even the most advanced system fails without trained personnel following correct methods, making this human and procedural element the keystone for successful and reliable business data processing.

Uses of Business Data Processing:

1. Transaction Processing and Record Keeping

The foundational use of business data processing is the systematic recording of daily commercial transactions. This includes processing sales orders, purchase invoices, payroll, and inventory movements. By converting these events into digital records, the system creates a complete, accurate, and auditable financial history of the company. This automated record-keeping eliminates manual ledgers, reduces clerical errors, and ensures compliance with accounting standards and tax regulations. It provides the essential data trail for financial statements, internal audits, and regulatory reporting, forming the indisputable backbone of the company’s operational and financial integrity.

2. Customer Relationship Management (CRM)

Data processing powers CRM systems by consolidating and analyzing all customer interactions. It processes data from sales calls, support tickets, website visits, and purchase history to build comprehensive customer profiles. This enables personalized marketing campaigns, targeted sales follow-ups, and proactive customer service. By analyzing purchase patterns and feedback, businesses can anticipate needs, segment customers for tailored offers, and increase customer lifetime value. Effective CRM processing transforms raw customer data into actionable intelligence, driving loyalty, retention, and revenue growth through a deep, data-driven understanding of the customer base.

3. Inventory and Supply Chain Management

This use involves processing real-time data on stock levels, supplier lead times, order status, and sales forecasts. The system automatically updates inventory counts after each sale or receipt, triggers reorder points, and optimizes warehouse logistics. By processing data from the entire supply chain, businesses can achieve just-in-time inventory, reduce carrying costs, minimize stockouts and overstock, and improve order fulfillment accuracy. This end-to-end visibility and automation enhance operational efficiency, reduce waste, and create a more resilient and responsive supply network capable of adapting to demand fluctuations.

4. Financial Analysis and Management Reporting

Business data processing aggregates transactional data to generate critical financial reports and performance analyses. It automatically produces profit & loss statements, balance sheets, cash flow statements, and budget variance reports. Beyond standard accounting, it enables detailed management reporting—such as departmental P&L, sales performance by region, or product line profitability. By processing data into structured reports and visual dashboards, it provides executives and managers with timely insights into financial health, profitability drivers, and cost centers, supporting strategic planning, investment decisions, and operational control.

5. Human Resources and Payroll Administration

This use automates the core administrative functions of HR. Data processing systems manage employee databases, track attendance and leave, calculate complex payrolls (including taxes, deductions, and benefits), and ensure statutory compliance (like PF, ESIC). They process performance review data to aid in talent management and succession planning. By automating these labor-intensive tasks, HR data processing reduces errors, ensures timely and accurate salary disbursements, maintains confidential records securely, and frees the HR department to focus on strategic initiatives like employee engagement and development.

6. Marketing Analysis and Campaign Management

Data processing transforms marketing from a creative guesswork into a measurable science. It analyzes data from digital campaigns, social media engagement, website analytics, and sales conversions to measure ROI, customer acquisition costs, and channel effectiveness. By processing customer demographic and behavioral data, it enables precise audience segmentation for targeted campaigns (email, social ads). Marketers can test different strategies, process the response data, and continuously optimize campaigns for better performance, ensuring marketing budgets are spent efficiently to generate maximum leads and sales.

7. Business Intelligence and Strategic Decision Support

This advanced use involves processing large volumes of historical and current data to uncover trends, patterns, and predictive insights. Using Online Analytical Processing (OLAP), data mining, and predictive modeling, it answers strategic questions like “What will be the demand next quarter?” or “Which market should we enter?” By processing data into interactive dashboards and scenario models, it provides a fact-based foundation for long-term strategic decisions regarding market expansion, new product development, mergers & acquisitions, and competitive positioning, moving the business from reactive to proactive management.

8. Risk Management and Compliance Monitoring

Data processing is crucial for identifying, assessing, and mitigating business risks. It monitors transactional data in real-time to flag anomalies indicative of fraud or operational risk. It processes data to ensure adherence to internal controls and external regulations (e.g., SEBI, GDPR, RBI guidelines). By automating compliance checks and generating audit trails, it helps businesses avoid penalties, protect assets, and maintain their reputation. This use transforms risk management from a periodic audit exercise into a continuous, embedded process that safeguards the enterprise.

Laws of Returns to Scale

Laws of Returns to Scale explain how output changes in response to a proportionate change in all inputs in the long run, where all factors of production (land, labor, capital, etc.) are variable. Unlike the Law of Variable Proportions which operates in the short run and changes only one input, returns to scale analyze the effect of changing all inputs simultaneously.

On the basis of these possibilities, law of returns can be classified into three categories:

  • Increasing returns to scale
  • Constant returns to scale
  • Diminishing returns to scale

1. Increasing Returns to Scale:

If the proportional change in the output of an organization is greater than the proportional change in inputs, the production is said to reflect increasing returns to scale. For example, to produce a particular product, if the quantity of inputs is doubled and the increase in output is more than double, it is said to be an increasing returns to scale. When there is an increase in the scale of production, the average cost per unit produced is lower. This is because at this stage an organization enjoys high economies of scale.

Figure-1 shows the increasing returns to scale:

In Figure-1, a movement from a to b indicates that the amount of input is doubled. Now, the combination of inputs has reached to 2K+2L from 1K+1L. However, the output has Increased from 10 to 25 (150% increase), which is more than double. Similarly, when input changes from 2K-H2L to 3K + 3L, then output changes from 25 to 50(100% increase), which is greater than change in input. This shows increasing returns to scale.

There a number of factors responsible for increasing returns to scale.

Some of the factors are as follows:

(i) Technical and managerial indivisibility

Implies that there are certain inputs, such as machines and human resource, used for the production process are available in a fixed amount. These inputs cannot be divided to suit different level of production. For example, an organization cannot use the half of the turbine for small scale of production.

Similarly, the organization cannot use half of a manager to achieve small scale of production. Due to this technical and managerial indivisibility, an organization needs to employ the minimum quantity of machines and managers even in case the level of production is much less than their capacity of producing output. Therefore, when there is increase in inputs, there is exponential increase in the level of output.

(ii) Specialization

Implies that high degree of specialization of man and machinery helps in increasing the scale of production. The use of specialized labor and machinery helps in increasing the productivity of labor and capital per unit. This results in increasing returns to scale.

(iii) Concept of Dimensions

Refers to the relation of increasing returns to scale to the concept of dimensions. According to the concept of dimensions, if the length and breadth of a room increases, then its area gets more than doubled.

For example, length of a room increases from 15 to 30 and breadth increases from 10 to 20. This implies that length and breadth of room get doubled. In such a case, the area of room increases from 150 (15*10) to 600 (30*20), which is more than doubled.

2. Constant Returns to Scale:

The production is said to generate constant returns to scale when the proportionate change in input is equal to the proportionate change in output. For example, when inputs are doubled, so output should also be doubled, then it is a case of constant returns to scale.

Figure-2 shows the constant returns to scale:

In Figure-2, when there is a movement from a to b, it indicates that input is doubled. Now, when the combination of inputs has reached to 2K+2L from IK+IL, then the output has increased from 10 to 20.

Similarly, when input changes from 2Kt2L to 3K + 3L, then output changes from 20 to 30, which is equal to the change in input. This shows constant returns to scale. In constant returns to scale, inputs are divisible and production function is homogeneous.

3. Diminishing Returns to Scale:

Diminishing returns to scale refers to a situation when the proportionate change in output is less than the proportionate change in input. For example, when capital and labor is doubled but the output generated is less than doubled, the returns to scale would be termed as diminishing returns to scale.

Figure 3 shows the diminishing returns to scale:

In Figure-3, when the combination of labor and capital moves from point a to point b, it indicates that input is doubled. At point a, the combination of input is 1k+1L and at point b, the combination becomes 2K+2L.

However, the output has increased from 10 to 18, which is less than change in the amount of input. Similarly, when input changes from 2K+2L to 3K + 3L, then output changes from 18 to 24, which is less than change in input. This shows the diminishing returns to scale.

Diminishing returns to scale is due to diseconomies of scale, which arises because of the managerial inefficiency. Generally, managerial inefficiency takes place in large-scale organizations. Another cause of diminishing returns to scale is limited natural resources. For example, a coal mining organization can increase the number of mining plants, but cannot increase output due to limited coal reserves.

Monopolistic Competition, Concepts, Meaning, Definitions, Characteristics, Price Determination, Advantages and Disadvantages

Monopolistic competition is a market structure that combines elements of both monopoly and perfect competition. In this system, a large number of firms operate in the market, each producing a product that is similar but not identical to others. Product differentiation is the core concept of monopolistic competition. Firms attempt to distinguish their products through branding, quality, design, packaging, or services. Although firms enjoy some degree of monopoly power over their own products, this power is limited due to the presence of close substitutes.

Meaning of Monopolistic Competition

Monopolistic competition refers to a market situation where many sellers sell differentiated products to a large number of buyers. Each firm acts independently and has limited control over price. Consumers perceive differences among products, even though they serve the same basic purpose. Because of differentiation, firms face downward-sloping demand curves. Entry and exit of firms are relatively free, which ensures that abnormal profits exist only in the short run, while in the long run firms earn normal profits.

Definitions of Monopolistic Competition

  • Edward Chamberlin’s Definition

According to Edward Chamberlin, “Monopolistic competition is a market structure in which there are many sellers selling differentiated products. Each firm has a certain degree of monopoly power over its own product due to differentiation, but close substitutes are available in the market, limiting excessive pricing.”

  • Joan Robinson’s Definition

Joan Robinson defined monopolistic competition as “a market structure where many firms produce similar but not identical products, and each firm competes independently with limited control over price.”

  • Leftwich’s Definition

According to Leftwich, “Monopolistic competition is a market structure in which there are many firms producing differentiated products, and there is freedom of entry and exit in the long run.”

Characteristics of Monopolistic Competition

  • Large Number of Buyers and Sellers

Monopolistic competition involves many buyers and sellers operating in the market. However, unlike perfect competition, each firm holds a relatively small market share and operates independently. No single firm has enough influence to affect overall market supply or pricing significantly. The presence of numerous sellers ensures that customers have multiple choices. Each firm faces competition from others offering close substitutes, although products are not identical. This structure encourages innovation and marketing strategies to capture consumer attention and retain a loyal customer base.

  • Product Differentiation

One of the most defining features of monopolistic competition is product differentiation. Firms sell products that are similar but not identical, which gives consumers the perception of uniqueness. Differentiation can be based on quality, packaging, features, branding, style, or customer service. This perceived uniqueness allows firms to charge slightly higher prices than competitors. For example, different brands of toothpaste or clothing are essentially the same but marketed differently. Product differentiation creates brand loyalty and gives firms a degree of pricing power in the market.

  • Freedom of Entry and Exit

Monopolistic competition allows free entry and exit of firms in the long run. New firms can enter the market when existing firms are earning supernormal profits, increasing competition and reducing profit margins over time. Conversely, firms that incur losses can leave without major obstacles. This flexibility ensures that no single firm dominates the market permanently. As firms enter or exit, the number of sellers stabilizes, and long-run equilibrium is achieved where each firm earns normal profit. This characteristic promotes healthy competition and market dynamism.

  • Some Degree of Price Control

Firms in monopolistic competition have some pricing power due to product differentiation. Unlike perfect competition, where firms are price takers, here each firm faces a downward-sloping demand curve, allowing them to set prices independently within a certain range. However, the presence of close substitutes limits this power. If a firm charges significantly higher prices, consumers may shift to competing products. Thus, while firms can influence prices to a limited extent, their pricing decisions are closely tied to how well they differentiate their product.

  • Non-Price Competition

In monopolistic competition, firms often engage in non-price competition to attract and retain customers. Since raising prices can drive customers to competitors, businesses focus on marketing tactics such as advertising, sales promotions, improved packaging, customer service, or introducing new features. These strategies build brand identity and customer loyalty without directly altering the price. For instance, mobile phone brands emphasize camera quality or screen resolution over price cuts. Non-price competition is vital in this market structure to maintain customer base and market share.

  • Independent Decision Making

Each firm in monopolistic competition makes its own independent business decisions regarding pricing, output, marketing, and product design. There is no formal coordination among firms as seen in oligopolies. The strategic decisions are based on individual cost structures, market analysis, and competitive positioning. Although firms are aware of competitors’ actions, they don’t engage in collective behavior like price fixing. This autonomy allows firms to experiment, innovate, and adopt different business strategies tailored to their product and target customers.

  • Elastic Demand Curve

A firm in monopolistic competition faces a highly elastic but not perfectly elastic demand curve. Because there are many close substitutes available, a small increase in price may lead to a significant decrease in quantity demanded. However, due to product differentiation, the firm retains some customers who are loyal to the brand or specific features. This elasticity reflects the balance between customer preference and market competition. Firms must therefore carefully assess the price sensitivity of their consumers to maintain sales volume and revenue.

  • High Selling and Promotional Costs

Advertising, promotional campaigns, and other selling efforts are prominent in monopolistic competition. Since products are differentiated, firms spend heavily on selling costs to inform, persuade, and remind customers of their product’s uniqueness. These costs are necessary to sustain brand loyalty and attract new buyers in a highly competitive environment. Companies may invest in social media, endorsements, packaging innovations, or after-sale services. Though these expenses don’t directly enhance production, they significantly impact consumer perception and play a central role in business success.

Price Determination under Monopolistic Competition

Price determination under monopolistic competition explains how firms fix prices in a market where many sellers offer similar but differentiated products. Each firm has limited control over price because its product is unique, yet close substitutes restrict excessive pricing. Price is not decided by the entire industry but by individual firms based on demand, cost, and competition. This pricing mechanism combines elements of monopoly power and competitive pressure, making it highly relevant to real-world markets.

  • Nature of Demand Curve

In monopolistic competition, each firm faces a downward-sloping demand curve. This is because product differentiation creates brand loyalty, allowing firms to reduce prices to increase sales. However, demand is relatively elastic since consumers can switch to close substitutes if prices rise. The downward slope indicates that firms must lower prices to sell more units, which directly influences how price is determined in the market.

  • Role of Product Differentiation

Product differentiation plays a crucial role in price determination. Firms differentiate products through quality, design, packaging, brand image, and services. Greater differentiation reduces price sensitivity and gives firms more control over pricing. Consumers are willing to pay higher prices for preferred brands. However, differentiation does not eliminate competition, as substitute products limit excessive price increases. Entrepreneurs rely on differentiation to influence demand and pricing flexibility.

  • Cost Conditions and Pricing

Cost conditions strongly influence price determination under monopolistic competition. Firms analyze average cost and marginal cost before fixing prices. Profit maximization occurs where marginal cost equals marginal revenue. The price is then determined from the demand curve at that output level. If production or selling costs increase, firms may raise prices, provided consumers accept the increase. Efficient cost management is therefore essential for competitive pricing.

  • Short-Run Price Determination

In the short run, firms under monopolistic competition may earn supernormal profits, normal profits, or incur losses. When demand is high and costs are low, firms can charge prices above average cost. Price is determined where marginal cost equals marginal revenue. Short-run profits attract new firms, increasing competition. Thus, short-run price determination reflects temporary market conditions rather than long-term equilibrium.

  • Long-Run Price Determination

In the long run, free entry of firms eliminates supernormal profits. New firms introduce close substitutes, reducing the demand for existing firms. The demand curve shifts leftward until it becomes tangent to the average cost curve. At this point, firms earn only normal profits. Price equals average cost but remains higher than marginal cost, reflecting product differentiation and excess capacity.

  • Role of Selling Costs

Selling costs such as advertising and promotion influence price determination under monopolistic competition. Firms incur selling costs to shift the demand curve to the right by increasing brand awareness and loyalty. These costs raise total cost and often lead to higher prices. While selling costs strengthen competitive position, excessive advertising increases prices without proportionate consumer benefit, affecting overall efficiency.

  • Impact of Competition on Pricing

Competition limits price control under monopolistic competition. Firms must consider competitor prices and consumer reactions before fixing prices. Excessive pricing may lead to loss of customers to substitutes. At the same time, price wars are uncommon because firms prefer non-price competition. This balanced competitive pressure ensures moderate prices, innovation, and product variety while preventing monopolistic exploitation.

Advantages of Monopolistic Competition

  • Wide Variety of Products

One of the major advantages of monopolistic competition is the availability of a wide variety of products. Firms differentiate their goods based on quality, design, packaging, branding, and features. This variety satisfies diverse consumer tastes and preferences. Consumers can choose products that best match their needs, income levels, and lifestyles. Unlike perfect competition, where products are homogeneous, monopolistic competition enhances consumer satisfaction through choice and diversity.

  • Consumer Satisfaction

Monopolistic competition increases consumer satisfaction by offering differentiated products and improved services. Firms focus on customer needs to maintain brand loyalty. Better after-sales services, warranties, and attractive packaging enhance consumer experience. Consumers are not forced to buy a single standardized product and can switch brands easily. This freedom of choice empowers consumers and encourages firms to continuously improve product quality and customer service.

  • Freedom of Entry and Exit

Another important advantage is the freedom of entry and exit of firms. New firms can easily enter the market if they perceive profit opportunities. Similarly, inefficient firms can exit without major barriers. This flexibility promotes healthy competition and innovation. It prevents long-term monopolistic profits and ensures efficient resource allocation. Free entry and exit also make the market dynamic and adaptable to changing consumer preferences.

  • Encouragement to Innovation

Monopolistic competition strongly encourages innovation and creativity. Firms continuously introduce new designs, features, and improvements to differentiate their products from competitors. Innovation helps firms attract consumers and gain a competitive edge. This leads to technological advancement and improved product quality over time. Continuous innovation benefits consumers and contributes to overall economic development by promoting research and development activities.

  • Limited Price Control

Firms under monopolistic competition enjoy limited price control due to product differentiation. They can set prices slightly above competitors without losing all customers. However, this control is not absolute because close substitutes exist. This balance allows firms to recover costs and earn normal profits while protecting consumers from excessive pricing. Thus, price stability is maintained through competitive pressure.

  • Role of Non-Price Competition

Non-price competition is a significant advantage of monopolistic competition. Firms compete through advertising, branding, quality improvement, and customer service rather than aggressive price wars. This reduces the risk of destructive competition and encourages market stability. Non-price competition enhances product awareness and helps consumers make informed choices. It also strengthens brand identity and long-term customer relationships.

  • Better Quality and Services

Under monopolistic competition, firms focus on improving quality and services to retain customers. Since consumers can easily switch to substitutes, firms strive to maintain high standards. Better quality, innovation, and customer-oriented services become essential survival strategies. This results in overall improvement in market offerings and enhances consumer welfare.

  • Balanced Market Structure

Monopolistic competition provides a balanced market structure by combining competition and monopoly elements. It avoids the extremes of perfect competition and pure monopoly. Consumers enjoy choice and quality, while firms benefit from product differentiation and reasonable pricing power. This balance makes monopolistic competition suitable for real-world markets such as retail, clothing, restaurants, and consumer goods industries.

Disadvantages of monopolistic competition

  • Inefficiency in Resource Allocation

Monopolistic competition often leads to inefficient allocation of resources. Firms do not produce at the minimum point of their average cost curve, unlike in perfect competition. Since each firm has some market power due to product differentiation, they charge a higher price than marginal cost, causing underproduction and inefficiency. This misallocation leads to deadweight loss and limits overall welfare. It implies that the economy does not make the best use of its resources, resulting in reduced productivity and consumer surplus.

  • Excess Capacity

Firms in monopolistic competition often operate with excess capacity, meaning they do not produce at full potential or minimum average cost. Due to downward-sloping demand curves and market saturation, firms can’t maximize their scale. This inefficiency results from the competitive pressure to differentiate and maintain uniqueness. Firms intentionally avoid producing large quantities to preserve price control. This leads to wasted resources, higher unit costs, and underutilization of infrastructure and labor, which ultimately reflects a less-than-optimal economic output for the industry.

  • Higher Prices for Consumers

Due to product differentiation, firms in monopolistic competition have some price-setting power, leading to higher prices than in perfect competition. Consumers end up paying more for essentially similar products just because of perceived differences. This pricing strategy reduces consumer welfare, especially when the higher price is not justified by proportional quality improvements. In the long run, although supernormal profits are eroded by new entrants, prices still remain above marginal cost, resulting in persistent market inefficiency and higher expenditure for consumers.

  • Wastage on Advertising and Selling Costs

Firms in monopolistic competition incur excessive costs on advertising, branding, packaging, and other selling expenses to differentiate their products. These selling costs are not directly related to improving product quality or quantity but aim to manipulate consumer perception. This results in a significant portion of resources being used for persuasive rather than productive purposes. From a societal point of view, this is considered wasteful, as these expenditures could have been used for more value-adding activities or price reductions.

  • Misleading Product Differentiation

Product differentiation in monopolistic competition is often more artificial than real. Firms use branding, slogans, and packaging to create a false sense of uniqueness. This may lead consumers to believe one product is significantly better than another, even if the actual difference is minimal. Such strategies may manipulate customer decisions rather than improve the product itself. It can also promote consumerism and irrational buying behavior, where choices are driven more by image than by real value or utility.

  • Lack of Long-Term Innovation

Firms in monopolistic competition may lack incentives for long-term innovation. Since the market is crowded and profits are normal in the long run, firms often focus on short-term promotional gains rather than investing in research and development. Innovation may be limited to superficial changes like packaging or color variants. In contrast to monopolies that can invest in technological advancement due to sustained profits, monopolistic firms are under constant pressure and may avoid risky, long-term improvements that require substantial capital.

  • Unstable Market Structure

The ease of entry and exit in monopolistic competition creates a dynamic yet unstable market structure. Continuous entry of new firms erodes existing profits, while poorly performing firms frequently exit. This causes fluctuating market shares, inconsistent pricing strategies, and unpredictable consumer loyalty. The lack of stability makes it difficult for firms to plan for long-term investments or build lasting competitive advantages. This volatility can also confuse consumers due to rapidly changing product varieties and brands.

  • Duplication of Resources

Due to multiple firms offering similar yet differentiated products, there is often a duplication of efforts and resources. Each firm invests separately in advertising, packaging, distribution, and retail space for products that fulfill nearly the same function. This redundancy leads to higher production and operating costs industry-wide. It also creates environmental and logistical inefficiencies, such as excess packaging waste or transport emissions, which could be reduced in a more centralized or coordinated market structure like perfect competition or monopoly.

Management Information System (MIS), Concept, Features, Components, Types, Process, Advantages and Disadvantages

Management Information System (MIS) is a computer-based system that provides managers with the tools to organize, evaluate, and efficiently manage departments within an organization. Its primary purpose is to transform raw data from Transaction Processing Systems (TPS) into structured, summarized reports to support tactical decision-making. MIS focuses on monitoring, controlling, and planning current operations by presenting historical data in routine, scheduled formats like dashboards, summary reports, and trend analyses. By delivering relevant, timely information on key performance indicators (KPIs), it empowers middle management to compare actual performance against targets, identify issues, and ensure the smooth, efficient running of the business.

Features of Management Information Systems (MIS):

1. Management-Oriented and Driven

The design and development of an MIS are top-down, initiated by the needs of management. The system is built with the explicit purpose of serving the information requirements of managers at various levels—strategic, tactical, and operational. This ensures that the system outputs (reports, dashboards) are tailored to support specific managerial functions like planning, controlling, and decision-making. It is not a byproduct of operational data but a deliberate architecture to provide actionable intelligence, making it an essential tool for directing organizational performance and achieving business objectives.

2. Integrated System from Disparate Sources

A core feature of MIS is its ability to integrate data from various functional departments and Transaction Processing Systems (TPS) across the organization. It consolidates inputs from finance, marketing, production, and human resources into a unified database. This breaks down information silos and provides a holistic, cross-functional view of the organization. Integration ensures consistency, eliminates data redundancy, and allows managers to see the interconnected impact of decisions across different units, fostering coordinated and aligned actions throughout the enterprise.

3. Timely and Scheduled Reporting

MIS is designed to provide information when it is needed, following a structured reporting schedule. It generates reports daily, weekly, monthly, or quarterly, ensuring managers receive consistent updates on performance metrics. While not always real-time like a TPS, its timeliness is aligned with managerial review cycles. For example, a weekly sales summary allows a regional manager to take corrective action promptly. This predictable, scheduled flow of information supports routine planning and control activities, enabling proactive rather than reactive management.

4. Exception-Based Reporting

Beyond standard summaries, a sophisticated MIS includes exception reporting. It is programmed to highlight significant deviations from planned performance or predefined thresholds. For instance, it can automatically flag a product line where sales have fallen 15% below target or a department that has exceeded its budget. This feature directs managerial attention to areas requiring immediate intervention, improving efficiency by allowing managers to focus on critical issues and exceptions rather than sifting through volumes of routine data.

5. Support for Structured and Semi-Structured Decisions

MIS primarily aids in making structured and semi-structured decisions at the tactical and operational levels. These are recurring decisions with known information requirements, such as inventory reordering, budget allocation, or staff scheduling. By providing summarized historical data and comparative analyses, MIS reduces uncertainty and provides a factual basis for these decisions. It supports “what-if” analysis for semi-structured scenarios, helping managers evaluate the potential outcomes of different choices within a defined framework.

6. Use of Internal and Historical Data

MIS primarily relies on internal, historical data sourced from the organization’s own TPS and databases. It processes and summarizes past transactions to identify trends, patterns, and performance over time. While some systems may incorporate limited external data (e.g., market indices), the focus is on leveraging internal records to assess efficiency, productivity, and compliance with internal plans and budgets. This inward-looking analysis is crucial for internal control and operational optimization.

7. User-Friendly Output and Presentation

Effective communication of information is key. MIS provides outputs in easily understandable formats for non-technical managers. This includes structured reports, graphical dashboards, charts, and summaries. The presentation is designed to highlight key metrics and trends at a glance, facilitating quick comprehension and decision-making. The focus is on transforming complex data sets into clear, actionable intelligence, making the system accessible and valuable to its primary users—the management team.

8. Flexibility and Future-Oriented Design

While based on historical data, a well-designed MIS is built with flexibility to adapt to changing information needs. It should allow for the generation of ad-hoc reports and be scalable to include new data sources or reporting modules as the business evolves. This future-oriented design ensures the system remains relevant, supporting not just current operational control but also aiding in the formulation of future plans and strategies based on analyzed trends.

Components of Management Information Systems (MIS):

1. Data Resources

The data resource is the foundational component of any MIS. It comprises the structured collection of internal transactional data from TPS, as well as relevant external data (market reports, competitor information). This data is stored, organized, and managed in databases and data warehouses. Its quality—accuracy, timeliness, and relevance—directly determines the value of the system’s output. The data resource is the raw material that the MIS transforms into meaningful information, making its effective governance and management critical for reliable reporting and analysis.

2. Hardware

Hardware refers to the physical technology infrastructure required to operate the MIS. This includes servers for processing and storing data, computers and workstations for user access, networking equipment (routers, switches) for internal connectivity, and data centers to house the equipment. The choice of hardware influences the system’s processing speed, storage capacity, reliability, and scalability. In modern contexts, this increasingly includes cloud infrastructure, where hardware resources are provided as a service, offering flexibility and reducing the need for large capital investments in physical assets.

3. Software

Software is the set of programs and applications that process data and generate information. This includes the Database Management System (DBMS) that organizes data, the application software for generating specific reports and dashboards, and analytical tools for data mining and querying. The software component dictates the system’s functionality, user interface, and ability to transform raw data into usable formats for managers. It acts as the “brain” of the MIS, executing the logic for summarization, comparison, and presentation.

4. Procedures

Procedures are the formalized rules and guidelines that define how the MIS is used and managed. This includes operational procedures for data entry, validation, and storage; guidelines for generating standard and ad-hoc reports; and protocols for system access, security, and backup. Clear, documented procedures ensure consistency, data integrity, and effective utilization of the system by both technical staff and end-users, turning technology into a reliable business process.

5. People

People are the most vital component, encompassing all human elements involved. This includes end-users (managers, executives) who consume the information to make decisions, technical specialists (system analysts, database administrators) who design, implement, and maintain the system, and support staff. The system’s success depends entirely on the skills, training, and acceptance of these individuals. Their ability to define information needs, interpret outputs, and act on insights determines the MIS’s ultimate value to the organization.

6. Communication Networks

Communication networks are the digital pathways that enable the flow of data between all other components. This includes Local Area Networks (LANs), Wide Area Networks (WANs), and internet connectivity. Networks allow for the collection of data from remote sources, provide access to centralized databases for distributed users, and facilitate the delivery of reports and dashboards to managers’ devices. Robust, secure networking is essential for ensuring timely, reliable, and accessible information across the organization.

7. Information Products (Output)

This component is the tangible result of the MIS—the reports, dashboards, alerts, and analyses delivered to management. These information products, such as sales summaries, performance scorecards, or budget variance reports, are tailored to support specific managerial functions. Their design—clarity, relevance, and timeliness—is critical. They represent the culmination of the entire system’s work, transforming processed data into actionable intelligence that informs planning, control, and decision-making.

8. Control and Feedback Mechanisms

A mature MIS incorporates feedback loops to monitor its own effectiveness and accuracy. Control mechanisms track whether the system is meeting managerial information needs and identify errors or gaps in data. User feedback on report relevance and system usability is collected to drive continuous improvement. This component ensures the MIS remains aligned with evolving business goals and adapts to new requirements, maintaining its role as a vital management tool.

Types of Information Systems


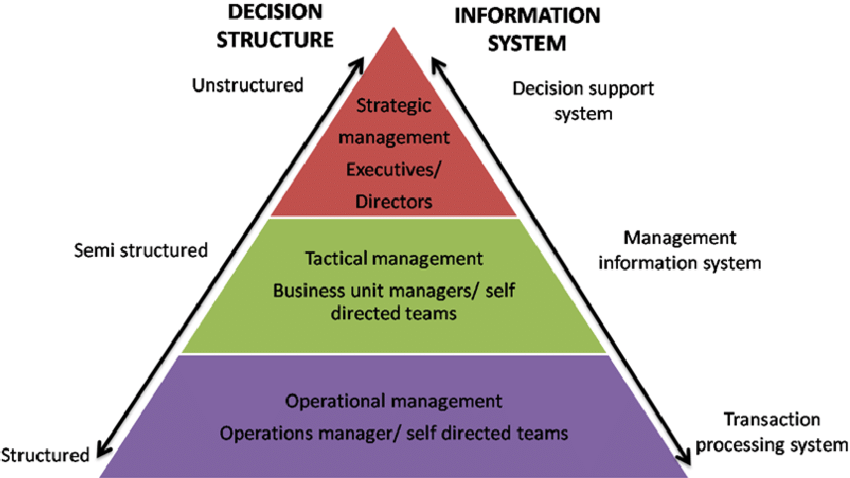
  1. Transaction Processing Systems (TPS): Used to record and manage day-to-day business transactions. An example is a Point of Sale (POS) system, which tracks daily sales.
  2. Management Information Systems (MIS): These systems guide middle-level managers in making semi-structured decisions. They use data from the Transaction Processing System as input.
  3. Decision Support Systems (DSS): Utilized by top-level managers for semi-structured decision-making. DSS systems receive data from the Management Information System and external sources like market forces and competitors.

Process of Management Information System (MIS):

1. Determination of Information Needs

The first step is a systematic analysis to define what information managers need to perform their roles effectively. This involves identifying key decision areas, strategic objectives, and performance indicators for different management levels. Questions like “What data is critical for inventory control?” or “Which KPIs does a sales head need weekly?” are answered. This stage aligns the MIS design directly with managerial requirements, ensuring the system delivers relevant, actionable intelligence rather than just raw data, and involves collaboration between end-users (managers) and system designers.

2. Data Collection and Input

This process involves gathering raw data from identified internal and external sources. Internally, data is sourced continuously from Transaction Processing Systems (TPS) across departments (sales, production, finance). Externally, data may be collected from market feeds, economic reports, or competitor analysis. This data is then validated and entered into the system’s databases. Accurate collection and error-free input are critical, as the quality of all subsequent information depends on the integrity of this foundational data.

3. Data Processing and Transformation

Here, the collected raw data is converted into meaningful information. This involves a series of operations: classification, sorting, calculating, summarizing, and aggregating. For instance, thousands of daily sales transactions are totaled into weekly revenue figures. Data is processed using predefined business rules and models. This transformation is the core function where disparate data points are synthesized into structured summaries, trends, and comparisons that managers can understand and use for decision-making.

4. Storage and Management of Processed Data

Processed information is organized and stored for immediate and future access. This involves managing databases or data warehouses where summarized data, historical trends, and performance metrics are retained. Effective storage ensures data integrity, security, and efficient retrieval. This stage creates an organizational memory—a repository of past performance and trends that managers can query to analyze historical patterns and support longitudinal analysis for planning.

5. Information Generation and Retrieval

In this stage, the system produces the required outputs for management. Based on scheduled needs or ad-hoc queries, the MIS retrieves stored data and formats it into standardized reports, dashboards, or graphical analyses. These outputs—such as a monthly profit & loss statement or a real-time inventory status dashboard—are tailored to the user’s role. The system must provide timely, accurate, and easily interpretable information that managers can retrieve on-demand to support their specific activities.

6. Dissemination and Distribution of Information

The generated information must be communicated effectively to the right managers at the right time. This process involves distributing reports via email, publishing them on intranet portals, or pushing alerts to mobile devices. Distribution protocols ensure that sensitive information reaches only authorized personnel. Efficient dissemination closes the loop, ensuring the intelligence produced by the MIS is delivered into the hands of decision-makers who can act upon it, thereby fulfilling the system’s primary purpose.

7. Utilization and Feedback for System Refinement

The final, cyclical stage involves managers actively using the information for planning, control, and decision-making. Their experience and the outcomes of their decisions generate critical feedback. This feedback on the information’s relevance, accuracy, timeliness, and format is communicated back to the MIS team. This input is used to continuously refine the system—adjusting data sources, processing rules, or report formats—ensuring the MIS evolves to meet changing managerial needs and remains a dynamic, valuable organizational tool.

Advantages of Management Information System (MIS):

1. Enhanced Decision-Making Efficiency

MIS transforms raw data into structured, summarized information, providing managers with a fact-based foundation for decisions. By delivering timely reports on key performance indicators (KPIs), budgets, and trends, it reduces reliance on intuition and guesswork. This leads to faster, more accurate, and confident decisions at tactical and operational levels. For example, a sales manager can quickly identify underperforming regions based on comparative reports and reallocate resources. The system minimizes uncertainty, allowing managers to focus on analysis and action rather than data collection and manual calculation.

2. Improved Operational Control and Planning

MIS serves as a vital tool for monitoring and controlling day-to-day operations. It provides regular performance reports that compare actual results against plans and budgets, highlighting variances. This enables managers to identify bottlenecks, inefficiencies, or deviations early and take corrective action promptly. Furthermore, by analyzing historical trends and current performance data, MIS supports effective short-term and medium-term planning, such as setting realistic sales targets or production schedules, ensuring resources are aligned with organizational goals.

3. Strategic Insight and Competitive Advantage

By integrating data from across the organization, MIS provides a holistic view of business performance and market position. Analysis of long-term trends, customer behavior, and operational efficiency can reveal strategic opportunities and threats. This insight helps senior management in formulating long-term strategies, such as entering new markets or discontinuing unprofitable products. A well-implemented MIS can thus become a source of sustainable competitive advantage by enabling proactive, data-driven strategy rather than reactive management.

4. Increased Organizational Efficiency and Coordination

MIS eliminates information silos by integrating data from all functional areas (finance, marketing, HR, production). This creates a single source of truth, improving coordination between departments. For instance, production can align output with sales forecasts, and procurement can plan based on inventory levels. Streamlined information flow reduces redundancy, minimizes errors, and accelerates processes. The resulting efficiency gains lower operational costs, improve resource utilization, and enhance the organization’s overall agility and responsiveness.

5. Better Communication and Collaboration

MIS acts as a centralized platform for information dissemination, standardizing communication across management levels. Reports and dashboards ensure all managers work from the same, up-to-date data set, fostering alignment and shared understanding. This transparency improves vertical and horizontal collaboration, as teams can easily access the information needed to coordinate projects and make interdependent decisions. Enhanced communication reduces conflicts stemming from misinformation and builds a more cohesive, informed organizational culture.

6. Cost Reduction and Resource Optimization

Automating the collection, processing, and reporting of management information significantly reduces administrative and clerical costs associated with manual report generation. MIS also enables data-driven resource optimization. By providing clear visibility into operations, it helps identify areas of waste, overstaffing, or underutilized assets. Managers can optimize inventory levels, streamline workflows, and improve workforce productivity, leading to direct bottom-line savings and a higher return on investment in both human and capital resources.

7. Support for Performance Management

MIS provides the objective data necessary for effective performance measurement and management. It tracks individual, departmental, and organizational KPIs, facilitating fair and transparent performance evaluations. This data supports management by objectives (MBO), helps in setting benchmarks, and identifies training or development needs. By linking performance data to outcomes, it motivates employees, aligns individual goals with corporate strategy, and creates a culture of accountability and continuous improvement.

Disadvantages of Management Information System (MIS):

1. Fast and Accurate Data Processing

Transaction Processing Systems handle a large number of business transactions quickly and without errors. They record sales, payments, payroll, and inventory updates in real time. In Indian banks and retail stores, TPS ensures every transaction is saved correctly. This reduces manual work and mistakes. Fast processing helps businesses serve customers better and keep records up to date. Accurate data also supports better reporting and decision making.

2. Improved Operational Efficiency

TPS automates routine business activities such as billing, order processing, and salary payments. This saves time and reduces paperwork. Indian companies use TPS in supermarkets, railway booking systems, and online payments. Automation allows employees to focus on more important tasks. As work becomes faster and smoother, overall business efficiency increases and operating costs reduce.

3. Better Record Keeping and Data Security

TPS stores transaction data in organized digital databases. Businesses can easily retrieve past records for audits, tax filing, and analysis. Indian firms benefit during GST reporting and financial reviews. Modern TPS also includes security features like passwords and access control to protect sensitive information. Proper record keeping improves transparency and trust.

4. Real Time Information Availability

TPS updates information instantly after every transaction. For example, when a product is sold, inventory levels change immediately. This helps managers track stock, cash flow, and customer activity in real time. Indian retail and logistics companies rely on real time data to avoid shortages and delays. Quick information supports better operational decisions.

Management Information System Role in Decision making Process:

1. Providing a Structured Factual Foundation

MIS transforms disparate, raw data from operational systems into organized, summarized information. It delivers structured reports on sales, inventory, finances, and productivity. This provides managers with a reliable, objective, and comprehensive factual base, replacing intuition or fragmented data with concrete evidence. By presenting clear metrics and historical trends, MIS eliminates ambiguity and establishes a shared truth, allowing managers to confidently frame problems and evaluate the current state of operations before proceeding with any analysis or choice.

2. Enabling Identification of Problems and Opportunities

Through routine and exception-based reporting, MIS acts as an early warning system. It highlights deviations from plans, such as a drop in regional sales, a cost overrun, or a spike in customer complaints. By systematically tracking KPIs, it helps managers identify negative trends (problems) and spot positive patterns (opportunities), such as an unexpectedly successful product line. This proactive identification ensures that decision-making is triggered by timely, data-driven insights rather than by crisis or chance, allowing for strategic intervention at the optimal moment.

3. Supporting the Generation and Evaluation of Alternatives

Once a problem or opportunity is identified, MIS aids in exploring solutions. It allows for “what-if” scenario analysis by modeling the potential outcomes of different courses of action. Managers can use historical data to simulate the impact of a price change, a new marketing spend, or a shift in production schedules. By providing predictive reports and comparative analyses, MIS helps generate viable alternatives and objectively evaluate their projected consequences on key metrics like revenue, cost, and market share, leading to more informed and rational choice selection.

4. Facilitating the Implementation of Decisions

After a decision is made, MIS plays a crucial role in translating the choice into actionable plans. It provides the detailed operational data needed to create implementation schedules, allocate budgets, and assign resources. For instance, launching a new product requires coordinated data from production capacity, inventory levels, and marketing budgets—all supplied by the MIS. By serving as the central information hub, it ensures all departments work from synchronized data, enabling clear communication of tasks and responsibilities for effective execution.

5. Enabling Monitoring, Control, and Feedback

Post-implementation, MIS is essential for tracking the results of the decision. It generates follow-up reports that measure actual performance against the expected outcomes defined during planning. This continuous monitoring allows managers to control the process, identify any implementation gaps or unforeseen issues, and make necessary mid-course corrections. The feedback loop created by this monitoring turns the decision-making process into a cycle of continuous improvement, where the results of past decisions inform and refine future ones.

Cost of Production

Cost of Production refers to the total expenditure incurred by a business in the process of producing goods or services. It includes the monetary value of all inputs used during production, such as raw materials, labor, machinery, utilities, and overheads. Understanding production costs is crucial for determining pricing, profitability, and operational efficiency.

Cost of production is a fundamental concept in both micro and macroeconomics. It helps firms evaluate resource allocation, set competitive prices, and measure profitability. Lower production costs often lead to a higher competitive edge in the market.

Cost of production serves as a cornerstone for analyzing business operations, planning budgets, and making long-term strategic decisions, especially in a competitive and dynamic business environment.

Concept of Costs:

The concept of costs refers to the monetary value of resources sacrificed or expenses incurred in the process of producing goods or services. In economics and business, cost is a fundamental concept that helps firms make informed decisions related to production, pricing, budgeting, and profitability.

Costs are broadly classified based on purpose and perspective:

1. Short-Run and Long-Run Costs

Short-run costs refer to the costs incurred when at least one factor of production is fixed. Typically, capital or plant size is fixed in the short run, while labor and raw materials are variable. As a result, businesses face both fixed and variable costs in the short run. Short-run cost behavior includes increasing or decreasing returns due to limited flexibility in resource adjustment.

Long-run costs are incurred when all factors of production are variable. In the long run, firms can change plant size, technology, and resource combinations to achieve optimal efficiency. There are no fixed costs in the long run. Long-run cost curves represent the least-cost method of producing each output level, and they are derived from short-run average cost curves.

Understanding these concepts helps firms make strategic decisions. In the short run, businesses focus on maximizing output with limited resources, while in the long run, they plan capacity expansion, technology upgrades, and cost minimization.

2. Average and Marginal Costs

Average Cost is the cost per unit of output, calculated by dividing the total cost (TC) by the number of units produced. It indicates the efficiency of production at various output levels and helps in pricing decisions. There are different types of average costs: average total cost, average fixed cost, and average variable cost.

Marginal Cost is the additional cost incurred by producing one more unit of output. It is calculated as the change in total cost when output increases by one unit. Marginal cost plays a crucial role in decision-making, especially in determining optimal production level. If the price of the product is greater than marginal cost, firms increase production; if it’s lower, they reduce it.

The relationship between average cost and marginal cost is important:

  • When MC is less than AC, AC falls.
  • When MC is greater than AC, AC rises.
  • When MC equals AC, AC is at its minimum.

These cost concepts help firms evaluate profitability, determine output levels, and set appropriate prices for sustainability and competitiveness.

3. Total, Fixed, and Variable Costs

Total Cost refers to the overall expense incurred in the production of goods or services. It is the sum of Fixed Costs (FC) and Variable Costs (VC).
TC = FC + VC

Fixed Costs are those costs that do not vary with the level of output. They remain constant even if production is zero. Examples include rent, salaries of permanent staff, and insurance. Fixed costs are unavoidable in the short run and must be paid regardless of production volume.

Variable Costs, on the other hand, change with the level of output. The more a firm produces, the higher the variable cost. Examples include raw materials, hourly wages, and utility charges. These costs are directly proportional to the quantity of production.

Understanding these components is critical for firms to analyze cost behavior and manage operations efficiently. Total cost helps in calculating average and marginal costs, which are essential for decision-making. Fixed costs highlight the burden a firm carries regardless of activity, while variable costs help in adjusting expenses according to production scale.

MC as change in TVC:

Marginal cost for the nth unit may be expressed as

Since fixed cost remains unchanged at all levels of output up to capacity we can write FC = FCn-1 in which case MC may be expressed as:

MCn = VCn – VCn-1

Thus marginal cost refers to marginal variable cost. In other words, MC has no relation to fixed cost.

National income Analysis and Measurement

National income refers to the total monetary value of all final goods and services produced within a country’s borders over a specific period, typically a year. It serves as a crucial indicator of a country’s economic performance and standard of living. In India, national income is measured using various methods, including the production approach, income approach, and expenditure approach.

A. Gross Domestic Product (GDP)

Gross Domestic Product (GDP) is the most commonly used measure of national income and represents the total value of all final goods and services produced within a country’s borders during a specified period, usually a year. In India, GDP is calculated using both production and expenditure approaches.

Key Features of GDP:

  • Domestic Focus: It includes only the goods and services produced within the country, regardless of the nationality of the producer.

  • Final Goods Only: It counts only final goods and services to avoid double counting (intermediate goods are excluded).

  • Market Value: Goods and services are evaluated at current market prices.

  • Time-bound: GDP is always measured over a specific time period (quarterly or annually).

  • Inclusive of All Sectors: It includes the output of the agriculture, industrial, and service sectors.

Methods of Calculating GDP:

There are three main methods to calculate GDP:

1. Production (Output) Method

  • Measures the total value added at each stage of production across all sectors.
  • GDP = Gross Value of Output – Value of Intermediate Consumption

2. Income Method

  • Sums up all incomes earned by factors of production (wages, rent, interest, profit).
  • GDP = Compensation to employees + Operating surplus + Mixed income

Expenditure Method

  • Adds up all expenditures made on final goods and services.
  • GDP = C + I + G + (X – M)
    Where:
    C = Consumption
    I = Investment
    G = Government Expenditure
    X = Exports
    M = Imports

Types of GDP:

1. Nominal GDP

  • Measured at current market prices, without adjusting for inflation.

  • It reflects price changes and not actual growth.

2. Real GDP

  • Adjusted for inflation or deflation.

  • Shows the true growth in volume of goods and services.

3. GDP at Market Price (GDPMP)

  • Includes indirect taxes and excludes subsidies.

4. GDP at Factor Cost (GDPFC)

  • GDPMP – Indirect Taxes + Subsidies

  • Reflects the income earned by the factors of production.

Significance of GDP:

  • Indicator of Economic Health: Higher GDP indicates a growing economy.

  • Comparison Tool: Enables comparison of economies across countries or time periods.

  • Policy Planning: Governments use GDP data to design fiscal and monetary policies.

  • Investment Decisions: Investors rely on GDP trends for market analysis and forecasting.

Limitations of GDP:

  • Ignores Income Distribution: Doesn’t show inequality or poverty levels.

  • Non-Market Activities Excluded: Housework or informal sector contributions are not counted.

  • Environmental Degradation: GDP growth may come at the cost of resource depletion.

  • Underground Economy: Unrecorded economic activities are not included.

Components of GDP:

In India, GDP is composed of several components, including:

  • Consumption (C)

Expenditure on goods and services by households, including spending on food, housing, healthcare, education, and other consumer goods.

  • Investment (I)

Expenditure on capital goods such as machinery, equipment, construction, and infrastructure, including both private and public sector investment.

  • Government Spending (G)

Expenditure by the government on goods and services, including salaries, public infrastructure, defense, and social welfare programs.

  • Net Exports (NX)

The difference between exports and imports of goods and services. A positive value indicates a trade surplus, while a negative value indicates a trade deficit.

Sectorial Composition of GDP:

India’s GDP is composed of several sectors:

  • Agriculture

This sector includes farming, forestry, fishing, and livestock, and contributes to food security, rural livelihoods, and raw material supply for industries.

  • Industry

The industrial sector encompasses manufacturing, mining, construction, and utilities. It drives economic growth, employment generation, and technological advancement.

  • Services

The services sector includes trade, transport, communication, finance, real estate, professional services, and government services. It accounts for a significant share of GDP and employment and plays a crucial role in supporting other sectors.

B. Gross National Product (GNP)

Gross National Product (GNP) is the total monetary value of all final goods and services produced by the residents (nationals) of a country in a given period (usually a year), regardless of where the production takes place—whether within the domestic economy or abroad.

In other words, GNP = GDP + Net Factor Income from Abroad (NFIA).

Net Factor Income from Abroad (NFIA) includes:

  • Income earned by residents abroad (wages, dividends, interest, etc.)

  • Minus income earned by foreigners within the domestic territory

GNP = GDP + (Income earned from abroad − Income paid to foreigners)

Key Characteristics of GNP:

  • Nationality-Based: Focuses on ownership, not geography. It includes income earned by citizens and businesses of a country, even if earned outside its borders.

  • Includes Net Factor Income: Takes into account factor incomes (wages, rent, interest, profits) earned internationally.

  • Reflects Economic Strength Globally: Measures a nation’s economic contribution globally, especially helpful for countries with high overseas employment or investments.

  • Measured Annually or Quarterly: Like GDP, GNP is also calculated over a specific time period.

Example to Understand GNP

Suppose:

  • India’s GDP = ₹250 lakh crore

  • Income earned by Indian citizens abroad = ₹15 lakh crore

  • Income earned by foreigners in India = ₹10 lakh crore

Then:

GNP = ₹250 + ₹15 − ₹10 = ₹255 lakh crore

Types of GNP:

  • GNP at Market Prices (GNPMP): Includes indirect taxes and excludes subsidies.

  • GNP at Factor Cost (GNPFC):

    GNP at Factor Cost = GN at Market Price − Indirect Taxes + Subsidies

Importance of GNP:

  • Measures National Income Globally: Indicates the economic strength of a nation including overseas activities.

  • Helps in Policy Formulation: Useful for countries with significant remittances or foreign business operations.

  • Comparative Analysis: Helpful for comparing resident income versus domestic production (GNP vs GDP).

  • Better Measure for Some Economies: For countries with many overseas workers (e.g., Philippines, India), GNP may reflect actual income inflow more accurately than GDP.

Limitations of GNP:

  • Neglects Domestic Productivity: May overstate or understate true economic strength if NFIA is volatile.

  • Difficulties in Measuring NFIA: Tracking international incomes can be inaccurate or delayed.

  • Not a Welfare Indicator: Like GDP, GNP doesn’t reflect inequality, environmental damage, or well-being.

  • Ignores Informal Economy: Unregistered businesses and informal work are excluded.

C. Net National Product (NNP)

Net National Product (NNP) is the monetary value of all final goods and services produced by the residents of a country in a given period (usually one year), after accounting for depreciation (also known as capital consumption allowance).

It is derived from Gross National Product (GNP) by subtracting the depreciation of capital goods.

NNP = GNP − Depreciation

Features of NNP:

  • Reflects Net Output: It shows the net production of an economy after maintaining the existing capital stock.

  • Depreciation-Adjusted: More accurate than GNP or GDP because it adjusts for capital consumption.

  • Residents’ Contribution: Includes production by nationals both domestically and abroad.

  • Indicates Sustainability: Provides insight into how sustainable a country’s production is over time.

Example

Let’s say:

  • GNP of a country = ₹280 lakh crore

  • Depreciation = ₹30 lakh crore

Then:

NNP = ₹280 − ₹30 = ₹250 lakh crore

If Indirect Taxes = ₹12 lakh crore, Subsidies = ₹2 lakh crore:

Then:

NNPFC = ₹250 − ₹12 + ₹2 = ₹240 lakh crore

This ₹240 lakh crore is also called the National Income.

D. Personal Income (PI)

Personal Income refers to the total income received by individuals or households in a country from all sources before the payment of personal taxes. It includes all earnings from wages, salaries, investments, rents, interest, and transfer payments such as pensions, unemployment benefits, and subsidies.

In simple terms, Personal Income is the income available to individuals before paying taxes, but after adding transfer incomes and excluding undistributed profits and other non-receivable incomes.

Formula to Calculate Personal Income

Personal Income = National Income − Corporate Taxes − Undistributed Corporate Profits + Transfer Payments

Where:

  • National Income (NI) is the total income earned by a country’s residents.
  • Corporate Taxes are taxes paid by companies on their profits.
  • Undistributed Corporate Profits are profits retained by companies.
  • Transfer Payments include pensions, subsidies, and social security benefits.

Components of Personal Income:

  • Wages and Salaries: Earnings from employment.

  • Rent: Income from letting out property or land.

  • Interest: Returns from savings or investments in bonds.

  • Dividends: Income from shares in corporations.

  • Transfer Payments: Pensions, unemployment benefits, welfare payments, etc.

  • Proprietors’ Income: Profits from unincorporated businesses.

Importance of Personal Income:

  • Indicator of Economic Well-Being: Personal Income reflects how much money people actually receive, indicating living standards and household purchasing power.
  • Guides Taxation Policies: Governments use PI to design progressive tax policies and to decide on tax brackets for individuals.
  • Helps in Consumption Analysis: Since consumption is closely linked with income, PI helps in forecasting demand patterns and consumer spending trends.
  • Useful in Social Welfare Planning: Helps to identify income disparities and plan welfare programs such as subsidies or unemployment benefits.

E. Personal Disposable Income (PDI)

Personal Disposable Income (PDI) refers to the amount of money left with individuals or households after paying all personal direct taxes such as income tax. It is the net income available for consumption and savings.

In simple terms, PDI = Personal Income – Personal Taxes.

It represents the real purchasing power of households and is a crucial indicator of consumer behavior and economic demand.

Components of PDI:

  • Wages and Salaries – After-tax income from employment.

  • Transfer Payments – Net of any taxes (e.g., pensions, unemployment benefits).

  • Investment Income – Interest, dividends, and rent received after taxes.

  • Proprietors’ Income – Profits earned by individuals in business, minus personal tax.

Importance of Personal Disposable Income:

  • Measures Purchasing Power: PDI directly reflects how much individuals can spend or save, making it a key driver of consumer demand in the economy.
  • Helps in Demand Forecasting: Analysts use PDI trends to predict changes in consumption patterns, which guide production and marketing strategies.
  • Supports Economic Planning: Government can design policies like stimulus packages or tax reliefs based on changes in PDI to boost spending.
  • Indicates Economic Welfare: Rising PDI is a sign of improved living standards, while declining PDI may indicate growing tax burdens or inflation effects.

F. Gross Value Added (GVA)

Gross Value Added (GVA) is a measure of the value added by various sectors of the economy in the production process. It represents the difference between the value of output and the value of intermediate consumption. GVA provides insights into the contribution of different sectors to the overall economy.

G. Gross National Income (GNI)

Gross National Income (GNI) measures the total income earned by a country’s residents, including both domestic and international sources. It includes GDP plus net income from abroad, such as remittances, interest, dividends, and other payments received from overseas.

H. Net National Income (NNI)

Net National Income (NNI) is derived from GNI by subtracting depreciation or the value of capital consumption. NNI reflects the net income generated by a country’s residents after accounting for the depreciation of capital assets.

I. Per Capita Income

Per Capita Income is calculated by dividing the total national income (such as GDP or GNI) by the population of the country. It represents the average income earned per person and serves as a measure of the standard of living and economic welfare.

Trends and Challenges:

India’s national income and its aggregates have witnessed significant growth and transformation over the years. However, the country faces various challenges:

  • Income Inequality

Disparities in income distribution persist, with a significant portion of the population facing poverty and economic deprivation.

  • Sectoral Disparities

There are wide gaps in development and productivity across different sectors and regions, with disparities between rural and urban areas.

  • Unemployment and Underemployment

India grapples with high levels of unemployment and underemployment, particularly among youth and marginalized communities.

  • Infrastructure Deficit

Inadequate infrastructure, including transportation, energy, and digital connectivity, hampers economic growth and competitiveness.

  • Environmental Sustainability

Rapid economic growth has led to environmental degradation, pollution, and resource depletion, necessitating sustainable development practices.

  • Policy Reforms

Structural reforms and policy initiatives are required to address bottlenecks, promote investment, boost productivity, and enhance competitiveness.

Government Initiatives:

The Indian government has introduced various policies and initiatives to promote economic growth, employment generation, and inclusive development:

  • Make in India

A flagship initiative aimed at boosting manufacturing, promoting investment, and enhancing competitiveness.

  • Digital India

A program focused on digital infrastructure, e-governance, and digital empowerment to drive technological advancement and digital inclusion.

  • Skill India

A skill development initiative aimed at enhancing the employability of the workforce and bridging the skills gap.

  • Pradhan Mantri Jan Dhan Yojana (PMJDY)

A financial inclusion program aimed at expanding access to banking services, credit, and insurance for marginalized communities.

  • Goods and Services Tax (GST)

A comprehensive indirect tax reform aimed at simplifying the tax structure, promoting transparency, and boosting tax compliance.

Methods of Measuring National Income

  • Product Approach

In product approach, national income is measured as a flow of goods and services. Value of money for all final goods and services is produced in an economy during a year. Final goods are those goods which are directly consumed and not used in further production process. In our economy product approach benefits various sectors like forestry, agriculture, mining etc to estimate gross and net value.

  • Income Approach

In income approach, national income is measured as a flow of factor incomes. Income received by basic factors like labor, capital, land and entrepreneurship are summed up. This approach is also called as income distributed approach.

  • Expenditure Approach

This method is known as the final product method. In this method, national income is measured as a flow of expenditure incurred by the society in a particular year. The expenditures are classified as personal consumption expenditure, net domestic investment, government expenditure on goods and services and net foreign investment.

These three approaches to the measurement of national income yield identical results. They provide three alternative methods of measuring essentially the same magnitude.

Meaning, Nature and Scope of Economics

Economics is a social science that studies how individuals, businesses, and governments allocate limited resources to satisfy unlimited wants. It deals with the production, distribution, and consumption of goods and services. The core focus of economics is the problem of scarcity—resources such as land, labor, and capital are limited, while human desires are endless. This mismatch forces societies to make choices about what to produce, how to produce, and for whom to produce.

Economics is broadly divided into two branches: Microeconomics and Macroeconomics. Microeconomics examines individual units like consumers, firms, and markets, focusing on demand, supply, and price determination. Macroeconomics, on the other hand, analyzes the economy as a whole, dealing with national income, inflation, unemployment, and economic growth.

Economics also involves studying incentives and behaviors. It tries to explain how people respond to changes in prices, income, and government policies. For example, if the price of a good rises, demand may fall—this behavioral aspect is central to economic analysis.

Modern economics is applied across various fields such as healthcare, finance, environmental studies, and business strategy. It aids in policy formulation, business planning, and efficient resource utilization.

In essence, economics provides the tools to understand and respond to complex real-world issues, making it essential for making informed decisions in both personal and professional contexts.

Nature of Economics:

  • Economics as a Social Science

Economics is considered a social science because it studies human behavior in relation to the allocation of scarce resources. Like other social sciences, it analyzes patterns, choices, and decisions people make under constraints. Economics deals with real-life issues such as consumption, production, employment, and trade. It uses scientific methods to study human actions in the economic domain and formulates theories based on observation and reasoning to understand how people respond to incentives and constraints.

  • Study of Scarcity and Choice

Economics centers around the problem of scarcity, which arises due to limited resources and unlimited wants. Because not all desires can be satisfied, individuals and organizations must make choices. Economics studies how these choices are made and how resources are allocated efficiently. This nature of economics is vital in understanding trade-offs, prioritization, and opportunity costs. It helps determine the best use of available resources to maximize utility, output, or welfare.

  • Economics is Both a Science and an Art

Economics is a science because it develops principles and laws based on systematic observations, analysis, and logic. It explains cause-and-effect relationships in economic phenomena. Simultaneously, economics is also an art as it involves the practical application of knowledge to achieve economic objectives such as reducing poverty or controlling inflation. It guides individuals, businesses, and governments in decision-making and problem-solving, making it both theoretical and practical in nature.

  • Economics is Dynamic

Economics is not static—it evolves with changes in social, political, and technological environments. As consumer preferences, market conditions, and resource availability change, economic theories and practices also adapt. This dynamic nature makes economics relevant across eras, allowing it to address emerging issues like digital currencies, climate change, and global pandemics. It responds to current challenges and continuously redefines strategies for efficient economic management and sustainable development.

  • Economics is Normative and Positive

Economics has both positive and normative aspects. Positive economics deals with facts and describes what is happening in the economy—like “an increase in interest rates reduces borrowing.” Normative economics, on the other hand, involves value judgments—such as “the government should increase healthcare spending.” The nature of economics lies in balancing both perspectives: it explains real-world situations and suggests what ought to be done for better societal outcomes.

  • Economics is Concerned with Human Welfare

A core nature of economics is its concern for human welfare. Classical and modern economists view economics not just as a wealth-generating activity but also as a means to enhance the standard of living. It studies how resources can be allocated efficiently to fulfill basic needs, reduce inequality, and improve social well-being. Development economics, for example, focuses on uplifting poor communities through policy reforms and sustainable economic strategies.

  • Economics is Abstract and Quantitative

Economics often uses abstract models and assumptions to simplify complex real-world situations. Concepts like demand curves, equilibrium, and elasticity are built on theoretical frameworks. At the same time, economics is quantitative—it uses data, statistics, and mathematical tools to analyze trends and forecast outcomes. This dual nature of being both conceptual and measurable helps economists evaluate policies and make informed decisions based on empirical evidence.

  • Universal Applicability of Economics

The principles of economics apply universally across individuals, businesses, industries, and nations. Whether in a household managing a monthly budget or a multinational corporation planning global investments, economic reasoning is essential. From pricing strategies to resource allocation, the scope of economics covers all levels of decision-making. Its universal applicability makes it a valuable tool for solving diverse problems in finance, governance, marketing, and international trade.

Scope of Economics:

  • Consumption

Consumption is a fundamental area in the scope of economics. It deals with how individuals and households use goods and services to satisfy their wants. Economics studies consumer behavior, utility maximization, and demand patterns. Understanding consumption helps businesses predict buying behavior, while governments use this knowledge to design tax policies and welfare programs. Consumption analysis explains how income, price changes, and preferences affect demand and is crucial for pricing, production planning, and marketing strategies.

  • Production

Production involves the transformation of inputs (land, labor, capital, entrepreneurship) into output. Economics examines how these resources are combined efficiently to maximize output and profits. It also studies the laws of production, economies of scale, and production functions. The scope of production analysis helps businesses in cost minimization, resource allocation, and technology adoption. Efficient production is key to competitiveness and sustainability in business operations and national economic growth.

  • Distribution

Distribution refers to how income and wealth are shared among the factors of production—landowners, laborers, capitalists, and entrepreneurs. Economics studies how wages, rent, interest, and profits are determined. The fairness and efficiency of income distribution impact economic stability, social equity, and standard of living. Understanding distribution helps policymakers address inequality through taxation, welfare schemes, and labor laws. For businesses, it affects cost structures, employee compensation, and investment decisions.

  • Exchange

Exchange is the process by which goods and services are traded. Economics explores market structures (perfect competition, monopoly, oligopoly), pricing mechanisms, and trade practices. It helps understand how value is determined, how markets operate, and how supply meets demand. Exchange analysis guides businesses in setting prices, identifying competitors, and evaluating market opportunities. It also includes the role of money, banking, and credit systems in facilitating smooth transactions.

  • Public Finance

Public finance falls within the scope of economics by analyzing government income and expenditure. It includes taxation, public spending, budgeting, and debt management. Economics studies how government policies affect economic growth, inflation, employment, and income distribution. It provides tools to evaluate the impact of fiscal policies on the economy. Businesses are also affected by public finance through taxation policies, subsidies, infrastructure development, and government procurement strategies.

  • Economic Growth and Development

Economics examines both short-term growth and long-term development. Growth refers to an increase in national income, while development includes improvements in health, education, infrastructure, and living standards. Economics studies factors that promote or hinder development, such as investment, innovation, political stability, and resource management. This area is essential for policymakers and global institutions to create strategies for poverty reduction, inclusive growth, and sustainable development.

  • International Trade and Economics

International trade is a vital part of economics that deals with the exchange of goods, services, and capital across borders. It studies comparative advantage, trade policies, tariffs, exchange rates, and global economic organizations like WTO and IMF. Understanding international economics helps countries and businesses develop trade strategies, expand markets, and respond to global economic shifts. It also explains the effects of globalization, balance of payments, and international competition.

  • Economic Planning and Policy Making

Economics provides the foundation for policy formulation and planning at national and organizational levels. It assists governments in framing monetary, fiscal, and industrial policies based on economic objectives. It also helps businesses in strategic planning, risk analysis, and market forecasting. This area includes planning resource allocation, managing economic cycles, and addressing social challenges. Economics thus plays a critical role in achieving stability, growth, and sustainable development.

Consumer Behaviour, Meaning, Nature, Determinants, Importance and Challenges

Consumer behaviour refers to the study of how individuals, groups, or organizations select, buy, use, and dispose of goods, services, ideas, or experiences to satisfy their needs and wants. It involves understanding the decision-making processes of buyers, both individually and collectively, and how various internal and external factors influence their purchasing decisions.

Consumer behaviour is influenced by several psychological, personal, social, and cultural factors. These include motivation, perception, learning, personality, lifestyle, income, family, reference groups, and cultural background. For example, a consumer’s preference for a brand can be shaped by past experiences, advertisements, peer recommendations, or current trends.

The study of consumer behaviour is essential for businesses and marketers because it helps them understand what drives customer choices. It enables companies to design better products, tailor marketing strategies, set appropriate pricing, choose effective distribution channels, and enhance customer satisfaction. By analyzing consumer behaviour, businesses can also forecast demand, segment markets accurately, and gain a competitive edge.

In modern times, consumer behaviour is dynamic and continuously evolving due to digital transformation, rising consumer awareness, and socio-economic shifts. Businesses must keep track of changing consumer patterns to remain relevant and responsive to market needs.

In essence, consumer behaviour is at the heart of all marketing activities, helping businesses connect their offerings to what customers truly value.

Nature of Consumer Behaviour

  • Complex Process

Consumer behavior is a complex process involving multiple psychological and social factors that influence decision-making. Consumers do not simply purchase products; they go through several stages, including need recognition, information search, evaluation of alternatives, purchase decision, and post-purchase behavior. The complexity arises due to varying individual preferences, motivations, cultural influences, and situational factors, making it challenging for businesses to predict consumer actions accurately.

  • Influenced by Various Factors

Consumer behavior is influenced by personal, psychological, social, and cultural factors. Personal factors include age, gender, and lifestyle, while psychological factors involve perception, learning, and attitudes. Social influences like family, reference groups, and social class also play a role. Additionally, cultural factors such as values, traditions, and societal norms shape consumer preferences and buying decisions.

  • Dynamic in Nature

Consumer behavior is dynamic and constantly evolving due to changes in personal preferences, technology, lifestyle, and market trends. New products, innovations, and marketing strategies influence consumer preferences over time. Additionally, external factors like economic conditions and societal shifts can alter consumer priorities, making it essential for businesses to stay updated and adapt to changing consumer needs.

  • Goal-Oriented

Consumers exhibit goal-oriented behavior, meaning their purchasing decisions are driven by the desire to fulfill specific needs or achieve certain outcomes. These needs may be functional, emotional, or symbolic. For instance, a consumer may buy a product for its practical utility, to gain emotional satisfaction, or to express social status. Understanding these goals helps marketers design better value propositions.

  • Varies Across Individuals

Consumer behavior varies greatly from person to person due to differences in personality, preferences, and socio-economic background. While some consumers may prioritize price, others might focus on quality, brand reputation, or convenience. This variability necessitates market segmentation and personalized marketing approaches to cater to different consumer groups effectively.

  • Involves Decision-Making

Consumer behavior involves a decision-making process where consumers evaluate various alternatives before making a final purchase. This process includes identifying needs, gathering information, comparing options, and making choices. Post-purchase evaluation, where consumers assess whether their expectations were met, is also a critical aspect. Businesses need to understand this process to influence decision-making positively.

  • Reflects Social Influence

Consumer behavior often reflects the influence of social factors such as family, friends, peer groups, and society at large. People tend to seek social acceptance and approval in their purchasing decisions. Word-of-mouth recommendations, social media, and online reviews have a significant impact on consumer behavior, making social influence a critical element in marketing strategies.

  • Varies by Product Type

Consumer behavior differs depending on the type of product or service being purchased. For high-involvement products like cars or electronics, consumers spend more time researching and comparing options. In contrast, low-involvement products like daily essentials involve quick decision-making. Understanding this distinction helps businesses tailor their marketing efforts to suit different product categories.

  • Influenced by Perception

Perception plays a significant role in consumer behavior, as individuals form subjective opinions about products and brands based on how they interpret information. Factors such as advertising, packaging, branding, and word-of-mouth shape consumer perceptions. Even if two products offer similar value, consumers may choose the one they perceive as superior due to effective marketing.

  • Leads to Customer Satisfaction

The ultimate goal of consumer behavior is to achieve customer satisfaction. When consumers feel that a product or service meets or exceeds their expectations, they experience satisfaction, leading to brand loyalty and repeat purchases. Conversely, dissatisfaction can result in negative reviews and lost customers. Understanding consumer behavior allows businesses to create offerings that maximize satisfaction and long-term relationships.

Individual Determinants of Consumer Behaviour

  • Motivation

Motivation is the internal driving force that stimulates consumers to take action to satisfy their needs and wants. It arises when there is a gap between the actual state and the desired state. For example, hunger motivates the purchase of food, while the need for social status motivates luxury purchases. Theories like Maslow’s Hierarchy of Needs explain how motivation ranges from basic physiological needs to higher-level needs like esteem and self-actualization. Marketers tap into these motives by linking products with need satisfaction. Strong motivation increases involvement and purchasing urgency, while weak motivation delays decisions. Hence, motivation is a critical determinant that guides consumer choices and influences brand preference.

  • Perception

Perception refers to how consumers select, organize, and interpret information to form a meaningful picture of the world. It is not just about receiving stimuli but also about how individuals process and interpret them. For example, two consumers may view the same advertisement differently—one finds it attractive while the other ignores it. Perception is influenced by factors such as selective attention, selective distortion, and selective retention. Marketers must ensure their messages are clear, credible, and engaging to shape favourable perceptions. Since perception determines how consumers see product quality, price, and brand image, it plays a key role in influencing purchase behaviour and loyalty.

  • Learning

Learning in consumer behaviour refers to the changes in an individual’s behaviour resulting from past experiences, information, and practice. When consumers buy a product and are satisfied, they tend to repeat the purchase, which forms a habit over time. Conversely, negative experiences lead to avoidance. Learning occurs through processes such as classical conditioning, operant conditioning, and cognitive learning. For instance, repeated exposure to a brand with positive reinforcement (discounts, rewards) increases preference. Marketers use this determinant by creating associations between their products and positive experiences, ensuring consistent quality, and running loyalty programs. Learning shapes brand loyalty and simplifies decision-making in future purchases.

  • Personality

Personality is the unique set of psychological traits, characteristics, and behavioural patterns that influence how consumers respond to situations. Traits such as dominance, sociability, self-confidence, or creativity affect buying decisions. For example, extroverted consumers may prefer fashionable clothing or social activities, while introverts may prioritize books or digital gadgets. Marketers often link products to specific personality types, positioning brands as adventurous, sophisticated, or reliable. Personality is also stable over time, which allows businesses to segment markets based on personality traits. Understanding consumer personality helps marketers predict preferences, design appealing campaigns, and develop products that resonate with specific personality-driven lifestyles.

  • Attitudes

Attitudes are learned predispositions that reflect how consumers think, feel, and behave toward products, brands, or services. They consist of three components: cognitive (beliefs and knowledge), affective (emotions and feelings), and conative (behavioural intentions). For example, a consumer may believe a smartphone brand is innovative (cognitive), feel excited about it (affective), and decide to purchase it (conative). Attitudes are formed over time through experiences, word-of-mouth, and marketing influences. Since they are relatively consistent, they strongly influence buying behaviour. Marketers often use attitude-change strategies through persuasive communication, rebranding, or promotional campaigns to modify unfavourable attitudes and reinforce positive ones to build long-term loyalty.

  • Personality and SelfConcept

Beyond personality traits, the self-concept (how individuals perceive themselves) also affects consumer behaviour. Consumers buy products that reflect or enhance their self-image. For instance, a consumer with a strong self-image as eco-friendly prefers sustainable products. Self-concept includes the actual self (who the consumer thinks they are), ideal self (who they aspire to be), and social self (how they want others to see them). Marketers use this determinant by designing products that align with consumers’ self-expression and identity. Luxury brands, fitness products, and fashion items often appeal to this psychological factor, making it a powerful driver of preference and brand connection.

  • Culture

Culture is the most fundamental external determinant of consumer behaviour. It represents shared values, beliefs, customs, traditions, and lifestyles that shape consumer preferences and buying decisions. For example, in India, cultural values influence food habits, clothing choices, and festival shopping. Culture determines what is considered acceptable or desirable in society. Subcultures—based on religion, region, or ethnicity—further affect buying patterns. Marketers must design culturally sensitive products and campaigns to connect with diverse audiences. For instance, global brands often customize advertisements for Indian festivals like Diwali or Eid. Thus, culture guides long-term buying behaviour by shaping consumer priorities, needs, and perceptions of value.

  • Social Class

Social class refers to the hierarchical divisions in society based on income, education, occupation, and lifestyle. It influences consumer preferences, product choices, and spending patterns. Higher social classes often purchase luxury goods, premium brands, and services that display status, while middle or lower classes focus on value-for-money and functional products. For example, affluent consumers may prefer designer clothes, while working-class buyers prioritize affordability. Social class also affects brand loyalty and shopping behaviour, such as preference for high-end malls or local markets. Marketers use class segmentation to position products differently for premium, mid-range, and budget customers, ensuring appeal across social groups.

  • Family

Family plays a critical role in shaping consumer behaviour, as it influences purchasing decisions from childhood to adulthood. Parents, spouses, and children often act as decision-makers, influencers, or buyers. For example, children influence food, toys, and gadget purchases, while spouses decide on financial products, furniture, or vacations. Family life cycle stages (bachelorhood, married with kids, retired) also affect buying patterns, with needs changing over time. Marketers design campaigns targeting family roles, such as “family packs” or advertisements showing parents and children together. Since family values strongly affect consumption, businesses that connect with family needs build stronger emotional bonds with consumers.

  • Reference Groups

Reference groups are groups of people that individuals look up to for opinions, approval, or guidance. They include friends, colleagues, celebrities, or social influencers who shape buying behaviour by creating trends or social pressure. For example, if peers purchase the latest smartphone, others may follow to maintain social acceptance. Reference groups are classified as primary groups (close family and friends), secondary groups (colleagues, professional groups), aspirational groups (celebrities, influencers), and dissociative groups (those we avoid). Marketers often use celebrity endorsements, influencer marketing, and peer testimonials to appeal to consumers. Reference groups strongly affect youth behaviour, fashion trends, and lifestyle choices.

  • Social Factors

Social factors include broader influences such as roles, status, and peer interactions that affect how individuals consume products. Each person plays different roles in life—such as student, professional, or parent—and their purchases reflect those roles. For instance, a corporate manager may buy formal suits to reflect professional status, while the same person may buy casual wear for leisure. Status is another driver; consumers often purchase brands that signify prestige. For example, luxury watches or high-end cars symbolize higher social standing. Marketers target these factors by designing products that align with roles and highlight prestige value, encouraging status-driven purchases.

Importance of Consumer Behaviour

  • Understanding Consumer Needs and Wants

The study of consumer behaviour helps marketers understand the needs, wants, preferences, and expectations of consumers. By analyzing buying motives, attitudes, and decision-making patterns, businesses can identify what consumers actually want. This understanding enables firms to design products and services that effectively satisfy customer needs, leading to higher customer satisfaction and better acceptance in the market.

  • Effective Product Planning and Development

Consumer behaviour plays a vital role in product planning and development. Knowledge of consumer preferences, tastes, and usage patterns helps marketers decide product features, quality, design, packaging, and branding. Products developed on the basis of consumer behaviour research are more likely to succeed because they closely match customer expectations and deliver greater value.

  • Better Pricing Decisions

An understanding of consumer behaviour assists marketers in setting appropriate prices. Consumer reactions to price changes, price sensitivity, and perceived value influence pricing strategies. By studying consumer behaviour, firms can adopt suitable pricing methods such as psychological pricing, competitive pricing, or value-based pricing, ensuring both customer acceptance and profitability.

  • Effective Promotion and Communication

Consumer behaviour analysis helps in designing effective promotional strategies. Understanding how consumers perceive advertisements, what messages attract attention, and which media they prefer allows marketers to communicate more effectively. Promotional efforts become more persuasive and meaningful when they are aligned with consumer attitudes, beliefs, and buying motives.

  • Market Segmentation and Targeting

The study of consumer behaviour is essential for market segmentation and targeting. Consumers differ in age, income, lifestyle, personality, and preferences. By analyzing these differences, marketers can divide the market into meaningful segments and target specific groups with customized marketing strategies. This improves marketing efficiency and customer satisfaction.

  • Predicting Market Trends

Consumer behaviour helps marketers predict changes in market demand and consumer preferences. By studying buying patterns and consumption trends, firms can anticipate future needs and adjust their strategies accordingly. This ability to forecast demand reduces business risk and helps companies stay ahead of competitors in a dynamic market environment.

  • Enhancing Customer Satisfaction and Loyalty

Understanding consumer behaviour enables firms to satisfy customers more effectively. When products and services meet or exceed consumer expectations, customer satisfaction increases. Satisfied customers become loyal customers, leading to repeat purchases and positive word-of-mouth. Consumer behaviour thus plays a key role in building long-term customer relationships.

  • Competitive Advantage and Business Growth

The study of consumer behaviour provides firms with a competitive advantage. Businesses that understand consumers better than competitors can design superior products, effective promotions, and better services. This leads to increased market share, strong brand image, and sustainable business growth in the long run.

Challenges of Consumer Behaviour

  • Complexity of Consumer Needs

Consumers have diverse and complex needs that vary across individuals and situations. A single product may cater to different needs for different people. For instance, one consumer may buy a car for luxury, while another buys it for utility. Understanding and predicting these multifaceted needs is a significant challenge for marketers aiming to create products that satisfy varying consumer expectations.

  • Rapidly Changing Preferences

Consumer preferences evolve rapidly due to factors like technological advancements, societal trends, and exposure to global cultures. What is popular today may become obsolete tomorrow. Keeping up with these changing preferences requires businesses to be highly adaptable and continuously innovate to meet new demands. Failing to do so can result in losing relevance in the market.

  • Influence of Social and Cultural Factors

Social and cultural factors greatly influence consumer behavior. These factors differ significantly across regions, making it challenging for global businesses to design universally appealing marketing strategies. For example, a product that is successful in one country may not resonate in another due to cultural differences. Understanding and respecting these nuances is critical for market success.

  • Impact of Psychological Factors

Consumer behavior is heavily influenced by psychological elements such as perception, motivation, attitudes, and beliefs. These factors are subjective and vary widely among individuals, making it difficult for marketers to generalize behaviors. Additionally, psychological factors are often subconscious, further complicating efforts to predict or influence consumer actions.

  • Information Overload

In today’s digital age, consumers are bombarded with information from multiple sources, including advertisements, social media, and peer reviews. This information overload makes it harder for businesses to capture and retain consumer attention. Moreover, consumers may struggle to process all the information, leading to unpredictable buying behavior.

  • Increasing Consumer Expectations

With the availability of numerous alternatives and personalized offerings, consumer expectations have risen significantly. Modern consumers demand high-quality products, exceptional service, and unique experiences. Meeting these elevated expectations requires businesses to continuously improve their offerings, which can be resource-intensive and difficult to sustain.

  • Influence of Technology

Technology has transformed how consumers interact with businesses. From online shopping to social media engagement, digital platforms have created new avenues for consumer behavior. However, this has also increased the complexity of tracking and understanding consumer preferences across multiple channels. Businesses must invest in advanced analytics to gain insights into online consumer behavior.

  • Brand Loyalty vs. Switching Behavior

Building brand loyalty is a key objective for businesses, but it has become more challenging due to increased competition and abundant choices. Consumers can easily switch to competitors if they find better value elsewhere. Marketers must constantly engage consumers and deliver superior value to retain loyalty while addressing switching behavior effectively.

  • Ethical and Sustainable Consumption

Modern consumers are increasingly concerned about ethical and sustainable practices. They prefer brands that prioritize environmental and social responsibility. Businesses face the challenge of aligning their operations with these values while maintaining profitability. Additionally, they must communicate their efforts effectively to gain consumer trust.

  • Difficulty in Segmenting Markets

Effective market segmentation is essential for targeted marketing, but it is not always easy to implement. Consumer behavior can vary within segments due to individual differences, making it hard to identify homogeneous groups. Moreover, segments may overlap, requiring businesses to adopt complex, multi-segment strategies for better targeting.

error: Content is protected !!