Statement of comprehensive income

The statement of comprehensive income is a financial statement that summarizes both standard net income and other comprehensive income (OCI). The net income is the result obtained by preparing an income statement. Whereas, other comprehensive income consists of all unrealized gains and losses on assets that are not reflected in the income statement.  It is a more robust document that often is used by large corporations with investments in multiple countries.

Comprehensive income is the variation in a company’s net assets from non-owner sources during a specific period. Comprehensive income includes net income and unrealized income, such as unrealized gains or losses on hedge/derivative financial instruments and foreign currency transaction gains or losses. Comprehensive income provides a holistic view of a company’s income not fully captured on the income statement.

Components Comprehensive Income

One of the most important components of the statement of comprehensive income is the income statement. It summarizes all the sources of revenue and expenses, including taxes and interest charges.

Unfortunately, net income only accounts for the earned income and incurred expenses. There are times when companies have accrued gains or losses resulting from the fluctuations in the value of their assets, that are not recognized in net income. Some examples of these unrealized gains or losses are:

  • Adjustments made to foreign currency transactions
  • Gains or losses from pension and other retirement programs
  • Gains or losses from derivative instruments
  • Unrealized gains or losses from available-for-sale securities
  • Unrealized gains or losses from debt securities

One thing to note is that these items rarely occur in small and medium-sized businesses. OCI items occur more frequently in larger corporations that encounter such financial events.

That said, the statement of comprehensive income is computed by adding the net income which is found by summing up the recognized revenues minus the recognized expenses to other comprehensive income, which captures any unrealized balance sheet gains or losses that are excluded from the income statement.

Uses of a Statement of Comprehensive Income

As explained earlier, the statement of comprehensive income encompasses the income statement and other comprehensive income. Preparing the income statement sheds light on a company’s financial events. Here are some of the uses of an income statement:

Analysis tool for investors

The SCI, as well as the income statement, are financial reports that investors are interested in evaluating before they decide to invest in a company. The statements show the earnings per share or the net profit and how it’s distributed across the outstanding shares. The higher the earnings for each share, the more profitable it is to invest in that business.

Detailed revenue information

The primary purpose of an income statement is to provide information on how a company is raising its revenue and the costs incurred in doing so. The income statement is very thorough in highlighting these details. Not only does it explain the cost of goods sold, which relate to the operating activities, but it also includes other unrelated costs such as taxes. Similarly, the income statement captures other sources of revenue which are not associated with the main operations of a company. This entails items such as the accrued interest from business investments.

Limitations of a Statement of Comprehensive Income

Difficulties in making predictions

Another area where the income statement falls short is the fact that it cannot predict a firm’s future success. The income statement will show year over year operational trends, however, it will not indicate the potential or the timing of when large OCI items will be recognized in the income statement.

Misrepresentation

Although the income statement is a go-to document for assessing the financial health of a company, it falls short in a few aspects. The income statement encompasses both the current revenues resulting from sales and the accounts receivables, which the firm is yet to be paid.

Similarly, it highlights both the present and accrued expenses that the company is yet to pay. But if there’s a large unrealized gain or loss embedded in the assets or liabilities of a company, it could affect the future viability of the company drastically. Therefore, an income statement on its own can be misleading.

System Development Life Cycle

An effective System Development Life Cycle (SDLC) should result in a high quality system that meets customer expectations, reaches completion within time and cost evaluations, and works effectively and efficiently in the current and planned Information Technology infrastructure.

In systems engineering, information systems and software engineering, the software development life cycle (SDLC), also referred to as the application development life-cycle, is a process for planning, creating, testing, and deploying an information system. The systems development life cycle concept applies to a range of hardware and software configurations, as a system can be composed of hardware only, software only, or a combination of both.[2] There are usually six stages in this cycle: requirement analysis, design, development and testing, implementation, documentation, and evaluation.

System Development Life Cycle (SDLC) is a conceptual model which includes policies and procedures for developing or altering systems throughout their life cycles.

SDLC is used by analysts to develop an information system. SDLC includes the following activities:

  • Requirements
  • Design
  • Implementation
  • Testing
  • Deployment
  • Operations
  • Maintenance

Phases of SDLC

Systems Development Life Cycle is a systematic approach which explicitly breaks down the work into phases that are required to implement either new or modified Information System.

Feasibility Study or Planning

  • Define the problem and scope of existing system.
  • Overview the new system and determine its objectives.
  • Confirm project feasibility and produce the project Schedule.
  • During this phase, threats, constraints, integration and security of system are also considered.
  • A feasibility report for the entire project is created at the end of this phase.

Analysis and Specification

  • Define the requirements and prototypes for new system.
  • Gather, analyze, and validate the information.
  • Evaluate the alternatives and prioritize the requirements.
  • Examine the information needs of end-user and enhances the system goal.
  • A Software Requirement Specification (SRS) document, which specifies the software, hardware, functional, and network requirements of the system is prepared at the end of this phase.

System Design

  • Transform the SRS document into logical structure, which contains detailed and complete set of specifications that can be implemented in a programming language.
  • Includes the design of application, network, databases, user interfaces, and system interfaces.
  • Create a contingency, training, maintenance, and operation plan.
  • Review the proposed design. Ensure that the final design must meet the requirements stated in SRS document.
  • Finally, prepare a design document which will be used during next phases.

Implementation

  • Combine all the modules together into training environment that detects errors and defects.
  • Implement the design into source code through coding.
  • A test report which contains errors is prepared through test plan that includes test related tasks such as test case generation, testing criteria, and resource allocation for testing.
  • Integrate the information system into its environment and install the new system.

Maintenance/Support

  • Implement the changes that software might undergo over a period of time, or implement any new requirements after the software is deployed at the customer location.
  • Include all the activities such as phone support or physical on-site support for users that is required once the system is installing.
  • It also includes handling the residual errors and resolve any issues that may exist in the system even after the testing phase.
  • Maintenance and support may be needed for a longer time for large systems and for a short time for smaller systems.

Data Visualization

Data visualization is an interdisciplinary field that deals with the graphic representation of data. It is a particularly efficient way of communicating when the data is numerous as for example a time series.

Data visualization is the graphical representation of information and data. By using visual elements like charts, graphs, and maps, data visualization tools provide an accessible way to see and understand trends, outliers, and patterns in data.

From an academic point of view, this representation can be considered as a mapping between the original data (usually numerical) and graphic elements (for example, lines or points in a chart). The mapping determines how the attributes of these elements vary according to the data. In this light, a bar chart is a mapping of the length of a bar to a magnitude of a variable. Since the graphic design of the mapping can adversely affect the readability of a chart, mapping is a core competency of Data visualization.

Data visualization has its roots in the field of Statistics and is therefore generally considered a branch of Descriptive Statistics. However, because both design skills and statistical and computing skills are required to visualize effectively, it is argued by some authors that it is both an Art and a Science.

Research into how people read and misread various types of visualizations is helping to determine what types and features of visualizations are most understandable and effective in conveying information.

Data visualization can be used for:

  • Making data engaging and easily digestible
  • Identifying trends and outliers within a set of data
  • Telling a story found within the data
  • Reinforcing an argument or opinion
  • Highlighting the important parts of a set of data

Quantitative messages

Author Stephen Few described eight types of quantitative messages that users may attempt to understand or communicate from a set of data and the associated graphs used to help communicate the message:

Time-series: A single variable is captured over a period of time, such as the unemployment rate over a 10-year period. A line chart may be used to demonstrate the trend.

Ranking: Categorical subdivisions are ranked in ascending or descending order, such as a ranking of sales performance (the measure) by sales persons (the category, with each sales person a categorical subdivision) during a single period. A bar chart may be used to show the comparison across the sales persons.

Part-to-whole: Categorical subdivisions are measured as a ratio to the whole (i.e., a percentage out of 100%). A pie chart or bar chart can show the comparison of ratios, such as the market share represented by competitors in a market.

Deviation: Categorical subdivisions are compared against a reference, such as a comparison of actual vs. budget expenses for several departments of a business for a given time period. A bar chart can show comparison of the actual versus the reference amount.

Frequency distribution: Shows the number of observations of a particular variable for given interval, such as the number of years in which the stock market return is between intervals such as 0-10%, 11-20%, etc. A histogram, a type of bar chart, may be used for this analysis. A boxplot helps visualize key statistics about the distribution, such as median, quartiles, outliers, etc.

Correlation: Comparison between observations represented by two variables (X,Y) to determine if they tend to move in the same or opposite directions. For example, plotting unemployment (X) and inflation (Y) for a sample of months. A scatter plot is typically used for this message.

Nominal comparison: Comparing categorical subdivisions in no particular order, such as the sales volume by product code. A bar chart may be used for this comparison.

Geographic or geospatial: Comparison of a variable across a map or layout, such as the unemployment rate by state or the number of persons on the various floors of a building. A cartogram is a typical graphic used.[6

Data Governance

Data governance is a term used on both a macro and a micro level. The former is a political concept and forms part of international relations and Internet governance; the latter is a data management concept and forms part of corporate data governance.

Data governance is a collection of processes, roles, policies, standards, and metrics that ensure the effective and efficient use of information in enabling an organization to achieve its goals. It establishes the processes and responsibilities that ensure the quality and security of the data used across a business or organization. Data governance defines who can take what action, upon what data, in what situations, using what methods.

A well-crafted data governance strategy is fundamental for any organization that works with big data, and will explain how your business benefits from consistent, common processes and responsibilities. Business drivers highlight what data needs to be carefully controlled in your data governance strategy and the benefits expected from this effort. This strategy will be the basis of your data governance framework.

Macro level

On the macro level, data governance refers to the governing of cross-border data flows by countries, and hence is more precisely called international data governance. This new[when?] field consists of “norms, principles and rules governing various types of data.”

Micro level

Here the focus is on an individual company. Here data governance is a data management concept concerning the capability that enables an organization to ensure that high data quality exists throughout the complete lifecycle of the data, and data controls are implemented that support business objectives. The key focus areas of data governance include availability, usability, consistency, data integrity and data security and includes establishing processes to ensure effective data management throughout the enterprise such as accountability for the adverse effects of poor data quality and ensuring that the data which an enterprise has can be used by the entire organization.

A data steward is a role that ensures that data governance processes are followed and that guidelines enforced, as well as recommending improvements to data governance processes.

Data governance encompasses the people, processes, and information technology required to create a consistent and proper handling of an organization’s data across the business enterprise. It provides all data management practices with the necessary foundation, strategy, and structure needed to ensure that data is managed as an asset and transformed into meaningful information. Goals may be defined at all levels of the enterprise and doing so may aid in acceptance of processes by those who will use them. Some goals include

  • Increasing consistency and confidence in decision making
  • Decreasing the risk of regulatory fines
  • Improving data security, also defining and verifying the requirements for data distribution policies
  • Maximizing the income generation potential of data
  • Designating accountability for information quality
  • Enable better planning by supervisory staff
  • Minimizing or eliminating re-work
  • Optimize staff effectiveness
  • Establish process performance baselines to enable improvement efforts
  • Acknowledge and hold all gain

Benefits of Data Governance

An effective data governance strategy provides many benefits to an organization, including:

A common understanding of data: Data governance provides a consistent view of, and common terminology for, data, while individual business units retain appropriate flexibility.

Improved quality of data: Data governance creates a plan that ensures data accuracy, completeness, and consistency.

Data map: Data governance provides an advanced ability to understand the location of all data related to key entities, which is necessary for data integration. Like a GPS that can represent a physical landscape and help people find their way in unknown landscapes, data governance makes data assets useable and easier to connect with business outcomes.

A 360-degree view of each customer and other business entities: Data governance establishes a framework so an organization can agree on “a single version of the truth” for critical business entities and create an appropriate level of consistency across entities and business activities.

Consistent compliance: Data governance provides a platform for meeting the demands of government regulations, such as the EU General Data Protection Regulation (GDPR), the US HIPAA (Health Insurance Portability and Accountability Act), and industry requirements such as PCI DSS (Payment Card Industry Data Security Standards).

Improved data management: Data governance brings the human dimension into a highly automated, data-driven world. It establishes codes of conduct and best practices in data management, making certain that the concerns and needs beyond traditional data and technology areas including areas such as legal, security, and compliance are addressed consistently.

Data policies and procedures

A data governance policy is a documented set of guidelines for ensuring that an organization’s data and information assets are managed consistently and used properly. Such guidelines typically include individual policies for data quality, access, security, privacy and usage, as well as roles and responsibilities for implementing those policies and monitoring compliance with them.

A data governance policy should articulate the principles, practices and standards that organizational leaders have determined necessary to ensure the organization has high-quality data and that its data assets are protected. The policy-forming group, called a data governance committee or data governance council, is primarily made up of business executives and other data owners.

The policy document this group creates clearly defines the data governance structure for the executive team, managers and line workers to follow in their daily operations.

A data governance policy formally outlines how data processing and management should be carried out to ensure organizational data is accurate, accessible, consistent and protected. The policy also establishes who is responsible for information under various circumstances and specifies what procedures should be used to manage it. In addition, it can incorporate risk management and data ethics principles to reduce potential business problems from the use of data.

Data governance is not a new concept by any stretch of the imagination, but it has come into sharp focus as the world’s data footprint continues to grow exponentially. Today, organizations not only must adhere to strict data policies and regulations (i.e. Sarbanes-Oxley Act, Basil Accord, HIPAA, Government agencies, GDPR), but they’re also looking to build a data governance strategy to better manage and properly safeguard their data as a valuable organizational asset.

Forces:

Maintenance

Nobody likes to talk about maintenance because, much like data governance, it’s not new. However, it still has its place, marking the difference between being organized or unorganized, between saving time and resources or wasting them and losing opportunities. All existing data in an organization’s infrastructure must be maintained; the more you have, the more of an effort it is to maintain it.

Risk Beyond Regulation

In addition to policy risk and regulations which mandate companies to safeguard certain data in a specific way, organizations are now facing the risk that their most valuable possession, their data, isn’t being properly handled. Access rights may be too lenient, there might be no data lineage, or they simply don’t know what exists in their infrastructure. With customer data being the most valuable asset for successful targeted marketing campaigns, it’s clear these three types of risks can have real repercussions.

Some incremental steps to get your process on the right track:

  • Determine the senior leaders you trust with creating/updating your policy. Generally, this will include at least a senior leader from IT, business, and management, sharing knowledge from different areas of expertise.
  • The data governance team should assess all areas of operational risk with respect to the data and come up with a plan for using your existing data.
  • Determine the plan and implementation strategy with the operational risks clearly communicated and addressed. If you’re implementing a new policy, I highly recommend determining how you can automate the entire process. This should also include a plan for maintaining all systems and their data.
  • Implement the changes and put your governance strategy into practice.
  • Re-assess and change course, if needed.

Life cycle of data

The lifecycle of data starts with a researcher or a team creating a concept for a study, and the data for that study is then collected once a study concept is established. After data is obtained, it is prepared for distribution to be archived and used by other researchers at a future stage. When data enters the distribution point of the life cycle, it is contained in a location where other researchers can then discover it.

The five stages are as follows:

  • Obtaining the Data: This stage involves using technical knowledge like MySQL to process and generate the data. It can even be in simpler file formats such as Microsoft Excel. Some examples like Python and R even directly import the datasets into a data science program.
  • Scrubbing the Data: This stage involves cleaning raw data to retain only the relevant part of the processed data. The noise is also scrubbed off, and the data is refined, converted, and consolidated.
  • Exploring the Data: This stage consists of examining the generated data. The data and its properties are inspected since different data types demand specific treatments. Descriptive statistics are then computed to extract the features and test the significant variables.
  • Modelling the Data: The dataset is refined further, and only the essential components are kept. Only relevant values are kept and tested to predict accurate results.
  • Interpreting the Data: At this stage, the final product is interpreted for the client or business to analyze if it meets the requirement or answers a business question. The insights are shared with everyone, and the results of the final stage are visualized.

Requirements

Data Generation and Understanding: The available data which can be used and the data which needs to be generated is analyzed and discussed. This is one of the fundamental data science life cycle steps as it deals with understanding the data requirement and gathering the data.

Data Preparation: This part of the process deals with preparing the raw data by cutting out the noise and irrelevant information. This is a time-consuming process because it deals with the cleaning and fine-tuning of data from datasets that are relevant and won’t lead to the corruption of the model.

Modeling of Project: The project is modeled, and different variations are tried out before deciding upon the final one with statistical and analytical means.

Evaluation of Model: This stage deals with finding out if the model is good enough before deployment. It is checked if the model can tackle a business problem or serve the business requirement.

Deployment of Model and Communication: The model is deployed and monitored. Basic communication is done regarding the model in regards to optimization and maintenance.

Accounting information Systems, Introduction, Meaning, Functions, Need, Scope, Steps, Types, Advantages and Limitations

Accounting Information Systems (AIS) is a specialized branch of accounting that combines traditional accounting practices with modern information technology to process, manage, and analyze financial data. It refers to a structured framework of people, procedures, and technology designed to collect, record, store, and communicate accounting information for decision-making purposes. An AIS helps organizations ensure accurate financial reporting, effective internal control, and efficient operations.

The system integrates both manual and computerized processes to transform raw financial data into meaningful information. With advancements in technology, most organizations now rely heavily on computerized AIS that involve databases, enterprise resource planning (ERP) systems, and cloud-based solutions. These systems improve the speed, accuracy, and reliability of financial data handling while minimizing human errors.

AIS serves multiple stakeholders such as managers, investors, auditors, regulators, and employees by providing timely and relevant information. It plays a crucial role in strategic planning, budgeting, auditing, and compliance with legal requirements. Moreover, it strengthens internal controls by detecting fraud, ensuring data security, and safeguarding organizational assets.

Meaning of Accounting Information Systems

Accounting Information System (AIS) is a structured framework that combines accounting, management, and information technology to collect, record, process, and report financial and non-financial data for decision-making. It can be defined as a system of people, procedures, controls, databases, and technology designed to manage accounting information and ensure its accuracy, reliability, and relevance.

AIS captures financial transactions from various business activities, processes them into meaningful reports, and communicates this information to internal and external stakeholders such as managers, investors, auditors, and regulators. It integrates traditional accounting practices with advanced technologies like databases, enterprise systems, and cloud computing to enhance efficiency and effectiveness.

Functions of an Accounting Information System:

  • Collection of Data

One of the primary functions of AIS is to collect financial and non-financial data from various business operations. Every transaction, whether sales, purchases, payroll, or expenses, needs to be recorded accurately. AIS ensures that this data is gathered systematically from different sources like invoices, receipts, and ledgers. This organized collection process prevents data loss, duplication, or errors. Accurate data collection forms the foundation for reliable reporting and effective decision-making in an organization.

  • Recording of Transactions

After data is collected, AIS records it into appropriate accounting journals and ledgers. This step ensures that all transactions are chronologically documented and classified correctly, following accounting principles. Recording also creates an audit trail, allowing auditors and managers to verify the authenticity of financial data. By automating this process through software, AIS minimizes human errors, improves efficiency, and guarantees the completeness of financial records essential for reporting and compliance purposes.

  • Processing of Data

AIS processes raw data into meaningful financial information by applying accounting rules, classifications, and calculations. This involves posting entries to ledgers, preparing trial balances, and adjusting accounts where necessary. Modern AIS uses computerized systems to automate calculations like depreciation, interest, and payroll. The processing step transforms unorganized raw transactions into structured financial data that can be further analyzed. This makes information more useful for management in planning, monitoring, and evaluating business operations.

  • Storage of Information

A vital function of AIS is the secure storage of accounting information. Data must be maintained in databases or digital systems for easy retrieval, analysis, and reporting. Proper storage ensures that historical financial records are available for audits, comparisons, and future reference. AIS uses technologies like databases, cloud systems, and ERP solutions to organize and protect stored data. Secure storage safeguards sensitive financial information from unauthorized access, loss, or manipulation, thereby ensuring reliability and integrity.

  • Generation of Reports

AIS generates reports that provide insights into financial performance and business operations. These reports may include income statements, balance sheets, cash flow statements, budgets, and cost analyses. Reports are customized to meet the needs of different stakeholders, from managers requiring detailed internal reports to investors and regulators requiring summarized financial statements. By delivering timely and accurate reports, AIS supports compliance, enhances decision-making, and communicates essential financial information effectively to users across different levels of the organization.

  • Internal Control and Security

Another critical function of AIS is implementing internal controls and security measures to protect financial data. AIS ensures authorization of transactions, segregation of duties, and monitoring of activities to prevent fraud and errors. It also uses passwords, encryption, and access restrictions to safeguard sensitive information. Strong internal control systems built into AIS enhance accuracy, reliability, and accountability in financial reporting. They also ensure compliance with legal requirements, thereby protecting both organizational assets and stakeholder interests.

  • Support in DecisionMaking

AIS plays a key role in managerial decision-making by providing accurate and timely information. It supports strategic planning, budgeting, forecasting, and performance evaluation by offering insights into costs, revenues, and profitability. Managers rely on AIS-generated data to allocate resources efficiently, identify risks, and assess growth opportunities. By integrating financial and non-financial data, AIS gives a holistic view of business performance. This function enables managers to take informed decisions that drive competitiveness and long-term organizational success.

  • Compliance and Audit Support

AIS ensures that financial records and reports comply with statutory requirements, accounting standards, and taxation laws. It simplifies the preparation of documents needed for audits, regulatory reviews, and tax filings. AIS maintains accurate audit trails, making verification easier for auditors. Automated systems reduce the risk of non-compliance by updating regulatory changes. This function enhances transparency, builds trust among stakeholders, and ensures organizations meet legal obligations, thereby avoiding penalties and maintaining credibility in the business environment.

Need of an Accounting Information System:

  • Accuracy in Financial Reporting

Organizations require AIS to ensure accuracy in financial reporting. Manual accounting processes often lead to human errors, misclassifications, or data loss. An AIS automates data entry, calculations, and reporting, minimizing mistakes and improving reliability. Accurate financial reports are essential for management decisions, investor confidence, and compliance with accounting standards. By reducing the margin of error, AIS provides precise and trustworthy financial information that reflects the true financial position of the business.

  • Timely Decision-Making

Businesses operate in fast-changing environments, and timely information is crucial for success. AIS provides real-time financial data that helps managers make quick and informed decisions. Whether it is evaluating cash flows, monitoring expenses, or planning investments, timely data supports effective decision-making. Without AIS, organizations may face delays in accessing updated information, leading to missed opportunities or poor strategies. Therefore, AIS is needed to provide up-to-date insights that align decisions with organizational goals.

  • Compliance with Regulations

Compliance with accounting standards, taxation laws, and regulatory frameworks is a major need for businesses. AIS ensures that financial transactions are recorded according to Generally Accepted Accounting Principles (GAAP) or International Financial Reporting Standards (IFRS). It also helps generate tax reports and statutory documents required by regulators. Automated compliance features reduce the risk of penalties, fines, or legal issues. By maintaining transparency and accountability, AIS helps businesses meet legal requirements and build credibility with stakeholders.

  • Enhanced Internal Control

AIS is essential for strengthening internal control within organizations. It incorporates security measures such as access restrictions, authorization protocols, and audit trails that safeguard financial data. These controls reduce the chances of fraud, manipulation, or unauthorized transactions. Internal controls also ensure accountability by clearly defining user roles and responsibilities. Without an AIS, detecting irregularities or fraudulent activities becomes difficult. Thus, businesses need AIS to enhance security, maintain ethical practices, and protect organizational assets.

  • Cost and Time Efficiency

Manual accounting processes are time-consuming and costly, especially in large organizations with complex transactions. AIS reduces paperwork, automates repetitive tasks, and streamlines data management, saving both time and resources. By increasing efficiency, businesses can reallocate resources to other strategic activities. Additionally, quick access to information through AIS reduces the time needed for audits, reporting, and financial analysis. Hence, AIS is needed to improve operational efficiency, minimize costs, and maximize productivity in accounting functions.

  • Support for Strategic Planning

AIS provides valuable insights that support long-term strategic planning. It generates reports on revenue trends, cost patterns, and profitability analysis, helping managers forecast future performance. These insights guide decisions regarding budgeting, investments, expansion, and resource allocation. Without AIS, businesses may lack the detailed information necessary for accurate forecasting. By offering comprehensive data analysis, AIS enables organizations to plan effectively, achieve sustainable growth, and remain competitive in an increasingly dynamic business environment.

  • Facilitation of Auditing

Auditors require accurate, complete, and verifiable financial records to perform their duties. AIS provides a structured system with detailed audit trails, making verification easier. It maintains chronological records of transactions, user activities, and adjustments, ensuring transparency. By simplifying the audit process, AIS saves time for both auditors and businesses. Moreover, it reduces the risk of audit disputes by providing reliable data. Therefore, AIS is needed to facilitate smooth, efficient, and trustworthy internal and external audits.

  • Competitive Advantage

In today’s competitive business environment, AIS provides organizations with a significant edge. By offering timely, accurate, and reliable financial data, AIS enables managers to respond faster to market changes and customer needs. It enhances decision-making, improves efficiency, and ensures compliance, all of which strengthen competitiveness. Businesses that adopt advanced AIS gain agility and transparency compared to those relying on manual systems. Thus, AIS is needed as a strategic tool for achieving long-term sustainability and market leadership.

Scope of an Accounting Information System:

  • Financial Data Management

The scope of AIS includes systematic management of financial data, from collection to reporting. It captures all transactions like sales, purchases, payroll, and expenses, ensuring they are accurately recorded and organized. This makes it easier to prepare financial statements and comply with accounting standards. AIS manages both current and historical data, providing a reliable foundation for analysis. Thus, its scope covers the entire cycle of financial data handling essential for effective business operations.

  • Integration with Technology

AIS extends to integrating accounting practices with modern technology such as databases, ERP systems, and cloud platforms. This integration enables automation of tasks, improved data accessibility, and enhanced processing speed. By combining technology with accounting, AIS expands its role from simple bookkeeping to strategic decision support. Its scope also includes adapting to emerging tools like artificial intelligence and data analytics. Therefore, AIS is not limited to accounting but also encompasses technological advancements that drive efficiency.

  • Internal Control and Security

The scope of AIS involves ensuring strong internal controls and data security. It defines authorization levels, establishes audit trails, and applies protective measures such as encryption and firewalls. These features safeguard financial information from unauthorized access, manipulation, or fraud. By strengthening accountability and compliance, AIS supports ethical and transparent operations. Its role in maintaining the security of sensitive data makes it indispensable in protecting organizational assets and building stakeholder trust, extending its scope beyond accounting.

  • Compliance and Legal Reporting

AIS has a wide scope in ensuring compliance with legal requirements and statutory reporting. It assists in preparing financial reports according to GAAP, IFRS, and local regulations. It also generates tax-related documents and helps organizations meet deadlines for filing returns. By automating compliance functions, AIS reduces the risk of penalties and enhances organizational credibility. Thus, its scope extends to meeting legal obligations, supporting auditors, and ensuring that businesses operate within the framework of regulatory standards.

  • DecisionMaking Support

AIS plays a significant role in managerial decision-making by providing timely and relevant financial information. It offers detailed analyses of revenues, expenses, profits, and costs, enabling managers to make informed choices. Its scope also includes preparing budgets, forecasts, and performance evaluations that guide future planning. By presenting real-time insights, AIS empowers businesses to respond effectively to changes in the market. Hence, its scope extends beyond record-keeping to becoming a vital tool for strategic management decisions.

  • Auditing and Verification

The scope of AIS covers auditing and verification of financial records. It provides detailed documentation and audit trails that facilitate easy checking of transactions. Both internal and external auditors rely on AIS to ensure data accuracy and detect irregularities. Automated systems simplify the audit process by maintaining systematic records, reducing the possibility of disputes. This enhances transparency and accountability in reporting. Thus, AIS contributes significantly to auditing, making it an integral part of financial governance.

  • Support for Strategic Planning

AIS contributes to long-term strategic planning by offering insights into financial performance and resource utilization. It generates analytical reports that highlight trends, variances, and future opportunities. This information helps organizations allocate resources effectively, set realistic goals, and pursue growth strategies. Its scope includes guiding decisions on expansion, investments, and risk management. By transforming raw data into actionable knowledge, AIS extends its role to shaping the overall strategic direction of the organization for sustainable success.

  • Global and Multidimensional Application

The scope of AIS is not restricted to local operations; it also supports multinational businesses. Modern AIS systems handle multiple currencies, languages, and regulatory frameworks, making them useful for global enterprises. Their application extends across industries like manufacturing, services, banking, and retail. AIS also incorporates non-financial information, such as customer data or sustainability metrics, to provide holistic insights. Hence, its scope is multidimensional, covering diverse functions, industries, and geographies in today’s interconnected business environment.

Steps to Implement an Accounting Information System:

Step 1. Identifying Organizational Needs

The first step in implementing an AIS is to clearly identify the needs of the organization. Management must analyze business processes, accounting requirements, and decision-making needs. This includes understanding transaction volume, reporting requirements, and compliance obligations. By defining objectives, the system can be tailored to address gaps in the current accounting processes. Identifying organizational needs ensures that the AIS aligns with business goals, enhances efficiency, and provides accurate financial information for internal and external stakeholders.

Step 2. Setting Clear Objectives

Once organizational needs are identified, it is essential to set clear objectives for the AIS. Objectives may include improving reporting accuracy, strengthening internal controls, enhancing data security, or automating routine tasks. These goals serve as benchmarks to evaluate system effectiveness after implementation. Setting objectives also helps in prioritizing resources and choosing features that provide maximum value. With clearly defined objectives, the organization can ensure that the AIS is purpose-driven and aligned with both financial and strategic priorities.

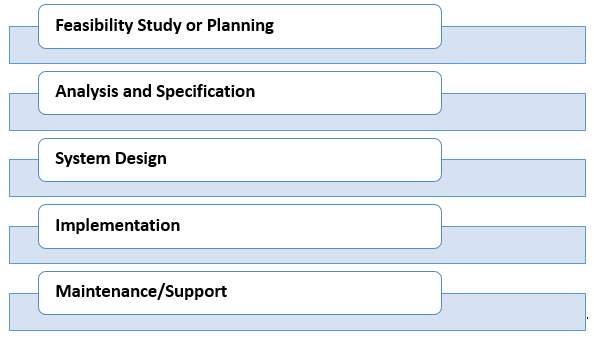
Step 3. Feasibility Study and Planning

Before implementation, a detailed feasibility study is conducted to evaluate technical, financial, and operational viability. This includes assessing the costs, potential benefits, risks, and available resources. A proper plan is then developed, outlining timelines, responsibilities, and milestones. Feasibility studies also examine whether the staff has the required technical expertise or training needs. Planning provides a roadmap for execution, minimizing unexpected challenges and ensuring that the AIS implementation is realistic, achievable, and sustainable for long-term organizational success.

Step 4. Selection of Appropriate Software

Choosing the right accounting software is critical for successful AIS implementation. Organizations must compare different options based on features, scalability, cost, integration capability, and user-friendliness. Popular solutions include ERP systems, customized accounting software, or cloud-based platforms. The chosen software should support organizational objectives, comply with regulations, and handle transaction volumes efficiently. Selection should also consider vendor reputation, customer support, and future upgrade options. A well-chosen software system ensures smooth operations, better control, and reliable financial data management.

Step 5. Designing the System Framework

The system design stage focuses on creating a framework for the AIS, including process workflows, reporting formats, and internal controls. It specifies how data will be collected, processed, stored, and communicated. This step also defines user roles, access levels, and security features. Designing ensures that the AIS aligns with business operations and accounting standards. A properly designed framework guarantees efficiency, prevents duplication, and minimizes errors, ensuring that the system is functional, secure, and adaptable to organizational needs.

Step 6. Hardware and Infrastructure Setup

AIS implementation requires suitable hardware and infrastructure to support the chosen software. This includes computers, servers, networking devices, storage systems, and backup facilities. Depending on the system type, organizations may also use cloud services for scalability. Hardware should be reliable, secure, and capable of handling high transaction loads without failure. Infrastructure also includes internet connectivity, firewalls, and antivirus tools for data protection. Proper setup of hardware and infrastructure ensures smooth operation, speed, and reliability of the accounting system.

Step 7. Data Migration and Testing

Data migration is the process of transferring existing accounting records into the new AIS. This involves cleansing, validating, and converting data from legacy systems to ensure accuracy. Once migrated, the system undergoes rigorous testing to identify errors, check functionality, and validate internal controls. Testing includes trial transactions, report generation, and reconciliation with old records. This step ensures that the AIS works as intended before going live. Effective data migration and testing prevent disruptions and ensure continuity in operations.

Step 8. Training of Personnel

Employees and accountants must be trained to use the AIS effectively. Training programs cover data entry, report generation, system navigation, and troubleshooting. This ensures that staff can fully utilize the system’s capabilities while minimizing errors. Training also emphasizes the importance of security protocols, internal controls, and compliance requirements. Continuous support and refresher training may be provided to adapt to system upgrades. Well-trained personnel are critical for successful AIS implementation since the system’s efficiency depends on user competence.

Step 9. Implementation and Monitoring

After successful testing and training, the AIS is officially implemented in the organization. This involves switching to the new system for recording transactions and generating reports. Implementation should be monitored closely to identify issues, technical glitches, or user errors. Regular supervision ensures timely corrective measures and smooth adoption. Monitoring also helps evaluate whether the system is meeting set objectives. Continuous observation during the initial phase ensures that the AIS delivers accurate results and enhances operational efficiency.

Step 10. Evaluation and Continuous Improvement

The final step is evaluating system performance and ensuring continuous improvement. Regular audits, feedback, and performance reviews help identify strengths and weaknesses of the AIS. Updates, patches, and upgrades are applied to keep the system secure and efficient. Organizations may also enhance reporting features, add automation, or integrate with other systems. Continuous improvement ensures that the AIS adapts to changing business needs, regulatory requirements, and technological advancements, making it a long-term asset for financial management.

Types of Accounting Information Systems:

1. Manual Accounting Information System

This is the most traditional type where accounting data is processed manually using paper-based journals, ledgers, and registers. Transactions are recorded by hand and financial statements are prepared without computer assistance. Though inexpensive, manual AIS is time-consuming and prone to human errors. It is usually found in very small businesses with limited transactions. Today, it is less common but still relevant in rural areas or organizations with minimal technological infrastructure.

2. Computerized Accounting Information System

A computerized AIS uses software and digital tools to record, process, and report financial data. Examples include Tally, QuickBooks, and MYOB. These systems automate calculations, maintain digital records, and generate reports efficiently. They provide greater accuracy, speed, and reliability compared to manual systems. Computerized AIS also integrates internal controls, enhances data security, and allows easy data storage and retrieval. Most medium and large organizations adopt computerized systems for effective financial management and compliance.

3. Enterprise Resource Planning (ERP) Systems

ERP-based AIS integrates accounting with other business functions like human resources, supply chain, production, and sales. Examples include SAP, Oracle NetSuite, and Microsoft Dynamics. These systems provide a centralized database, allowing departments to access consistent financial and operational data. ERP-based AIS ensures better coordination, strategic planning, and real-time reporting. Although costly to implement, ERP systems are highly effective for large organizations with complex operations, offering a holistic view of both financial and non-financial performance.

4. Cloud-Based Accounting Information System

This type of AIS uses cloud technology, enabling businesses to access financial data anytime and anywhere through the internet. Examples include Zoho Books, Xero, and FreshBooks. Cloud AIS offers scalability, data backup, remote access, and lower infrastructure costs. It also allows collaboration among accountants, managers, and auditors across different locations. However, it requires strong cybersecurity measures to safeguard sensitive data. Small to medium-sized businesses increasingly prefer cloud-based systems for their flexibility and cost efficiency.

5. Transaction Processing Systems (TPS)

TPS are specialized AIS designed to handle high volumes of routine transactions such as sales, purchases, payroll, and inventory. They ensure accuracy, speed, and reliability in day-to-day operations. For example, a retail billing system automatically records sales transactions and updates inventory. These systems provide the foundation for other AIS functions like reporting and auditing. TPS are essential for organizations dealing with thousands of transactions daily, such as banks, supermarkets, and large manufacturing firms.

6. Management Information Systems (MIS)

MIS-based AIS focuses on providing summarized financial and operational data for middle and top management. It generates reports such as budgets, performance analysis, and variance reports to support decision-making. MIS transforms raw accounting data into meaningful information that helps managers plan, monitor, and control organizational activities. Unlike TPS, which focuses on recording, MIS emphasizes analysis and reporting. Its role in decision support makes MIS an essential type of AIS in modern business environments.

7. Decision Support Systems (DSS) in Accounting

DSS-based AIS provides advanced analytical tools and models to support strategic financial decisions. It uses accounting data along with predictive analysis, simulations, and forecasting to guide decisions such as investment planning, cost control, and expansion strategies. DSS goes beyond routine reporting by offering “what-if” scenarios and financial modeling. This system is especially useful for large corporations where management must evaluate alternatives and make complex strategic decisions based on reliable accounting and non-financial data.

Advantages of an Accounting Information System:

  • Improved Accuracy

One of the biggest advantages of AIS is enhanced accuracy in financial data management. Manual accounting is prone to human errors, such as miscalculations and misclassifications. AIS automates data entry, posting, and report generation, minimizing mistakes. By ensuring precise and reliable information, it supports compliance with accounting standards and reduces costly errors. Accurate records also enhance the credibility of financial statements, which is vital for decision-making, audits, and building stakeholder trust in the organization.

  • Time and Cost Efficiency

AIS saves considerable time and reduces costs by automating repetitive accounting tasks. Activities like posting entries, preparing ledgers, generating invoices, and producing reports are completed quickly with minimal effort. This efficiency enables accountants and managers to focus on analysis rather than routine work. Additionally, reducing paperwork and storage costs further contributes to financial savings. For businesses handling large transaction volumes, AIS significantly improves productivity, minimizes delays, and helps organizations operate in a cost-effective manner.

  • Enhanced Decision-Making

AIS provides timely and relevant financial information, which supports better decision-making. Managers can access real-time data regarding revenues, expenses, and cash flows, helping them analyze performance and plan effectively. Detailed reports and forecasts guide strategic choices such as investments, budgeting, and expansion. By integrating financial and non-financial data, AIS presents a holistic view of the organization’s operations. This advantage allows management to make informed, evidence-based decisions that contribute to competitiveness and long-term business growth.

  • Strong Internal Control

AIS enhances internal control by establishing systematic checks and balances. It incorporates authorization protocols, segregation of duties, and automated audit trails, which reduce fraud and manipulation. Access restrictions ensure that only authorized personnel can perform specific accounting tasks, safeguarding sensitive information. By monitoring transactions and activities, AIS helps detect irregularities early and ensures accountability. Strong internal control strengthens transparency, builds stakeholder confidence, and ensures compliance with laws and regulations, making AIS vital for responsible governance.

  • Better Data Storage and Security

AIS provides secure storage of accounting records using databases, servers, or cloud systems. Unlike manual files, which can be lost or damaged, digital systems ensure reliable backups and recovery options. Advanced security measures like encryption, passwords, and firewalls protect data from unauthorized access or cyber threats. Additionally, stored data can be retrieved easily for audits, analysis, or compliance purposes. This advantage of AIS ensures the confidentiality, integrity, and availability of financial information for business use.

  • Support for Compliance and Auditing

AIS simplifies compliance with accounting standards, tax regulations, and legal requirements. It automatically generates statutory reports and maintains accurate records required by authorities. For auditors, AIS offers detailed audit trails, ensuring easy verification of transactions. Automated compliance reduces the risk of penalties, errors, or legal disputes. Furthermore, AIS provides transparency by maintaining accurate documentation. This advantage ensures organizations meet their legal obligations while building trust with regulators, investors, and other stakeholders through accountable practices.

  • Scalability and Flexibility

AIS can adapt to the growth and changing needs of businesses. As organizations expand, transaction volumes and reporting requirements increase. AIS can scale up by handling larger data volumes and integrating new features without disrupting operations. Flexible systems such as ERP or cloud-based AIS allow customization to fit industry-specific needs. This adaptability ensures that businesses continue to operate efficiently while maintaining accurate financial records. Thus, scalability and flexibility make AIS a long-term investment for organizations.

  • Competitive Advantage

In today’s dynamic business environment, AIS provides a strong competitive edge. It enables faster decision-making, efficient resource allocation, and real-time financial monitoring. By ensuring accuracy, efficiency, and compliance, AIS allows businesses to outperform competitors relying on manual or outdated systems. Cloud-based AIS also supports remote access and collaboration, improving organizational agility. This advantage empowers companies to respond quickly to market changes and customer demands, positioning them ahead of competitors and supporting sustainable business success.

Limitations of an Accounting Information System:

  • High Implementation Cost

One of the major limitations of AIS is its high cost of implementation. Purchasing licensed software, upgrading hardware, hiring consultants, and training staff require significant investment. For small and medium-sized enterprises, these expenses can be burdensome. In addition, maintenance and system upgrades involve ongoing costs. While AIS improves efficiency, the initial financial burden may outweigh short-term benefits for smaller organizations, making it difficult for them to adopt advanced systems compared to larger companies.

  • Technical Complexity

AIS is often complex and requires specialized technical knowledge for installation, operation, and maintenance. Employees without proper training may face difficulties in using the system effectively, leading to errors or inefficiencies. Integrating AIS with existing systems can also be challenging, especially in large organizations with multiple departments. Technical glitches, software bugs, and compatibility issues add to this complexity. Without skilled IT professionals, businesses may struggle to maximize the benefits of AIS, limiting its effectiveness.

  • Risk of Data Security Breaches

Although AIS incorporates security features, it remains vulnerable to cyberattacks, hacking, and data breaches. Sensitive financial data stored in digital systems can be exploited if security measures fail. Businesses relying on cloud-based AIS face risks of unauthorized access and data theft. Even internal misuse by employees can compromise data integrity. Protecting against such risks requires constant monitoring, advanced cybersecurity tools, and strict protocols, which may not always be feasible, especially for smaller organizations.

  • Dependence on Technology

AIS heavily depends on technology for functioning. Any disruption in hardware, software, or internet connectivity can halt operations and delay reporting. Power outages, system crashes, or technical failures may result in temporary loss of access to critical financial information. Overdependence on technology also creates challenges in regions with limited infrastructure or unstable connectivity. This limitation makes AIS vulnerable to external factors beyond the organization’s control, affecting continuity in accounting and decision-making processes.

  • Risk of Errors During Data Migration

When shifting from manual systems or older software to new AIS platforms, data migration is necessary. This process is prone to errors such as incomplete transfers, incorrect formatting, or data loss. If historical records are not migrated accurately, it may create inconsistencies in financial reporting. Data migration requires skilled professionals, careful planning, and significant time. Errors at this stage can compromise the reliability of the AIS and diminish its effectiveness in generating accurate financial reports.

  • Resistance to Change by Employees

Another limitation is employee resistance to adopting AIS. Workers accustomed to manual systems may find it difficult to adapt to computerized processes. Fear of job loss, lack of technical skills, or reluctance to learn new systems can hinder successful implementation. Without proper training and motivation, employees may underutilize AIS features, reducing its benefits. Overcoming this resistance requires change management strategies, continuous support, and effective communication, which can be time-consuming and costly for organizations.

  • Continuous Upgradation Requirement

AIS needs regular upgrades to keep up with technological advancements, regulatory changes, and growing business needs. These upgrades often involve additional costs, disruptions in workflow, and retraining employees. If organizations fail to update their systems, AIS may become outdated, exposing them to compliance risks and inefficiencies. For small businesses, frequent upgrades can be financially and operationally challenging. This limitation makes it difficult to maintain the system’s effectiveness over the long term without significant ongoing investment.

  • Possibility of System Failure

Despite its advantages, AIS is not foolproof and may experience failures. Technical breakdowns, software crashes, malware attacks, or hardware damage can lead to system downtime. In such cases, businesses may face disruptions in accounting processes, delayed reporting, or even data loss. Restoring the system requires technical expertise and backup measures, which are not always available instantly. This limitation highlights the risk of overreliance on AIS without adequate contingency plans or alternative arrangements for emergencies.

Enterprise Performance Management Systems

Enterprise performance management (EPM) is a field of business performance management which considers the visibility of operations in a closed-loop model across all facets of the enterprise. Specific to financial activities in the office of the chief financial officer, EPM also supports financial planning and analysis (FP&A). Corporate performance management (CPM) is a synonym for enterprise performance management. Gartner has officially retired the concept of CPM and reclassified into “financial planning and analysis (FP&A)” and “financial close” to reflect two significant trends increased focus on planning, and the emergence of a new category of solutions supporting the management of the financial close.

There are several domains in the EPM field which are driven by corporate initiatives, academic research, and commercial approaches. These include:

  • Strategy formulation
  • Business planning and forecasting
  • Financial management
  • Supply chain effectiveness

Strategy formulation

Strategy formulation refers to activities of an organization which determine the direction of its agenda. This is generally constructed of the mission, vision, and strategic goals and objectives of an organization. Once the direction is established, an organization monitors its progress against those activities and takes corrective actions to reach a particular target state.

While execution is the key to any operational objective, the strategy formulation surrounding why execution should occur and the context by which execution should be performed is also important. In recent years, organizations embed formal approaches to risk management to address market opportunities that organizations pursue. In this way strategy is aligned, performance is predictable, and executives can make better business decisions.

Executives live in a financially driven environment, where operational processes are traditionally a means of organizing resources inside the company and its value chain and employees are the responsible actors to execute those processes. The strategy gap that some industry watchdogs have noted is real and growing. Innovative technologies provide one approach to collapsing this gap and allowing corporate strategic outcomes to be fully realized and risk management programs to be fully described.

The first two steps of the closed-loop EPM process model involve developing the strategy and then to translate the strategy into particular actions that the organization can undertake. Strategy development as a subset of strategy formulation represents the articulation of the key components of strategy: mission, vision, strategic goals, and strategic objectives. There are several approaches to strategy development which may be considered. However, this may occur the executive leadership of the organization approve the strategy and typically review this strategy every 3–5 years based upon a 10–20-year horizon. Some business and national cultures may consider a longer-range strategy horizon.

Strategy translation then takes the often-obscure direction and statements defined in the first step and considers how to make these directions actionable. In the case of strategic goals, these are lofty targets given generally 3–5 years to achieve. Strategic objectives then identify specific progress against goals in a given time period. For example, “product ABC will achieve a market share of x% over the next two fiscal years.” would be a strategic objective. Key performance indicators assigned to these goals are determined which can monitor the organization progress towards achieving goals and objectives.

Business planning and forecasting

Business planning and forecasting refers to the set of activities where business is planned against the strategy and what forecast activities or results of the organization may occur from operational execution during a particular time period. This discipline corresponds to the third and sixth steps of the closed-loop EPM process model. Financial forecasts are a forecast of how a business will perform financially over, say, the year ahead.

Preparing forecasts will help a business to assess its likely sales income, costs, external financing needs and profitability. Financial forecasts are essential if a business needs to raise money from a third party, such as a bank. But they also provide businesses with the means to monitor performance on, say, a monthly basis and thereby exercise effective financial control – arguably the second most important management function in running a business.

Financial management

Financial management refers to the set business processes done to close the financial records of an organization at the end of a period in an accurate and timely fashion according to a generally accepted basis of accounting, including the financial statement presentation of results to both internal and external stakeholders, as well as providing appropriate explanations and insights to the nature of the financial results and all supporting documentation.

Supply chain effectiveness

Supply chain effectiveness refers to capabilities to not only manage an enterprise supply chain, but also to provide transparency to all parts of the value chain. This includes the ability to see the sales pipeline and create demand plans organized with suppliers to fulfill those demand plans. Another area of key focus is sales and operations planning (S&OP).

A modern EPM solution enables you to understand how, when, and where to adjust to disruptions.

Streamline account reconciliation: Account reconciliation is the number one reason for nondata-related delays in the financial close. EPM enables you to efficiently manage and improve global account reconciliation by exploiting automation and comprehensively addressing the security and risk typically associated with this process.

Optimize the financial close: In a changing regulatory environment, you need to adapt quickly to new requirements and deliver faster, more accurate insights to all stakeholders. EPM helps you streamline the financial close and report with confidence and insight.

Drive accurate and agile integrated plans: The digital economy demands more than spreadsheets and department-oriented planning processes. Truly effective planning should seamlessly connect your entire organization for a better vision. With EPM you can align planning across the enterprise, so that you can develop agile forecasts for all lines of business and respond faster and more effectively to change.

Align tax reporting with corporate financial reporting: Changing tax laws are causing global organizations to plan and manage their tax affairs very differently than they have to-date. EPM supports effective tax reporting by connecting the processes, data, and metadata that tax and finance share, such as financial planning, financial close, and regulatory reporting.

Manage and drive profitability: To survive in uncertain times, you must be able to manage and drive profitability. EPM helps you gain insight into dimensions of cost and profitability to determine where to invest limited resources.

Satisfy all your reporting requirements: No matter how many reporting standards you have to comply with, you want to be sure that the data you provide in your reports is accurate, complete, and the most current information available. EPM reduces the need for multiple reporting systems.

Manage change with enterprise data management: Whether you’re migrating applications to the cloud, managing applications in a hybrid environment, or spearheading major business and financial transformation, an enterprise data management platform provides data accuracy and integrity with the alignment of your data and master data.

Residual income

Residual income is income that one continues to receive after the completion of the income-producing work. Examples of residual income include royalties, rental/real estate income, interest and dividend income, and income from the ongoing sale of consumer goods (such as music, digital art, or books), among others. In corporate finance, residual income can be used as a measure of corporate performance, whereby a company’s management team evaluates the income generated after paying all relevant costs of capital. Alternatively, in personal finance, residual income can be defined as either the income received after substantially all of the work has been completed, or as the income left over after paying all personal debts and obligations.

Residual income is not a GAAP concept. It is an internal financial assessment technique to help scale the relative success or failure of specific business activities. It adjusts income for a presumed cost of capital (or other threshold rate of return). Although there are many variations of the residual income calculations, the general approach is portrayed by the following formula:

Residual Income = Operating Income – (Operating Assets X Cost of Capital)

Residual Income (RI) = Net profits – Equity Charge

Equity Charge = Total Equity × Cost of Equity Capital

Types of Residual Income

Equity Valuation

In equity valuation, residual income represents an economic earnings stream and valuation method for estimating the intrinsic value of a company’s common stock. The residual income valuation model values a company as the sum of book value and the present value of expected future residual income. Residual income attempts to measure economic profit, which is the profit remaining after the deduction of opportunity costs for all sources of capital.

Residual income is calculated as net income less a charge for the cost of capital. The charge is known as the equity charge and is calculated as the value of equity capital multiplied by the cost of equity or the required rate of return on equity. Given the opportunity cost of equity, a company can have positive net income but negative residual income.

Corporate Finance

Managerial accounting defines residual income in a corporate setting as the amount of leftover operating profit after paying all costs of capital used to generate the revenues. It is also considered the company’s net operating income or the amount of profit that exceeds its required rate of return. Residual income is typically used to assess the performance of a capital investment, team, department, or business unit.

The calculation of residual income is as follows:

Residual income = operating income – (minimum required return x operating assets).

Personal Finance

In personal finance, residual income is known as disposable income. The residual income calculation occurs monthly after paying all monthly debts. As a result, residual income often becomes an essential component of securing a loan.

A lending institution assesses the amount of residual income remaining after paying other debts each month. The greater the amount of residual income, the more likely the lender is to approve the loan. Adequate levels of residual income establish that the borrower can sufficiently cover the monthly loan payment.

Advantages of the Residual Income Method

The residual income method can be used in both performance appraisals of a project, division, and business valuations. It considers the future cash flows in the present value term, which is the most liked approach in investment appraisals.

Its benefits closely resemble those arising from the dividend discount model or discounted cash flow models in present value terms. Some benefits of the Residual Income method in performance appraisals and business valuations include:

  • It appraises the project net income in terms of present value, the residual income then equals the net worth of the shareholders.
  • It focuses on the economic profits of the business rather than operating profits.
  • The Residual Income method includes the book value of stocks in addition to the future stock price appreciation.
  • Residual income utilizes readily available data from the business financial statements.
  • It offers an adequate performance measure in terms of shareholders’ expectations, often profit generating businesses may not be generating enough economic profits for the shareholders.

Disadvantages of the Residual Income Method

  • As with any theoretical performance appraisal method, the residual income method also offers some limitations:
  • The Residual Income model also uses the cost of equity and cost of capital from The Income statement, both of which are assumption based measure.
  • The use of book value for stock appraisals or asset valuation in project appraisal may offer invalid forecasts, as the book value of asset may not be accurate as market or intrinsic values.
  • The residual income calculations begin with the book value of stocks or the net profits from the Income statement, these accounting entries can be manipulated by managers to show positive results.
  • Residual income discards the long-term gains arising with cash flows in the later stages of the project.

Investment base issues

Bad Timing

Though the least common of these five challenges, some new investors go into the market right before a financial downfall. This has caused investors to lose money before making any! However, this risk can easily be mitigated by rupee-cost averaging, a strategy where you invest into the market bit by bit and mitigate larger fluctuations in the value in your portfolio over a long period.

Over-Diversification

This challenge is almost always self-inflicted. Many new investors feel they need to invest a bit in everything to shield themselves from risk. However, over-diversification can significantly stunt your portfolio’s growth. It is often best to pick 2-3 options to invest the majority of your portfolio in.

Unknown Risks

New investors may not know about the hidden risks in many seemingly simple investment strategies. This can cause their portfolios to take large hits early on in the process. To combat this pitfall, it’s important to be as informed as possible. Make sure to be familiar with the risks involved with margin, leverage, options, futures, etc., before considering them as an investment option.

Information Overload

Many people looking to get involved with the stock market google around to discover the basics and quickly find themselves overwhelmed by the sheer amount of seemingly complex and even contradictory advice on the internet. Luckily, many of the most reliable trading strategies used by successful investors are quite timeless. New investors may find it easier to avoid the noise and use books as a resource to get started.

Limited Capital

One of the biggest challenges that new investors face is having limited capital available to invest. This is only compounded when certain financial instruments are too expensive. However, these issues can often be solved by looking into “partial shares.”

Not Getting Help

It’s risky to start investing without any outside help. Especially when you’re getting started, you should be using some form of investment advising, whether it’s automated or live. This will give you added assurance that you’ll see a return on your money.

Roadmap

Portfolio diversification

Asset allocation and portfolio diversification go hand in hand. Portfolio diversification is the process of selecting a variety of investments within each asset class to help reduce investment risk. Diversification across asset classes may also help lessen the impact of major market swings on your portfolio.

Rupee-cost averaging

Rupee-cost averaging is a disciplined investment strategy that can help smooth out the effects of market fluctuations in your portfolio.

With this approach, you apply a specific Rupee amount toward the purchase of stocks, bonds and/or mutual funds on a regular basis. As a result, you purchase more shares when prices are low and fewer shares when prices are high. Over time, the average cost of your shares will usually be lower than the average price of those shares. And because this strategy is systematic, it can help you avoid making emotional investment decisions.

Asset allocation

Appropriate asset allocation refers to the way you weight the investments in your portfolio to try to meet a specific objective and it may be the single most important factor in the success of your portfolio.

For instance, if your goal is to pursue growth, and you’re willing to take on market risk to reach that goal, you may decide to place as much as 80% of your assets in stocks and as little as 20% in bonds. Before you decide how you’ll divide the asset classes in your portfolio, make sure you know your investment timeframe and the possible risks and rewards of each asset class.

Pay off high interest credit card debt.

There is no investment strategy anywhere that pays off as well as, or with less risk than, merely paying off all high interest debt you may have. If you owe money on high interest credit cards, the wisest thing you can do under any market conditions is to pay off the balance in full as quickly as possible.

Create and maintain an emergency fund.

Most smart investors put enough money in a savings product to cover an emergency, like sudden unemployment. Some make sure they have up to six months of their income in savings so that they know it will absolutely be there for them when they need it.

Key Performance Indicators (KPIs), Functions, Designing, Components, Challenges

Key Performance Indicators (KPIs) are measurable values that help organizations evaluate the effectiveness of their strategies, processes, or individual performance in achieving specific objectives. KPIs serve as benchmarks, providing quantitative or qualitative data to track progress over time. They help organizations focus on critical success factors, make informed decisions, and align individual or departmental efforts with strategic goals. Effective KPIs are specific, measurable, attainable, relevant, and time-bound (SMART), ensuring clarity and accountability. In employee performance management, KPIs assess productivity, quality, efficiency, customer satisfaction, or other role-specific outcomes. By monitoring KPIs, managers can identify strengths, performance gaps, and areas requiring improvement. Ultimately, KPIs transform abstract goals into actionable metrics, enabling performance evaluation, strategic planning, and continuous improvement.

Functions of Key Performance Indicators (KPIs):

  1. Performance Measurement

KPIs serve as tools to measure employee, team, and organizational performance against defined goals. They provide objective, quantifiable, or qualitative data to assess whether targets are being met. By monitoring progress, managers can identify strengths, weaknesses, and trends in performance. This function ensures accountability and enables evidence-based decision-making. Without KPIs, performance evaluation is often subjective and inconsistent. Regular measurement through KPIs allows organizations to track efficiency, productivity, and quality systematically, helping to ensure that individual and collective efforts contribute to achieving strategic objectives effectively and continuously.

  1. Goal Alignment

KPIs align individual, team, and departmental objectives with broader organizational goals. They translate strategic priorities into actionable, measurable outcomes, ensuring everyone works toward the same objectives. Clear KPIs help employees understand how their performance impacts organizational success. This function fosters coordination across departments, reduces redundant efforts, and ensures resources are focused on critical success factors. Alignment also motivates employees by providing purpose and context for their work. By connecting daily tasks to strategic goals, KPIs facilitate consistent progress, organizational coherence, and enhanced productivity, ensuring that performance management drives overall business success.

  1. Decision-Making Support

KPIs provide critical data to support informed managerial and strategic decisions. By highlighting trends, gaps, and areas of improvement, KPIs guide interventions such as training, resource allocation, or process changes. Managers can use KPI insights to prioritize initiatives, optimize workflows, and mitigate risks. This function transforms performance data into actionable intelligence, enabling proactive rather than reactive management. KPIs also assist in evaluating the effectiveness of policies, strategies, and employee contributions. Accurate and timely KPI data empowers leaders to make evidence-based decisions that improve operational efficiency, organizational performance, and long-term strategic outcomes.

  1. Motivation and Engagement

KPIs function as motivational tools by providing employees with clear expectations, performance benchmarks, and feedback on their progress. When employees understand measurable targets and see the impact of their work, engagement and accountability increase. Linking KPIs to rewards, recognition, or career growth further enhances motivation. This function encourages goal-oriented behavior, sustained effort, and self-improvement. By demonstrating that performance is valued and monitored fairly, KPIs foster a sense of achievement and purpose. Motivated employees are more productive, innovative, and committed, making KPI-driven engagement a vital function in improving overall organizational performance.

  1. Continuous Improvement

KPIs drive continuous improvement by identifying performance gaps, inefficiencies, and areas requiring enhancement. Regular monitoring allows organizations to implement corrective measures, process optimizations, or targeted training programs. Employees receive feedback that guides skill development and better decision-making. By tracking progress over time, KPIs help organizations assess the effectiveness of interventions and adjust strategies as needed. This function promotes a culture of learning, accountability, and adaptation. Continuous improvement through KPIs ensures that both individual and organizational performance evolves, fostering long-term growth, operational efficiency, and sustained competitiveness in a dynamic business environment.

  1. Resource Optimization

KPIs assist in optimizing the use of organizational resources, including time, manpower, and finances. By tracking performance metrics, managers can identify underutilized assets, overburdened staff, or inefficient processes. This function allows for better planning, allocation, and prioritization of resources to areas with the highest impact on organizational goals. KPI insights help reduce waste, improve productivity, and ensure cost-effective operations. By aligning resource deployment with performance outcomes, organizations can maximize returns on investment while maintaining employee satisfaction and operational efficiency, making resource optimization a crucial function of KPI-based performance management.

  1. Accountability and Transparency

KPIs establish accountability by clearly defining performance expectations and assigning responsibility for outcomes. Employees understand their roles, objectives, and contribution to organizational success. This function promotes transparency, as results are monitored objectively and communicated openly. Clear KPI frameworks reduce ambiguity, favoritism, or bias in evaluations. Managers can fairly assess performance, and employees can track their progress and take corrective action. Accountability and transparency foster trust, engagement, and fairness, ensuring that both individual and organizational performance are aligned, measurable, and consistently improved.

  1. Strategic Planning and Forecasting

KPIs provide data-driven insights that support strategic planning and future forecasting. By analyzing trends, performance patterns, and gaps, organizations can set realistic goals, anticipate challenges, and allocate resources effectively. This function enables scenario planning, risk assessment, and informed decision-making at both operational and strategic levels. KPIs help in evaluating the success of initiatives and adjusting strategies to meet evolving market or organizational conditions. By integrating KPI insights into planning processes, organizations ensure that strategies are evidence-based, achievable, and aligned with long-term objectives, enhancing adaptability, competitiveness, and sustainable growth.

Designing of Key Performance Indicators (KPIs):

  1. Define Organizational Goals

The first step in designing KPIs is to clearly define the organization’s strategic goals and objectives. KPIs must reflect what the organization aims to achieve in the short and long term. Without alignment to organizational goals, KPIs may measure irrelevant activities, leading to wasted resources and misdirected efforts. Managers must analyze priorities, critical success factors, and expected outcomes to ensure KPIs capture what truly matters. Clear goals provide a foundation for selecting meaningful, measurable, and actionable indicators, ensuring that employee performance contributes directly to the organization’s strategic vision and operational success.

  1. Identify Key Performance Areas (KPAs)

Designing KPIs requires identifying Key Performance Areas (KPAs) where performance has the most significant impact on organizational objectives. KPAs focus on critical aspects of work such as productivity, quality, customer satisfaction, or innovation. By isolating these areas, managers can develop KPIs that measure meaningful outcomes rather than peripheral activities. KPAs serve as a bridge between broad organizational goals and specific, actionable metrics. Selecting relevant KPAs ensures that performance management efforts target the areas that drive success, enabling employees to understand where to focus their efforts and how their performance contributes to achieving strategic objectives.

  1. Set SMART Indicators

KPIs must be designed using the SMART criteria: Specific, Measurable, Achievable, Relevant, and Time-bound. Specific KPIs define exactly what is being measured, measurable indicators allow objective tracking, achievable targets ensure realism, relevant metrics align with organizational goals, and time-bound criteria provide a clear evaluation period. Applying the SMART framework ensures clarity, accountability, and focus. Employees understand expectations, while managers can evaluate performance objectively. SMART KPIs reduce ambiguity, prevent misaligned efforts, and motivate employees by setting clear, attainable targets. This structured approach is essential for designing KPIs that drive performance improvement and strategic success.

  1. Determine Measurement Methods

An essential aspect of designing KPIs is deciding how performance will be measured. Organizations must define the data sources, collection techniques, frequency of measurement, and analytical tools required. Measurement methods can include quantitative metrics such as sales figures or production output, as well as qualitative assessments like customer feedback or peer reviews. Ensuring accuracy, reliability, and consistency in measurement is critical for credibility and fairness. The chosen methods should be feasible, cost-effective, and transparent. Proper measurement design allows managers to track progress effectively, identify performance gaps, and make informed decisions that improve both individual and organizational outcomes.

  1. Assign Accountability

Designing KPIs requires clearly assigning accountability to individuals, teams, or departments responsible for achieving the targets. Employees must understand their specific roles and how their performance impacts broader organizational goals. Accountability ensures that KPIs drive ownership, responsibility, and proactive performance management. Managers must communicate expectations, provide support, and monitor progress to maintain accountability. Without clear ownership, KPIs may fail to influence behavior or deliver results. Assigning accountability also facilitates fair evaluation, as outcomes can be linked directly to responsible parties. This component reinforces transparency, engagement, and commitment to achieving both individual and organizational objectives.

  1. Regular Review and Adjustment

KPIs should not remain static; they must be regularly reviewed and adjusted to remain relevant. Changing business conditions, market dynamics, or organizational priorities may require modifications to targets, metrics, or timeframes. Continuous review ensures that KPIs remain achievable, aligned with strategic objectives, and focused on critical success factors. Feedback from employees and managers during reviews provides insights for improvement and encourages engagement. Adjustments help prevent outdated or irrelevant KPIs from undermining performance management. Regular review and adaptation maintain the system’s effectiveness, ensuring that KPIs drive meaningful performance improvement, informed decision-making, and organizational growth.

  1. Communicate and Train

Effective KPI design involves communicating objectives, metrics, and expectations to employees and providing necessary training. Employees must understand what KPIs measure, why they matter, and how their performance contributes to organizational success. Training ensures employees have the skills, tools, and knowledge required to achieve targets. Clear communication reduces confusion, aligns individual efforts with strategic goals, and fosters engagement. Without proper awareness and preparation, KPIs may be misunderstood, misapplied, or ignored. By emphasizing communication and training, organizations create a supportive environment where employees are empowered to meet KPI expectations, improving performance and organizational outcomes.

  1. Integrate with Rewards and Development

KPIs should be linked to rewards, recognition, and employee development to motivate performance and encourage growth. When employees see a clear connection between achieving KPIs and tangible benefits, such as promotions, incentives, or skill development, they are more engaged and accountable. Integration ensures that KPIs are not just measurement tools but drivers of improvement and career advancement. Organizations can use KPI results to identify high performers, plan training programs, and provide targeted coaching. By connecting KPIs with rewards and development, organizations foster a culture of continuous improvement, motivation, and strategic alignment.

Components of Key Performance Indicators (KPIs):

  1. Specific Objectives

KPIs must be linked to specific objectives that clearly define what is being measured. Specificity ensures that employees understand the target and its relevance to organizational goals. Clear objectives reduce ambiguity and align individual efforts with strategic priorities. For example, instead of a vague goal like “improve sales,” a specific KPI would target “increase monthly sales by 10% in the North region.” Specific objectives provide focus, direction, and measurable outcomes, allowing managers to evaluate performance accurately and employees to know exactly what is expected of them. This component is fundamental for effective performance tracking.

  1. Measurable Metrics

KPIs rely on measurable metrics to quantify performance accurately. Metrics allow objective assessment, comparison over time, and benchmarking against targets or industry standards. Measurability ensures that progress can be tracked consistently and results are verifiable. Quantitative metrics, such as sales revenue or production output, and qualitative metrics, like customer satisfaction ratings, provide meaningful data. Without measurable metrics, performance evaluation becomes subjective, reducing reliability and credibility. Well-defined metrics transform organizational goals into actionable indicators, enabling informed decision-making, timely interventions, and continuous improvement in both individual and organizational performance.

  1. Achievable Targets

KPIs should set achievable targets that are realistic, attainable, and aligned with available resources, capabilities, and constraints. Unrealistic targets can demotivate employees, create stress, and encourage shortcuts or unethical practices. Achievable targets balance challenge with feasibility, motivating employees while fostering accountability. Managers must consider past performance, industry benchmarks, and organizational capacity when setting targets. Achievability ensures employees are empowered to succeed and understand the expected performance standards. By providing realistic yet challenging objectives, this component supports engagement, productivity, and continuous improvement, ensuring that KPIs effectively drive both individual and organizational performance.

  1. Relevant Indicators

KPIs must focus on relevant indicators that directly impact organizational goals. Relevance ensures that the metrics measured reflect critical success factors rather than trivial or unrelated activities. Irrelevant KPIs can misdirect effort, waste resources, and fail to improve overall performance. Relevance also aligns employee priorities with strategic objectives, enhancing focus and accountability. For example, tracking customer response time may be relevant for a support team but not for R&D. Selecting appropriate, meaningful indicators ensures that KPI data supports decision-making, performance improvement, and goal achievement, making the system effective and impactful.

  1. TimeBound Criteria

KPIs must have a clear timeframe for achievement, such as daily, monthly, quarterly, or annual targets. Time-bound criteria enable progress tracking, timely evaluation, and accountability. Deadlines create urgency, focus, and motivation while allowing managers to identify delays or performance gaps early. Without time constraints, KPIs may lack direction, making it difficult to measure success or assess improvement. Time-bound KPIs facilitate comparison over periods, trend analysis, and strategic planning. By establishing a clear timeline, this component ensures that performance is monitored systematically, objectives are achieved within expected periods, and organizational goals are met efficiently.

  1. Actionable Data

KPIs should generate actionable data that informs decision-making and guides performance improvement. Raw metrics are useful only when they lead to insights and interventions. Actionable data highlights trends, identifies gaps, and suggests corrective measures. It allows managers to provide targeted feedback, implement development initiatives, and optimize processes. Employees benefit from actionable insights by understanding areas requiring improvement and strategies to enhance performance. Without actionable data, KPIs become purely informational and fail to influence outcomes. Ensuring that KPIs produce meaningful, actionable information is crucial for continuous improvement and effective performance management.

  1. Balanced Measurement

KPIs should incorporate a balance between quantitative and qualitative measures to provide a holistic view of performance. Quantitative metrics track measurable outputs like sales, production, or revenue, while qualitative metrics assess aspects such as quality, teamwork, and customer satisfaction. Balanced measurement prevents overemphasis on numbers alone and ensures broader organizational objectives are addressed. By integrating multiple perspectives, KPIs capture overall performance, drive well-rounded development, and support informed decision-making. Balanced KPIs also enhance fairness, employee engagement, and motivation by recognizing diverse contributions beyond mere numerical targets, ensuring comprehensive performance evaluation.

  1. Continuous Review and Feedback

Effective KPIs include mechanisms for continuous review and feedback to track progress and make adjustments. Regular monitoring allows timely identification of performance gaps, resource needs, or changing circumstances. Feedback helps employees understand their performance, take corrective actions, and improve skills or productivity. Continuous review ensures KPIs remain relevant, aligned with evolving organizational goals, and achievable within existing constraints. It fosters a culture of accountability, learning, and development. By integrating review and feedback, this component ensures that KPIs are dynamic, actionable, and supportive of ongoing performance improvement rather than static benchmarks.

Challenges of Key Performance Indicators (KPIs):

  1. Selecting Relevant KPIs

Choosing the right KPIs is challenging because they must align with organizational goals and accurately reflect performance. Irrelevant or poorly defined KPIs can mislead managers, focus effort on non-critical activities, and fail to drive desired outcomes. Selecting KPIs that balance quantitative and qualitative aspects is also difficult. Employees may struggle to understand how KPIs relate to their roles if not clearly communicated. Organizations must carefully identify KPIs that measure meaningful performance indicators, ensuring clarity, relevance, and alignment with strategic objectives, otherwise the system may fail to provide actionable insights or improve productivity effectively.

  1. Overemphasis on Quantitative Metrics

KPIs often focus on measurable, numerical outcomes, which may overlook qualitative aspects like creativity, teamwork, or customer satisfaction. Overreliance on numbers can encourage short-term thinking, quantity over quality, or risk-averse behavior. Employees might prioritize meeting KPIs rather than achieving broader organizational objectives. This can reduce innovation, collaboration, and long-term performance. Balancing quantitative and qualitative metrics is essential but challenging. Failing to consider intangible contributions limits the effectiveness of KPIs as a performance management tool and may demotivate employees whose key contributions are not captured in measurable indicators.

  1. Data Collection Difficulties

Accurate KPI measurement relies on timely and reliable data, but gathering this data can be complex. Manual tracking is time-consuming, prone to errors, and inconsistent. Automated systems require investment in technology and training. Incomplete or inaccurate data can result in misleading KPI results, poor decision-making, and unfair performance evaluations. Ensuring data integrity, consistency, and accessibility across departments is critical but often challenging. Organizations must implement proper data collection processes, validation, and reporting mechanisms. Without reliable data, KPIs lose credibility, undermine trust, and fail to provide meaningful insights for improving performance.

  1. Setting Unrealistic Targets

Defining KPI targets that are too ambitious or unattainable can demotivate employees and create unnecessary stress. Conversely, setting low targets may reduce accountability and fail to drive performance improvement. Striking the right balance requires understanding capabilities, resources, and market conditions. Unrealistic targets may lead to unethical behavior, shortcuts, or gaming of the system. Continuous review and adjustment of KPIs are essential to maintain feasibility and relevance. Misaligned targets undermine the credibility of KPIs, reduce employee engagement, and impede the organization’s ability to achieve its strategic objectives effectively.

  1. Lack of Employee Understanding

Employees may not fully understand the KPIs, their purpose, or how they impact performance evaluation. This can lead to confusion, misaligned efforts, or disengagement. Without proper communication and training, employees may focus on irrelevant metrics or interpret KPIs incorrectly. Ensuring that KPIs are transparent, clearly defined, and linked to individual roles is essential. Lack of understanding diminishes the effectiveness of performance management, reduces motivation, and can foster resentment. Organizations must provide ongoing guidance, support, and feedback to ensure employees comprehend KPIs, their relevance, and how to achieve them, maximizing the value of the performance measurement system.

Responsibility Centers, Types of responsibility centers

A responsibility center is a functional entity within a business that has its own goals and objectives, dedicated staff, policies and procedures, and financial reports. It is used to give managers specific responsibility for revenues generated, expenses incurred, and/or funds invested. This allows the senior managers of a company to trace all financial activities and results of a business back to specific employees. Doing so preserves accountability, and may also be used to calculate bonus payments for employees.

There may be many responsibility centers in a business, but never less than one such center. Thus, a responsibility center is usually a subset of a business. These centers are usually stated on a firm’s organization chart.

From an accounting perspective, a financial report should be issued to each responsibility center that itemizes the revenues, expenses, profits, and/or return on investment for which the manager of each center is solely responsible. This can result in quite a large number of customized reports being issued on an ongoing basis.

The use of multiple responsibility centers requires a certain amount of corporate infrastructure to develop each center, track its results, and manage expectations with the various managers.

Types of Responsibility Centers

A responsibility center may be one of four types, which are:

Revenue center. This group is solely responsible for generating sales. A typical revenue center is the sales department. A revenue centre is a segment of the organisation which is primarily responsible for generating sales revenue. A revenue centre manager does not possess control over cost, investment in assets, but usually has control over some of the expense of the marketing department. The performance of a revenue centre is evaluated by comparing the actual revenue with budgeted revenue, and actual marketing expenses with budgeted marketing expenses. The Marketing Manager of a product line, or an individual sales representative are examples of revenue centres.

Cost center. This group is solely responsible for the incurrence of certain costs. A typical cost center is the janitorial department.

A cost or expense centre is a segment of an organisation in which the managers are held re­sponsible for the cost incurred in that segment but not for revenues. Responsibility in a cost centre is restricted to cost. For planning purposes, the budget estimates are cost estimates; for control purposes, performance evaluation is guided by a cost variance equal to the difference between the actual and budgeted costs for a given period. Cost centre managers have control over some or all of the costs in their segment of business, but not over revenues. Cost centres are widely used forms of responsibil­ity centres.

Profit center. This group is responsible for both revenues and expenses, which result in profits and losses. A typical profit center is a product line, for which a product manager is responsible.

A profit centre is a segment of an organisation whose manager is responsible for both revenues and costs. In a profit centre, the manager has the responsibility and the authority to make decisions that affect both costs and revenues (and thus profits) for the department or division. The main purpose of a profit centre is to earn profit. Profit centre managers aim at both the production and marketing of a product.

The performance of the profit centre is evaluated in terms of whether the centre has achieved its budgeted profit. A division of the company which produces and markets the products may be called a profit centre. Such a divisional manager determines the selling price, marketing programmes and production policies.

Profit centres make managers more concerned with finding ways to increase the centre’s revenue by increasing production or improving distribution methods. The manager of a profit centre does not make decisions concerning the plant assets available to the centre. For example, the manager of the sporting goods department does not make the decisions to expand the available floor space for the department.

Benefits

  • Participation in organizational plans and policies: Although profit centre managers are independent in the management of their business units, they function within the umbrella of overall organization. They get opportunities to participate in the discussion of plans and policies at the firm level. This widens their perspective and inculcates the habit of taking an integrated and macro view of activities in place of a narrow division specific view. In this process, profit centres managers can get trained to be the senior managers of their companies or other firms in the future.
  • Better planning and decision making: Profit centres managers are independent in managing the activities and are responsible for profit and success of their business units. This encourages them to make better planning, profitable decisions and exercise control. It creates a sense of accountability among the profit centre managers.
  • Beneficial competitive environment: All profit centres managers target success and profit by managing costs and aiming higher revenues. This creates a competitive environment among the managers managing their respective business units which is not only beneficial for them but also contributes in achieving the overall objectives of the firm and in maximizing the firm profit.

Contribution Centre:

It is centre whose performance is mainly measured by the contribution it earns. Contribution is the difference between sales and variable costs. It is a centre devoted to increasing contribution. The main responsibility of the manager of such a responsibility centre is to increase contribution. Higher the contribution better will be the performance of the manager of a contribution centre.

A manager has no control on fixed expenses because these expenses are constant and depend on policy decisions of the higher level of management. He can control contribution by increasing sales and by reducing variable costs. The manger of such a centre is to see that his unit operates at full capacity and contribution is maximum.

Investment center. This group is responsible not only for profits, but also for the return on funds invested in the group’s operations. A typical investment center is a subsidiary entity, for which the subsidiary’s president is responsible. An investment centre is responsible for both profits and investments. The investment centre manager has control over revenues, expenses and the amounts invested in the centre’s assets. He also formulates the credit policy which has a direct influence on debt collection, and the inventory policy which determines the investment in inventory.

error: Content is protected !!