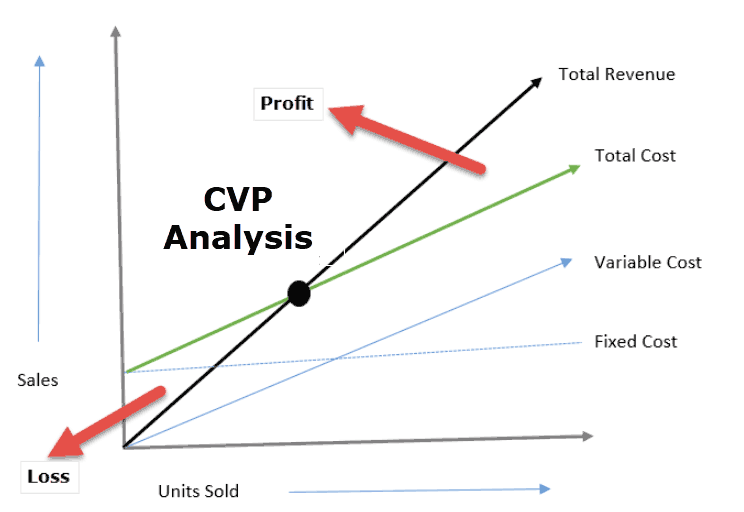
Cost-Volume-Profit (CVP) analysis is a managerial accounting tool used to study the relationship between a company’s sales volume, revenues, costs, and profits. CVP analysis helps businesses make informed decisions regarding pricing, sales mix, and other operational factors. This analysis is useful for businesses of all sizes and industries.
Components of CVP analysis are:
Sales Volume (Q):
Sales volume is the total quantity of goods or services sold within a given period.
Sales Revenue (R):
Sales revenue is the total amount of revenue generated from the sale of goods or services. It is calculated by multiplying the sales volume by the selling price per unit (P).
R = P × Q
Variable Costs (VC):
Variable costs are costs that vary with changes in sales volume or level of activity. Examples of variable costs include direct materials, direct labor, and variable overhead costs. The total variable costs (TVC) can be calculated by multiplying the variable cost per unit (VCu) by the sales volume (Q).
TVC = VCu × Q
Fixed Costs (FC):
Fixed costs are costs that do not vary with changes in sales volume or level of activity. Examples of fixed costs include rent, depreciation, salaries, and property taxes. The total fixed costs (TFC) remain constant regardless of the sales volume.
Contribution Margin (CM):
Contribution margin is the amount of revenue available to cover the fixed costs and generate a profit. It is calculated as the difference between sales revenue and total variable costs.
CM = R – TVC
Break-Even Point (BEP):
The break-even point is the level of sales volume at which the total revenues equal the total costs. At this point, the business is neither making a profit nor incurring a loss. The break-even point can be calculated by dividing the total fixed costs by the contribution margin per unit (CMu).
BEP = TFC / CMu
The above formulas can be used to perform a variety of CVP analysis calculations. Some of the most common CVP analysis applications are:
Determining the Sales Volume required to break even:
To determine the sales volume required to break even, the business must first calculate its contribution margin per unit and divide it into the total fixed costs.
BEP = TFC / CMu
Once the break-even point is calculated, the business can determine the level of sales volume required to cover all of its costs and break even.
Determining the Sales Volume required to achieve a target profit:
To determine the sales volume required to achieve a target profit, the business must first calculate its contribution margin per unit. Then, it should subtract the target profit from the total fixed costs and divide the result by the contribution margin per unit.
Target Sales Volume = (TFC + Target profit) / CMu
The business can then use this information to set sales targets and pricing strategies to achieve the desired level of profit.
Evaluating the impact of changes in sales volume on profits:
By analyzing the relationship between sales volume, costs, and profits, businesses can evaluate the impact of changes in sales volume on their profitability. For example, they can calculate the contribution margin and net profit for different levels of sales volume and determine the most profitable sales mix.
Evaluating the impact of changes in selling prices on profits:
By analyzing the relationship between selling prices, costs, and profits, businesses can evaluate the impact of changes in selling prices on their profitability. For example, they can calculate the contribution margin and net profit for different selling prices and determine the optimal pricing strategy.
Evaluating the impact of changes in variable costs on profits:
By analyzing the relationship between variable costs, selling prices, and profits, businesses can evaluate the impact of changes in variable costs on their profitability. For example, they can calculate the contribution margin and net profit for different variable costs and determine the optimal cost structure.
Evaluating the impact of changes in the sales mix on profits:
By analyzing the relationship between different products’ sales volume, selling prices, and variable costs, businesses can evaluate the impact of changes in the sales mix on their profitability. For example, they can calculate the contribution margin and net profit for different product mixes and determine the most profitable sales mix.
Evaluating the impact of changes in fixed costs on profits:
By analyzing the relationship between fixed costs, sales volume, and profits, businesses can evaluate the impact of changes in fixed costs on their profitability. For example, they can calculate the break-even point and net profit for different levels of fixed costs and determine the optimal cost structure.
Assumptions of Cash Volume Profit Analysis
Following are the assumptions of CVP Analysis:
(i) No. of Units – Only Driver for Costs and Revenues
It assumes that the total variable costs and revenues would increase or decrease only due to a change in no. of units. There are no factors that will affect it.
(ii) Costs – Either Variable or Fixed
This assumption says that all the costs are either variable or fixed. In other words, it says that there are no semi-variable or semi-fixed costs.
(iii) No Change in Price, Variable Cost, and Fixed Costs
CVP analysis assumes that there are no changes in the price and variable cost per unit irrespective of change in time period and relevant range. If we see closely, it is neglecting the chances of changes in prices due to inflation, economic conditions etc. Also, neglecting the bulk order discounts and small order premiums.
Importance of Cash Volume Profit Analysis
If you are offered a business idea wherein you sell chairs. The first thing few things that will strike your mind is
- Required initial investment
- Amount of sales required to breakeven
- Assess whether you are capable of achieving that sale
This analysis is important because it answers the second most important question. This is not a one time question as well. This is a regular assessment. A businessman has to keep checking whether he is reaching the milestones set as per cost volume profit analysis. This will guide his decision-making process relating to increases in fixed costs, the speed of business operations etc.
Advantages of Cash Volume Profit Analysis
(i) Helps managers find out a breakeven point, target operating income etc.
(ii) Cost Volume Profit technique is used to evaluate investment proposals
(iii) Sets the base for planning the marketing efforts of a business
(iv) Helps in setting up the basis for budgeting activity
Disadvantages of Cash Volume Profit Analysis
(i) In a current dynamic business environment, the costs and prices can’t remain constant throughout the year. A manager is forced to react and make necessary changes in prices and costs due to change in economic conditions, customer bargaining powers, competitors etc.
(ii) All costs cannot be classified as fixed or variable. There is a significant list of costs which are neither fixed nor variable but are semi-variable or semi-fixed. Say, for example, a utility or electricity invoice contains rent as a component which remains constant irrespective of the change in usage of no. of electricity units.
(iii) No. of units cannot be the only driver of total costs and revenues. There are other factors also that impact the prices as well as costs. The raw material price reduction can reduce the variable cost and therefore the customers with knowledge of this change will demand a reduction in prices as well. Similarly, the entrance of a new big player in the market forces all the firms in the market to reduce their cost or compromise or bear loss of customers.
Like this:
Like Loading...
 by
by