Investors attitude towards Risk and Return

Investors’ Attitudes towards risk and return are foundational elements in the study and practice of finance, particularly in the realm of investment decisions. These attitudes significantly influence individual investment choices, portfolio construction, and risk management strategies. Understanding the nuanced relationship between risk and return and how different investors react to this dynamic is crucial for both personal finance and institutional investment management.

Risk-Return TradeOff

The risk-return trade-off is a fundamental principle in finance that asserts higher potential returns are associated with higher levels of risk. This means that to achieve greater returns on investments, investors must be willing to accept greater volatility and uncertainty in the performance of their investments. Conversely, lower-risk investments typically offer lower potential returns. The challenge for investors is to find the balance between risk and return that aligns with their financial goals, risk tolerance, and investment horizon.

Investors’ Risk Tolerance

Investors’ attitudes towards risk, or risk tolerance, can vary widely based on individual circumstances, preferences, and objectives. Risk tolerance is influenced by several factors:

  • Financial Goals:

The nature and timeframe of an investor’s financial objectives (e.g., saving for retirement, generating income, capital preservation) can significantly impact their willingness to take on risk.

  • Investment Horizon:

Longer investment horizons often allow investors to take on more risk, as there is more time to recover from potential market downturns.

  • Financial Situation:

An investor’s current and expected future financial situation, including income, wealth, and liabilities, affects their ability to absorb losses.

  • Past Experiences:

Personal experiences with investments, including losses or gains made during market fluctuations, can shape an investor’s risk perception and tolerance.

  • Psychological Factors:

Personality traits, such as propensity for risk-taking, fear of loss, and confidence in decision-making, also play roles in determining risk tolerance.

Adjusting Portfolios Based on Risk Tolerance

Based on their risk tolerance, investors might adopt different investment strategies and construct their portfolios accordingly:

  • Conservative (Low Risk-Tolerance):

Investors with low risk-tolerance or a need for capital preservation tend to favor safer investments, such as bonds, fixed deposits, and high-quality dividend-paying stocks. These investors prioritize the protection of capital over high returns.

  • Moderate (Medium Risk-Tolerance):

Investors comfortable with moderate levels of risk often build diversified portfolios that include a mix of equities, bonds, and other asset classes. This approach seeks to balance the potential for moderate growth with risk management.

  • Aggressive (High Risk-Tolerance):

High risk-tolerance investors aim for higher returns and are willing to accept significant volatility. Their portfolios may heavily feature stocks, including those of start-ups and growth-oriented companies, along with alternative investments and speculative assets.

Behavioral Finance

Behavioral finance studies how psychological influences and cognitive biases affect the financial behaviors of investors and financial practitioners. Key concepts include:

  • Overconfidence:

Overestimating one’s ability to predict market movements can lead to taking excessive risks.

  • Loss Aversion:

The fear of losses can cause investors to be overly conservative or to sell assets hastily during downturns.

  • Herd Behavior:

Following the investment choices of others without independent analysis can lead to suboptimal risk-taking.

Risk Preference of investors

Risk preference is a fundamental determinant of investment behavior, shaping individuals’ and organizations’ attitudes towards risk and influencing their investment decisions. By understanding their risk preferences, investors can construct portfolios that align with their financial goals, time horizon, and comfort level with uncertainty. Financial advisors and investment professionals play a vital role in assessing clients’ risk preferences, providing personalized advice, and helping clients navigate the complex landscape of risk and return. Ultimately, effective risk management requires a balanced approach that considers both the potential for returns and the tolerance for risk, ensuring investors can achieve their financial objectives while maintaining peace of mind.

Understanding risk preference is essential in finance and investment as it shapes individuals’ and organizations’ decisions regarding asset allocation, portfolio construction, and investment strategies. Risk preference refers to an individual’s or entity’s attitude towards risk, indicating their willingness to accept uncertainty and potential losses in pursuit of higher returns. Different investors have varying risk preferences influenced by factors such as financial goals, time horizon, wealth, personality traits, and past experiences.

Types of Risk Preference:

  • Risk-Averse:

Risk-averse investors prioritize capital preservation and prefer investments with lower volatility and assured returns, even if it means sacrificing potential gains. They tend to favor safer assets like bonds, fixed deposits, and blue-chip stocks, avoiding speculative or high-risk ventures.

  • RiskNeutral:

Risk-neutral investors are indifferent to risk and solely focus on maximizing expected returns. They are willing to accept any level of risk as long as the potential returns outweigh it. Their investment choices are guided by rational analysis of expected returns and probabilities, without being influenced by risk aversion or risk-seeking behavior.

  • Risk-Seeking (RiskLoving):

Risk-seeking investors are inclined towards investments with higher risk and volatility in pursuit of potentially higher returns. They are comfortable with uncertainty and view risk as an opportunity rather than a threat. Risk-seeking behavior is often associated with younger investors, entrepreneurs, and speculators.

Measurement of Risk Preference:

  1. Psychometric Tests:

Psychometric tests assess individual personality traits, attitudes, and behaviors towards risk. These tests measure risk preference indirectly by evaluating factors such as risk tolerance, loss aversion, and sensation-seeking tendencies.

  1. Questionnaires and Surveys:

Questionnaires and surveys are commonly used tools to gauge investors’ risk preferences. These instruments ask investors about their willingness to take risks, investment goals, time horizon, and past experiences to determine their risk tolerance levels.

  1. Investment Behavior Analysis:

Investment behavior analysis involves observing investors’ actual investment decisions, portfolio composition, and trading patterns to infer their risk preferences. This method provides insights into investors’ risk-taking behavior in real-world scenarios.

  1. Utility Theory:

Utility theory quantifies investors’ risk preferences by measuring their utility or satisfaction derived from various investment outcomes. By analyzing the trade-offs between risk and return, utility theory models investors’ risk preferences mathematically.

Factors Influencing Risk Preference:

  1. Financial Goals:

Investors’ risk preferences are influenced by their financial objectives, such as wealth accumulation, income generation, capital preservation, or funding retirement. Goals that require long-term growth may necessitate higher risk tolerance.

  1. Time Horizon:

The time horizon over which investors plan to hold investments affects their risk preference. Longer time horizons provide more opportunity to recover from short-term losses, allowing investors to tolerate higher risk.

  1. Wealth and Income Levels:

High-net-worth individuals and institutions may have higher risk tolerance due to their ability to absorb losses. Conversely, individuals with limited financial resources may exhibit more risk-averse behavior.

  1. Age and Life Stage:

Younger investors often have a higher risk appetite as they have more time to recover from losses and can afford to take on greater risk in pursuit of higher returns. As investors approach retirement, they tend to become more risk-averse to protect their accumulated wealth.

  1. Personality Traits:

Individual personality traits, such as optimism, overconfidence, fear of regret, and loss aversion, significantly influence risk preference. These traits shape investors’ perceptions of risk and their willingness to accept it.

  1. Past Experiences:

Previous investment experiences, successes, and failures play a crucial role in shaping investors’ risk preferences. Positive experiences may increase risk tolerance, while negative experiences can lead to risk aversion and loss aversion behavior.

Implications of Risk Preference in Investment Decision-Making:

  1. Asset Allocation:

Risk preference guides asset allocation decisions, determining the proportion of investments allocated to different asset classes such as stocks, bonds, real estate, and commodities. Risk-averse investors typically allocate more to safer assets, while risk-seeking investors may favor equities and alternative investments.

  1. Portfolio Construction:

Investors construct portfolios aligned with their risk preferences, diversifying across assets with varying risk-return profiles to achieve a balance between risk and return. Conservative portfolios may include more fixed-income securities, while aggressive portfolios may have higher allocations to equities and growth-oriented assets.

  1. Investment Strategy:

Risk preference influences investment strategies, including buy-and-hold, value investing, growth investing, and momentum trading. Risk-averse investors may prefer passive strategies with lower turnover, while risk-seeking investors may engage in active trading and speculative ventures.

  1. Risk Management:

Understanding risk preference is essential for effective risk management. Investors implement risk management techniques such as stop-loss orders, hedging strategies, and diversification to mitigate risk exposure and protect against adverse market movements.

  1. Financial Planning:

Financial advisors consider clients’ risk preferences when developing personalized financial plans, ensuring investments align with clients’ goals, time horizon, and risk tolerance. This helps manage expectations and reduces the likelihood of investor dissatisfaction or panic during market downturns.

Meaning of Return, Measures of Return, Holding period of Return, Annualized return, Expected Return

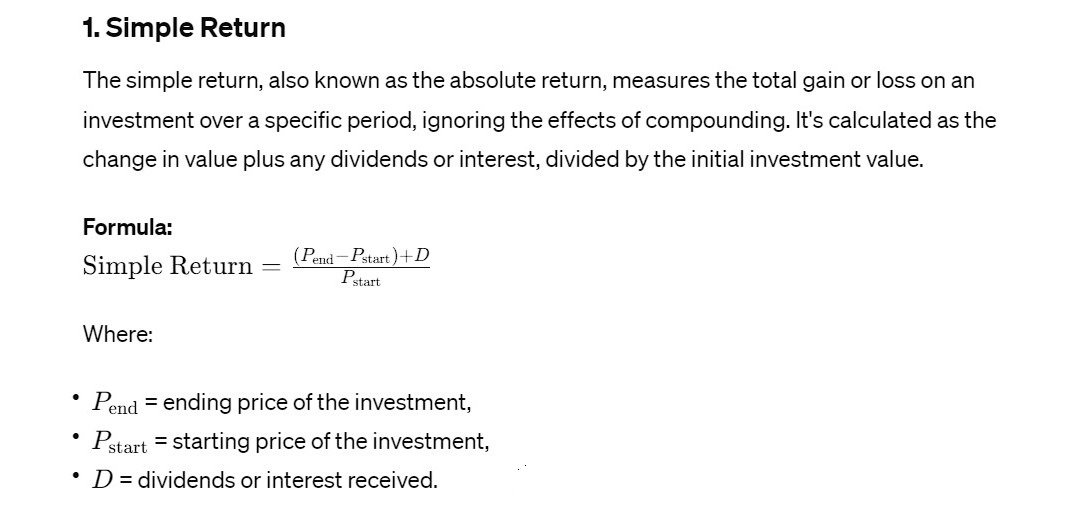
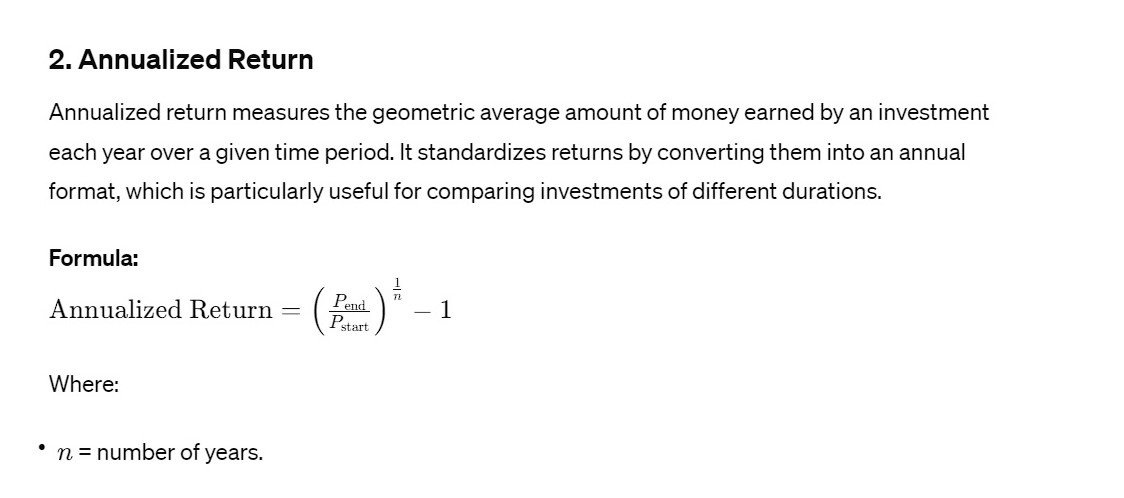
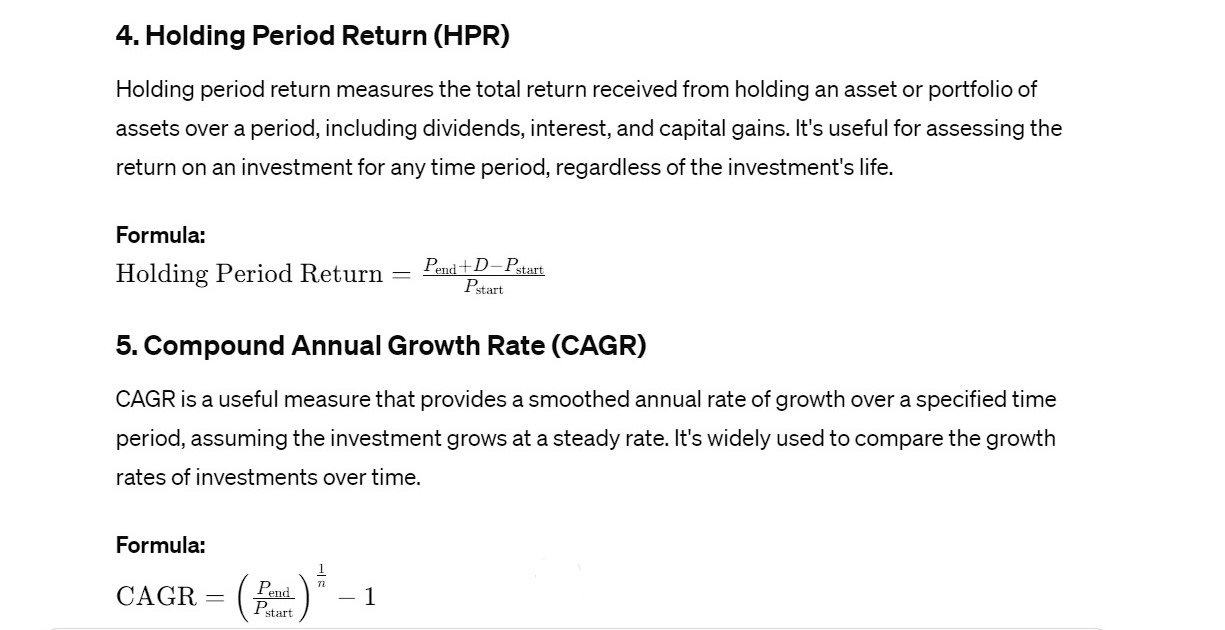
Return in finance refers to the profit or loss generated on an investment over a specific period, typically expressed as a percentage of the initial investment amount. It represents the financial gains or losses an investor realizes from their investment activity and is a key measure of investment performance. Understanding the concept of return is essential for investors as it helps assess the effectiveness of investment decisions, evaluate the performance of investment portfolios, and make informed decisions about future investment opportunities.

Returns can be classified into two main categories: absolute returns and relative returns.

  1. Absolute Returns:

Absolute returns measure the actual monetary gain or loss generated by an investment over a specific period. It represents the difference between the final value of the investment and its initial cost, irrespective of external factors. Absolute returns provide a clear picture of the profitability of an investment and are expressed in terms of currency units (e.g., dollars, euros).

  1. Relative Returns:

Relative returns compare the performance of an investment against a benchmark or a reference index. It assesses how well an investment has performed relative to a standard measure of performance. Relative returns are particularly useful for evaluating the performance of actively managed investment portfolios compared to a passive benchmark. They provide insights into whether an investment has outperformed or underperformed the market or a specific asset class.

Returns can be generated from various sources:

  • Capital Appreciation:

Capital appreciation occurs when the market value of an investment increases over time, resulting in a profit when the investment is sold at a higher price than its purchase price.

  • Income Generation:

Income generation involves earning periodic payments from an investment, such as interest, dividends, or rental income. These payments contribute to the overall return generated by the investment.

  • Dividend Reinvestment:

Dividend reinvestment involves using dividends received from an investment to purchase additional shares or units of the same investment, thereby increasing the potential for future returns through compounded growth.

Measures of Return

Types off Risk, Measuring Risk

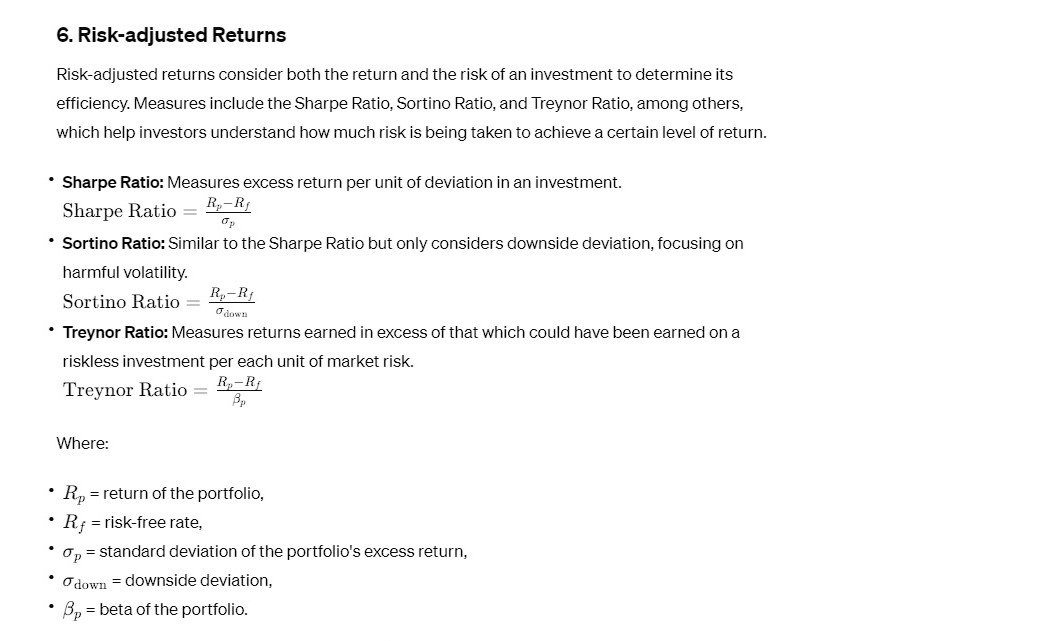
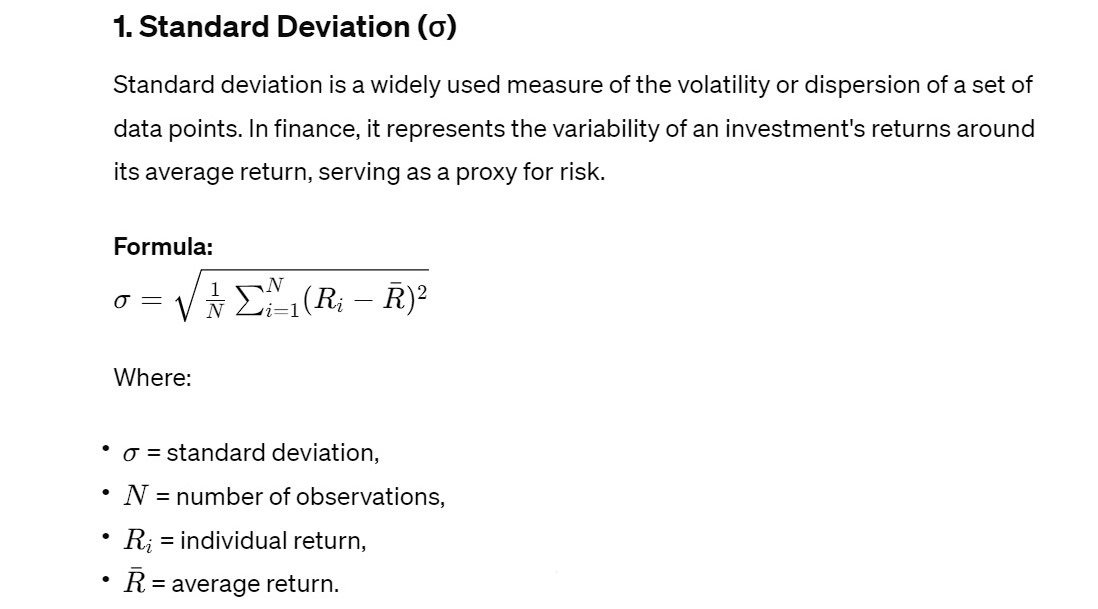
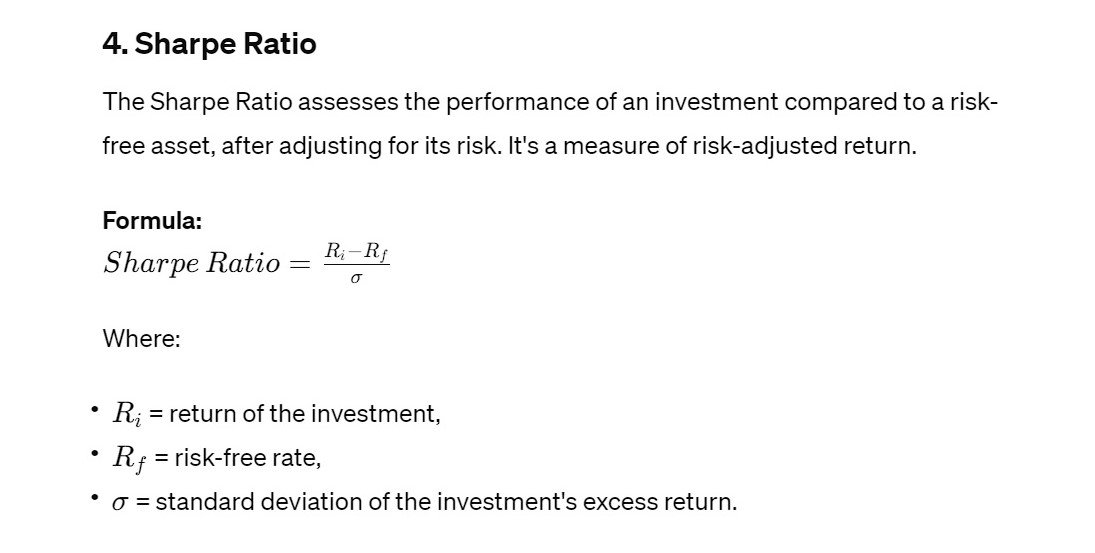
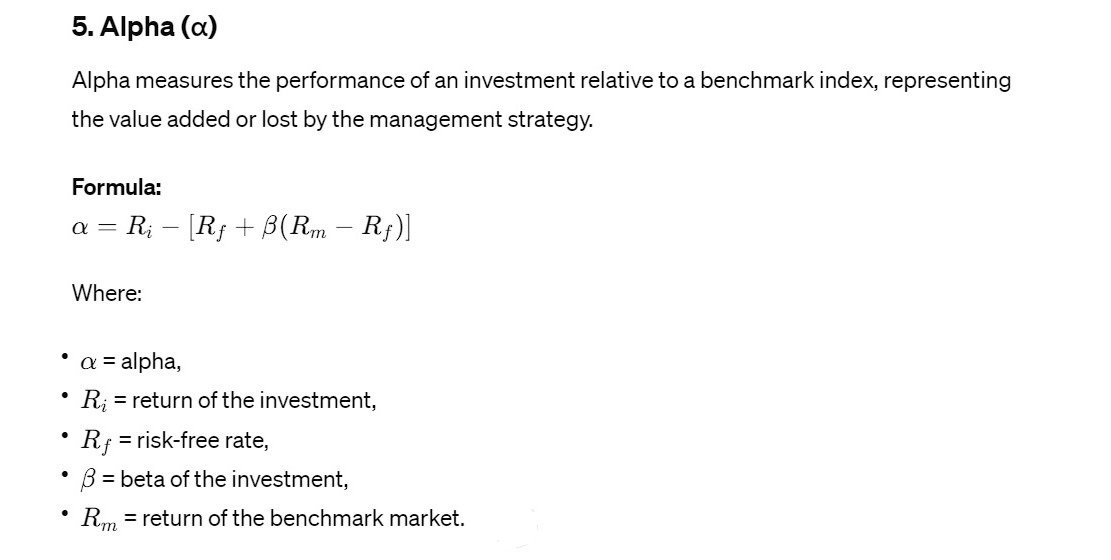
Risk in the context of finance and investment, refers to the uncertainty regarding the financial returns or outcomes of an investment, and the potential for an investor to experience losses or gains different from what was initially expected. It is a fundamental concept that underpins nearly all financial decisions and strategies. The essence of risk is the variability of returns, which can be influenced by a myriad of factors, including economic changes, market volatility, political instability, and specific events affecting individual companies or industries.

  1. Market Risk (Systematic Risk)

Market risk, also known as systematic risk, encompasses the risk inherent to the entire market or market segment. It is the uncertainty that any financial instrument might face due to fluctuations in market variables such as interest rates, foreign exchange rates, stock prices, and commodity prices. Market risk cannot be eliminated through diversification because it affects all investments to some degree. This type of risk is influenced by geopolitical events, economic recessions, and changes in fiscal policy. Investors manage market risk through hedging strategies and asset allocation.

  1. Credit Risk (Default Risk)

Credit risk, or default risk, refers to the possibility that a borrower will fail to meet their obligations in accordance with agreed terms. This risk is of particular concern to lenders, bondholders, and creditors. Credit risk assessment models evaluate the likelihood of default. To mitigate credit risk, lenders often require collateral or use credit derivatives and diversify their lending portfolio across various sectors and borrowers.

  1. Liquidity Risk

Liquidity risk involves the risk that an entity will not be able to meet its short-term financial obligations due to the inability to convert assets into cash without significant loss. It affects both individuals and institutions and can be subdivided into asset liquidity risk and funding liquidity risk. Asset liquidity risk is the difficulty in selling assets quickly at their fair value, while funding liquidity risk relates to the challenge in obtaining funds to meet obligations. Management strategies include maintaining adequate cash reserves and having access to reliable funding sources.

  1. Operational Risk

Operational risk is associated with failures in internal processes, people, and systems, or from external events. This includes everything from business disruptions, system failures, fraud, and cyberattacks to legal risks and natural disasters. Unlike market or credit risk, operational risk is more difficult to quantify and manage because it encompasses a wide range of unpredictable factors. Organizations address operational risk through robust internal controls, continuous monitoring, and having effective disaster recovery and business continuity plans.

  1. Country and Political Risk

Country risk involves the uncertainties that international investing brings, including economic, political, and social instability in the country where the investment is made. Political risk refers more specifically to the risk of loss from changes in government policy, expropriation of assets, and civil unrest. These risks can affect the overall investment climate and specific asset values. Investors mitigate these risks through geopolitical analysis, diversification, and sometimes, by purchasing political risk insurance.

  1. Interest Rate Risk

Interest rate risk is the risk that an investment’s value will change due to a change in the absolute level of interest rates, in the spread between two rates, in the shape of the yield curve, or in any other interest rate relationship. This type of risk particularly affects bonds, as their prices are inversely related to interest rates. Managing interest rate risk involves adjusting portfolio duration, diversifying across different types of rates, and using interest rate derivatives.

Measuring Risk

FN2 Security Analysis and Portfolio Management Bangalore University BBA 6th Semester NEP Notes

Unit 1 [Book]
Investments Introduction VIEW
Investment Process VIEW
Criteria for Investment VIEW
Types of Investors VIEW
Investment, Speculation and Gambling VIEW
Elements of Investment VIEW
Investment Avenues VIEW
Factors influencing Selection of Investment alternatives VIEW
Security Market Introduction, Functions VIEW
Secondary Market Operations VIEW
Stock Exchanges in India VIEW
Security Exchange Board of India VIEW
Government Securities Market VIEW
Corporate Debt Market VIEW
Money Market Instruments VIEW


Unit 2 Risk-Return Relationship [Book]
Risk-Return Relationship VIEW
Meaning of Risk VIEW
Types off Risk, Measuring Risk VIEW
Risk Preference of investors VIEW
Meaning of Return, Measures of Return, Holding period of Return, Annualized return, Expected Return VIEW
Investors attitude towards Risk and Return VIEW


Unit 3 Fundamental Analysis and Technical Analysis [Book]
Introduction, Investment Analysis VIEW
Fundamental Analysis VIEW
Macro-Economic Analysis VIEW
Industry Analysis VIEW
Company Analysis VIEW
Trend Analysis VIEW
Ratio Analysis VIEW


Unit 4 Technical Analysis [Book]
Technical Analysis VIEW
Fundamental Analysis Vs. Technical Analysis VIEW
Charting Techniques VIEW
Technical Indicators VIEW
Testing Technical Trading Rules VIEW
Evaluation of Technical Analysis VIEW


Unit 5 Portfolio Management [Book]
Portfolio Management, Framework, Portfolio Analysis, Selection and Evaluation, Meaning of portfolio, Reasons to hold Portfolio Diversification analysis VIEW
Markowitz’s Model, Assumptions, Specific model VIEW
Risk and Return Optimization VIEW
Efficient Frontier VIEW
Efficient Portfolios VIEW
Leveraged Portfolios VIEW
Corner Portfolios VIEW
Sharpe’s Single Index Model VIEW
Portfolio evaluation Measures VIEW
Sharpe’s Performance Index VIEW
Treynor’s Performance Index VIEW
Jensen’s Performance Index VIEW

Exchange-Traded Derivatives vs. OTC Derivatives

Exchange-Traded Derivatives (ETDs) are standardized financial contracts traded on organized exchanges like NSE, BSE, or MCX. These derivatives include futures and options based on underlying assets such as stocks, indices, commodities, or currencies. ETDs are regulated by authorities like SEBI, ensuring transparency, reduced counterparty risk, and investor protection. Because they are standardized in terms of contract size, expiration, and settlement procedures, ETDs offer greater liquidity and price discovery. Clearing houses guarantee the settlement of trades, reducing the risk of default. These features make ETDs highly accessible and reliable for both hedgers and speculators in financial markets.

Features of an Exchange-Traded Derivatives:

  • Standardization

Exchange-traded derivatives (ETDs) are highly standardized in terms of contract size, expiration date, tick size, and settlement procedures. This uniformity facilitates easy trading, pricing, and comparison across markets. Standardization ensures that all participants deal with the same terms, enhancing market efficiency and transparency. It also enables the exchange to manage risk better by clearly defining contract parameters. This feature is particularly attractive to investors seeking consistency and reliability when entering and exiting derivative positions on a regulated platform.

  • Regulation and Transparency

ETDs are traded on regulated exchanges such as NSE or BSE, under the supervision of regulatory bodies like SEBI in India. This ensures high levels of transparency, accountability, and investor protection. All trades are reported and recorded, providing complete visibility into market activity. This regulated environment builds confidence among retail and institutional investors alike, and minimizes the chances of market manipulation, insider trading, and unfair practices. Transparency also supports more accurate price discovery, which is essential for informed trading and investment decisions.

  • Counterparty Risk Mitigation

A key feature of exchange-traded derivatives is the elimination of counterparty risk through the use of a clearinghouse. The clearing corporation acts as the central counterparty for all transactions, guaranteeing the performance of both buyer and seller. This mechanism ensures that even if one party defaults, the other does not incur a loss. Margin requirements, daily mark-to-market settlement, and stringent risk controls by clearinghouses further secure the system. This makes ETDs far safer than Over-the-Counter (OTC) derivatives in terms of counterparty exposure.

  • High Liquidity

ETDs are known for their high liquidity due to large participation from retail traders, institutional investors, and speculators. This liquidity ensures that positions can be opened or closed quickly without significantly affecting the market price. Higher liquidity also results in narrow bid-ask spreads, which reduces trading costs. Because of the consistent trading volume and market depth, exchange-traded derivatives are ideal for short-term trading strategies, arbitrage opportunities, and quick hedging adjustments, thereby enhancing overall market activity and investor engagement.

  • Price Discovery

ETDs play a crucial role in price discovery by aggregating the expectations of various market participants about the future value of an asset. Since trades occur on a transparent platform with high volume, the prices reflect real-time market sentiment and information. This helps producers, consumers, traders, and investors make more informed decisions. Accurate price discovery is especially important in commodity and equity markets, where future planning depends heavily on anticipated prices. Thus, ETDs serve both as risk management tools and forecasting instruments.

  • Low Credit Risk

Due to centralized clearing and the use of margin systems, ETDs are associated with very low credit risk. Clearinghouses ensure trade settlement and enforce daily mark-to-market adjustments, collecting margin payments to cover potential losses. This structure minimizes the risk of default and makes the trading environment more secure. For individual investors and institutions alike, the low credit risk associated with ETDs is a compelling advantage compared to more flexible but riskier OTC derivatives.

  • Ease of Entry and Exit

The standardized nature and high liquidity of ETDs enable easy entry and exit for traders. Orders can be placed instantly through brokers or online platforms, with real-time execution and confirmation. This is beneficial for short-term traders, hedgers, or institutional participants who need to adjust their positions quickly. In contrast to OTC contracts, which may involve lengthy negotiations, ETDs offer a more user-friendly experience. This simplicity is especially attractive to newer market participants who seek efficiency and accessibility.

  • Lower Transaction Costs

ETDs usually involve lower transaction costs compared to OTC derivatives. Because of high liquidity, narrow bid-ask spreads, and competition among brokers, traders can execute orders with minimal cost. Also, exchanges benefit from economies of scale and pass on cost savings to participants. Moreover, the elimination of bilateral negotiations and legal arrangements further reduces overhead. Lower transaction costs make exchange-traded derivatives suitable for frequent trading and help improve net returns for both individual and institutional investors.

Over the Counter (OTC) Derivatives

Over-the-Counter (OTC) Derivatives are customized financial contracts traded directly between two parties, outside of formal exchanges. These derivatives include forwards, swaps, and bespoke options tailored to specific needs of institutions or investors. Unlike exchange-traded derivatives, OTC contracts are not standardized, and they carry a higher counterparty risk due to the absence of a clearinghouse. However, they offer greater flexibility in terms of contract size, duration, and underlying asset. OTC derivatives are commonly used by financial institutions and large corporations for hedging complex financial exposures, such as interest rate fluctuations or currency risk, making them vital to global financial markets.

Features of an Over the Counter (OTC) Derivatives:

  • Customization

Over-the-Counter (OTC) derivatives are highly customizable, which means they are tailored to meet the specific needs of the parties involved. Unlike exchange-traded derivatives, OTC contracts can be adjusted in terms of contract size, expiration date, and underlying assets. This flexibility makes OTC derivatives particularly useful for large institutions or sophisticated investors who require specific hedging solutions or wish to structure complex transactions. Customization provides better alignment with the investor’s risk profile and financial objectives, enhancing the efficiency of the hedging strategy or speculative position.

  • Counterparty Risk

OTC derivatives involve significant counterparty risk because they are traded directly between two parties without an intermediary, such as a clearinghouse. If one party defaults, the other may incur financial losses. This risk is higher in OTC markets compared to exchange-traded derivatives, where clearinghouses guarantee trade settlement. To mitigate counterparty risk in OTC contracts, parties typically engage in credit checks and negotiate collateral arrangements. However, the risk still exists, making it essential for participants to carefully assess the financial stability of their counterparties before entering into OTC transactions.

  • Lack of Standardization

OTC derivatives lack the standardization seen in exchange-traded derivatives. Contracts are tailored to the needs of the parties involved, which means they can vary in terms of contract size, maturity, and terms. While this customization allows for greater flexibility, it also increases the complexity of the transactions. Unlike exchange-traded derivatives, where the terms are predetermined and widely understood, OTC contracts require thorough negotiation and documentation. The absence of standardization can create challenges in pricing, comparison, and liquidity, making OTC derivatives more suited for experienced participants.

  • Market Liquidity

The liquidity of OTC derivatives is generally lower compared to exchange-traded derivatives, as these contracts are negotiated privately between two parties. The lack of a central exchange means there is no continuous price discovery mechanism, and the market may be more fragmented. As a result, entering or exiting positions in OTC markets can be more difficult, particularly for less liquid products. Liquidity risks are higher in OTC markets, especially for bespoke contracts, which may not have readily available buyers or sellers, leading to higher transaction costs and price fluctuations.

  • Regulatory Oversight

OTC derivatives are subject to less regulatory oversight compared to exchange-traded derivatives. While regulatory bodies like SEBI in India or the CFTC in the U.S. have begun to impose stricter regulations on the OTC markets following the 2008 financial crisis, the regulatory framework remains less comprehensive. This lack of standard regulation increases the risk of market abuse, lack of transparency, and systemic risks. However, over the years, regulations such as mandatory reporting and clearing requirements have been introduced to improve oversight and reduce the risk associated with OTC derivatives.

  • Flexibility in Settlement Terms

OTC derivatives offer flexibility in settlement terms, which can be customized according to the parties’ requirements. Settlement can be structured in a variety of ways, including physical settlement, where the underlying asset is delivered, or cash settlement, where the net difference between the contract price and market price is paid. The ability to adjust settlement terms based on the specific needs of the parties involved is one of the primary advantages of OTC derivatives. This flexibility helps institutions align their derivative positions with broader business or financial strategies.

  • Pricing Complexity

Pricing OTC derivatives can be more complex than exchange-traded derivatives because these contracts do not have standardized terms. Since OTC contracts are bespoke, they require in-depth analysis to determine their value. Unlike exchange-traded derivatives, where market prices are readily available due to standardization, OTC derivatives are often privately negotiated, meaning their prices depend on a variety of factors, including market conditions, the creditworthiness of the counterparties, and the specific terms of the contract. This pricing complexity can make OTC derivatives harder to value and manage, especially for less experienced participants.

  • Diverse Range of Products

OTC derivatives encompass a wide range of products that are not typically available on exchanges. These include forwards, swaps, and bespoke options, as well as more complex structures like credit default swaps and interest rate swaps. This diversity allows financial institutions to tailor products to meet specific hedging or speculative needs. For example, corporations can use OTC derivatives to hedge foreign exchange risk, interest rate movements, or commodity price fluctuations. The ability to structure a variety of products according to individual requirements makes OTC derivatives indispensable for many large financial institutions and multinational corporations.

Key differences between Exchange-Traded Derivatives and OTC Derivatives

Aspect Exchange-Traded Derivatives (ETDs) Over-the-Counter (OTC) Derivatives
Standardization High Low
Liquidity High Low
Counterparty Risk Low (clearinghouse) High (direct counterparties)
Regulation High (regulated exchanges) Low (fewer regulations)
Transparency High (publicly traded) Low (private deals)
Customization Low (standard contracts) High (bespoke contracts)
Pricing Transparent (market-based) Complex (negotiated)
Settlement Standardized (clearinghouse) Flexible (negotiated terms)
Market Access Open to all (retail & institutional) Primarily institutional
Regulatory Oversight Stringent (government bodies) Limited (fewer regulatory controls)
Risk Management Standardized risk controls Negotiated risk management strategies
Market Participants Broad (multiple participants) Limited (customized for specific needs)
Transaction Costs Low (due to liquidity) High (due to complexity and customization)

Instruments available for Trading and Electronic Spot Exchanges

Trading and Electronic Spot Exchanges refer to digital platforms that facilitate real-time buying and selling of physical commodities like grains, spices, and metals. These exchanges ensure transparency, fair pricing, and quicker settlements. Unlike traditional markets, electronic spot exchanges provide direct access to farmers, traders, and buyers nationwide. They support efficient logistics, grading, and warehousing through electronic systems. Key examples include NCDEX e-Markets and National Spot Exchange. By eliminating middlemen and promoting direct trade, these platforms empower producers and improve market access, driving financial inclusion and efficiency in the commodities market.

Instruments available for Trading:

  • Futures Contracts

Futures contracts are standardized agreements to buy or sell a specific quantity of a commodity at a predetermined price on a set future date. Traded on regulated commodity exchanges, these contracts allow market participants to hedge against price fluctuations or speculate on future movements. Their standardization—fixed quantity, quality, and delivery dates—facilitates transparency and liquidity. Futures help producers lock in prices to manage risk, while consumers and speculators can secure favorable pricing. The daily mark-to-market process and margin requirements further enhance risk management, ensuring that contracts are settled promptly, reducing counterparty risk, and reinforcing overall market stability.

  • Options Contracts

Options contracts give buyers the right, but not the obligation, to buy or sell a specified amount of an underlying commodity at a predetermined price before or at a set expiration date. There are two types: call options, which enable purchase, and put options, which enable sale. This instrument enables investors to hedge risks or speculate with limited downside exposure—the maximum loss is confined to the premium paid. Options allow flexibility as traders can choose whether to exercise their rights based on market conditions. Their asymmetric payoff profile makes them valuable tools for both risk management and tactical trading strategies in volatile commodity markets.

  • Forward Contracts

Forward contracts are over-the-counter agreements that specify the purchase or sale of a commodity at a future date for a price agreed upon today. Unlike futures, forwards are customized contracts between counterparties, tailored to their specific hedging or speculative needs. Their flexibility regarding quantity, quality, and settlement dates allows producers and consumers to manage risk more precisely. However, the lack of standardization and clearinghouse backing introduces greater counterparty risk. Forwards are frequently used by businesses to smooth out price volatility and plan budgets, despite their lower liquidity compared to exchange-traded instruments.

  • Swaps

Swaps are bilateral, over-the-counter contracts in which two parties exchange cash flows or commodity exposures based on predetermined terms. For commodity swaps, one party typically pays a fixed price while receiving a floating market price, enabling them to hedge against adverse price movements. Swaps offer considerable customization to meet the specific risk management requirements of large institutions and corporates. They allow parties to mitigate risk without altering their physical commodity positions. Although beneficial for tailoring exposures, swaps carry counterparty risk since they are not traded on regulated exchanges, making thorough credit assessment and collateral arrangements essential.

  • Commodity Indices

Commodity indices are baskets that track the performance of several commodities, offering investors a diversified snapshot of market trends. These indices are designed to reflect price movements across a sector—such as energy, agriculture, or metals—providing an aggregate measure for benchmarking and analysis. Investors can gain exposure to commodities indirectly through instruments that track these indices, which help in portfolio diversification and risk reduction. The index methodology typically involves weighting components by their market relevance, ensuring a balanced representation. This transparency in performance aids in the effective pricing and evaluation of market sentiment, while serving as a foundation for derivative products.

  • Commodity Exchange-Traded Funds (ETFs)

Commodity ETFs are investment funds traded on stock exchanges that aim to replicate the performance of a commodity or basket of commodities. These funds provide an accessible and liquid way for investors to gain exposure to commodity price movements without directly engaging in futures or physical commodity trades. They typically hold futures contracts or physical assets to mirror the price of the underlying commodity. Commodity ETFs offer ease of diversification, lower transaction costs, and real-time trading throughout the market session. Their transparent structure and regulatory oversight make them a popular instrument for both retail and institutional investors seeking risk-adjusted commodity exposure.

Instruments Available for Electronic Spot Exchanges:

  • Spot Contracts

Spot contracts are agreements for the immediate purchase or sale of commodities, typically settled within two working days. On electronic spot exchanges, buyers and sellers trade physical goods like grains, spices, and metals at real-time market prices. These contracts enable instant price discovery and quick settlement. Since the transaction is for immediate delivery, spot contracts reduce risks related to price fluctuations. Farmers, traders, and manufacturers use spot markets to access transparent pricing, avoid middlemen, and enhance market efficiency. The use of technology ensures secure transactions and better traceability of goods traded.

  • Forward Contracts (Non-transferable)

These are customized contracts between two parties to buy or sell a commodity at a future date at a predetermined price. On electronic spot exchanges, non-transferable forward contracts are tailored to meet the needs of small traders and farmers, ensuring delivery certainty and price protection. Though not tradable or transferable like futures, they help manage price volatility and provide income predictability. Warehousing and quality certification services often back these contracts. Such instruments build trust and ensure that both buyer and seller can fulfill obligations at mutually agreed terms, promoting stability in localized commodity ecosystems.

  • e-Warehouse Receipts (e-WRs)

e-Warehouse Receipts are electronic documents issued by certified warehouses against deposited goods. On electronic spot exchanges, e-WRs serve as tradeable instruments that represent ownership of the underlying commodity. Traders can sell these receipts instead of physically moving the goods, saving logistics costs. These receipts are backed by standardized grading, quality checks, and proper storage. They are crucial in enabling collateral-based financing from banks and improving liquidity for producers. e-WRs increase transparency, reduce fraud, and promote structured commodity trading, particularly in agricultural markets. Their use has revolutionized access to finance and trade efficiency for rural participants.

  • Auction-Based Instruments

Electronic spot exchanges often facilitate auction-based trading, especially for government procurement, public distribution, and large bulk sales. These instruments allow sellers to list commodities and buyers to bid competitively, ensuring price transparency and market-driven discovery. Auctions may be forward or reverse depending on who initiates the trade. They are widely used in agriculture for crops like pulses, oilseeds, and spices. This method benefits small producers by offering access to wider markets and competitive pricing while reducing dependency on local traders. The digital platform ensures speed, efficiency, and transparency throughout the bidding and settlement process.

Purpose of Commodity Markets

Commodity Markets are platforms where raw materials or primary products like gold, oil, wheat, and metals are bought, sold, and traded. These markets facilitate both physical and derivative trading, helping in price discovery, risk management, and investment. They support producers, traders, and investors by ensuring transparency, liquidity, and efficient resource allocation across domestic and global economies.

Purpose of Commodity Markets:

  • Price Discovery

Commodity markets play a vital role in determining fair and transparent prices of goods based on demand and supply dynamics. The continuous trading of commodities ensures that prices reflect real-time market conditions. This process benefits producers, traders, and consumers by offering a benchmark price for future transactions. Price discovery in organized commodity exchanges like MCX or NCDEX is driven by actual trades and market forces. It provides stakeholders a reliable reference for planning production, sales, budgeting, and strategic decisions in a competitive economic environment.

  • Risk Management (Hedging)

Commodity markets help businesses and investors manage price risk through hedging mechanisms, especially via futures contracts. Producers can lock in selling prices, while buyers can fix purchase prices, protecting them from adverse price fluctuations. This is crucial in volatile sectors like agriculture, energy, and metals. Hedging in commodity markets ensures stability and predictability in income and expenses. It allows stakeholders to focus on their core operations rather than worry about market risks, making it a fundamental purpose of commodities trading for participants exposed to uncertain market movements.

  • Investment Opportunities

Commodity markets provide avenues for portfolio diversification and wealth creation. Investors, including individuals and institutions, use commodity derivatives to invest in assets like gold, crude oil, silver, and agricultural produce. These investments act as a hedge against inflation and currency fluctuations. Commodities often perform differently from traditional assets like stocks and bonds, making them ideal for diversification. This function attracts both short-term speculators and long-term investors, adding depth and liquidity to the market, and reinforcing its role in a modern financial ecosystem.

  • Efficient Resource Allocation

By accurately reflecting supply-demand conditions and offering price transparency, commodity markets ensure efficient allocation of resources. Farmers and manufacturers can decide what and how much to produce based on prevailing market prices. Similarly, traders can allocate capital to high-demand sectors. This flow of information through market signals promotes optimal use of raw materials, labor, and capital. Commodity markets thus act as a coordinating mechanism, helping various economic sectors align production and consumption activities in response to price movements.

  • Liquidity Creation

Commodity markets contribute to liquidity by allowing easy entry and exit of participants through active trading. With continuous buying and selling of contracts, commodities become easily tradable assets. High liquidity ensures that traders can execute large transactions without significantly impacting prices. It also brings down the cost of trading and enhances market efficiency. Liquidity makes the market more attractive to investors, encouraging more participation and deepening the market, which in turn improves price discovery and risk management functions.

  • Encouraging Standardization and Quality Control

Organized commodity markets promote the standardization of contract specifications, including quality, quantity, packaging, and delivery terms. This ensures uniformity in trade and reduces disputes. Standardization boosts buyer confidence and enhances the credibility of the market. Additionally, it encourages producers to maintain and improve product quality to meet exchange standards. Regulatory bodies and exchanges set benchmarks that ensure commodities meet specific grades, creating a more reliable and efficient trading environment for all market participants.

  • Supporting Rural and Agricultural Economy

In countries like India, where a large portion of the population depends on agriculture, commodity markets offer farmers a transparent platform to sell their produce. These markets help them secure better prices, access timely payments, and connect with larger buyers. Through price signals, farmers can make informed decisions about cropping patterns and resource use. By reducing dependency on middlemen, commodity markets improve farmer incomes, reduce exploitation, and contribute to rural development and agricultural modernization.

  • Regulating Speculation

While speculation is often viewed with skepticism, regulated commodity markets channel speculative activities to improve market efficiency. Speculators provide liquidity by continuously entering and exiting trades, ensuring smooth price movements. Properly managed speculation adds depth to the market and helps in quicker price discovery. However, exchanges and regulators like SEBI monitor and control excessive speculation to maintain market stability. In this way, commodity markets balance speculation with investor protection, fostering a healthy and functioning market environment.

  • Facilitating International Trade

Commodity markets assist in the global integration of economies by enabling international trade in raw materials like crude oil, metals, and agricultural products. Standardized contracts and price benchmarks serve as global reference points for exporters and importers. These markets ensure that trade can happen smoothly, fairly, and with confidence, thanks to transparent pricing and efficient settlement systems. By linking domestic producers to global buyers, commodity markets enhance competitiveness, foreign exchange earnings, and overall economic growth.

Key difference between Fundamental Analysis and Technical Analysis

Fundamental Analysis

Fundamental analysis is a method of evaluating a security in an attempt to measure its intrinsic value, by examining related economic, financial, and other qualitative and quantitative factors. Fundamental analysts study anything that can affect the security’s value, from macroeconomic factors such as the state of the economy and industry conditions to microeconomic factors like the effectiveness of the company’s management. The goal is to produce a value that an investor can compare with the security’s current price, aiming to figure out what position to take with that security (underpriced = buy, overpriced = sell or short). This method of analysis is considered to be the opposite of technical analysis, which forecasts the direction of prices through the analysis of historical market data, such as price and volume.

Fundamental Analysis Features:

  • Holistic Approach:

Fundamental analysis takes a comprehensive approach, considering financial, economic, industry, and company-specific factors. It looks at the broader picture and drills down to the specifics of individual companies.

  • Financial Statement Analysis:

A core component involves analyzing a company’s financial statements – balance sheet, income statement, and cash flow statement – to assess its financial health and operational efficiency.

  • Valuation Metrics:

It involves the use of various valuation metrics and ratios such as Price-to-Earnings (P/E) ratio, Price-to-Book (P/B) ratio, Dividend Yield, Return on Equity (ROE), and many others to determine whether a security is undervalued or overvalued compared to its current market price.

  • Economic Indicators:

Fundamental analysis also looks at economic indicators such as GDP growth rates, unemployment rates, inflation rates, and interest rates, as these can have a significant impact on the market’s overall direction and on specific sectors.

  • Sector and Industry Analysis:

Besides looking at individual companies, fundamental analysis also involves evaluating the health and prospects of the sector or industry in which the company operates. This includes considering the competitive landscape, regulatory environment, and any sector-specific risks.

  • Long-Term Orientation:

Fundamental analysis is typically more concerned with long-term investment opportunities. The goal is to identify companies that are undervalued by the market but have the potential for growth over time.

  • Qualitative Factors:

It’s not all about the numbers. Fundamental analysis also considers qualitative factors such as company management, brand strength, patents, and proprietary technology, which can influence a company’s long-term success.

  • Risk Assessment:

Fundamental analysis involves assessing the various risks that could impact the company’s ability to generate future cash flows and affect its overall valuation.

  • Macro and Micro Economic Factors:

It encompasses both macroeconomic factors (like economic cycles and monetary policy) and microeconomic factors (such as company-specific news and events), providing a thorough basis for making investment decisions.

  • Investment Decision Making:

The ultimate goal of fundamental analysis is to produce a value that investors can compare with the security’s current price, with the aim of figuring out what to buy/sell and when. This analysis forms the foundation for making informed investment decisions.

Technical Analysis

Technical analysis is a trading discipline employed to evaluate investments and identify trading opportunities by analyzing statistical trends gathered from trading activity, such as price movement and volume. Unlike fundamental analysis, which attempts to evaluate a security’s value based on business results such as sales and earnings, technical analysis focuses on the study of price and volume. Technical analysts believe past trading activity and price changes of a security are better indicators of the security’s likely future price movements than the intrinsic value. They use charts and other tools to identify patterns that can suggest future activity. Technical analysis can be used on any security with historical trading data. This includes stocks, futures, commodities, fixed-income, currencies, and other securities.

Technical Analysis Features:

  • Market Price Focus:

Technical analysis primarily focuses on the analysis of price movements and volume rather than the intrinsic value of securities. The core assumption is that all known information is already reflected in prices.

  • Charts and Graphs:

It heavily relies on charts and graphs to visually represent price movements over time. These graphical representations help traders identify patterns and trends that can suggest future activity.

  • Trends and Patterns:

Technical analysts believe that prices move in trends and that history tends to repeat itself. Identifying these trends and patterns forms the basis of making trading decisions.

  • Technical Indicators:

Various technical indicators and mathematical calculations are used, such as moving averages, Relative Strength Index (RSI), MACD (Moving Average Convergence Divergence), and Bollinger Bands, to predict future price movements.

  • Price Movements are not Random:

Technical analysis operates under the assumption that price movements are not random and that they follow trends that can be identified and exploited.

  • Supply and Demand:

It assesses the balance of supply and demand by analyzing buying and selling activity, under the belief that changes in supply and demand can lead to shifts in price trends.

  • Short-Term Trading Focus:

While it can be used for long-term analysis, technical analysis is often associated with short-term trading and is popular among day traders and swing traders.

  • Psychological and Market Sentiment:

Technical analysis also considers trader psychology and market sentiment, which can be inferred from price movements and volume changes.

  • SelfFulfilling Prophecy:

Some argue that technical analysis can work because it becomes a self-fulfilling prophecy; when enough traders believe in a pattern or indicator and act accordingly, their collective actions can move the market.

  • Flexibility Across Markets:

Technical analysis can be applied across different markets (stocks, forex, commodities) and instruments, making it a versatile tool for traders.

  • Independence from Financials:

Unlike fundamental analysis, which delves into financial statements and economic indicators, technical analysis can be applied without regard to the financial health of the market or its components.

  • Risk Management:

Technical analysis includes tools for risk management, such as stop-loss orders and position sizing, based on technical indicators and price levels.

Key differences between Fundamental Analysis and Technical Analysis:

Basis of Comparison Fundamental Analysis Technical Analysis
Objective Evaluate intrinsic value Predict price trends
Approach Qualitative & quantitative Statistical & chart-based
Data Used Economic, financial, company Price, volume, charts
Time Frame Long-term investment Short-term trading
Focus Value of asset Price movement, patterns
Tools Financial statements, ratios Charts, indicators
Key Factors Earnings, GDP, industry Price trends, volume
Philosophy Buy and hold Timing the market
Analysis Type Bottom-up or top-down Market trends
Market Sentiment Less considered Highly considered
Skill Set Economic, financial analysis Statistical, pattern recognition
Predictive Value Intrinsic value estimation Price movement anticipation

Fundamental Analysis, Components, Types, Impact, Limitations

Fundamental analysis is a cornerstone of investing. It’s a method used to determine the intrinsic value of a security, with the aim of assessing its actual worth based on various economic, financial, and other qualitative and quantitative factors.

Understanding Fundamental Analysis

At its core, fundamental analysis seeks to ascertain the true value of an investment, stripping away the noise and fluctuations of market prices to focus on underlying factors that influence a company’s future prospects. This involves a deep dive into financial statements, market position, industry health, economic indicators, and even geopolitical events. By evaluating all these aspects, investors aim to make predictions about future price movements and investment potential.

Key Components of Fundamental Analysis

  1. Economic Analysis

The process begins with a macroeconomic analysis, examining overall economic indicators like GDP growth rates, unemployment levels, inflation, interest rates, and monetary policies. These factors offer insights into the economic environment in which businesses operate, affecting consumer spending, borrowing costs, and investment returns.

  1. Industry Analysis

The next step involves analyzing the specific industry in which the company operates. This includes understanding the industry’s growth potential, competitive landscape, regulatory environment, and technological advancements. The goal is to identify industries with high growth prospects and understand where a company stands within its industry.

  1. Company Analysis

This is the crux of fundamental analysis, focusing on a thorough examination of the company itself. It involves:

  • Financial Statement Analysis: Reviewing the company’s balance sheet, income statement, and cash flow statement to assess its financial health, profitability, liquidity, and operational efficiency.
  • Ratio Analysis: Using key financial ratios like the price-to-earnings (P/E) ratio, debt-to-equity ratio, return on equity (ROE), and others to compare a company’s performance against its peers and industry averages.
  • Management and Governance: Evaluating the company’s leadership, strategic direction, corporate governance practices, and any competitive advantages.
  1. Valuation

Finally, various valuation models are applied to estimate the intrinsic value of the security. Common models include the Discounted Cash Flow (DCF) analysis, Dividend Discount Model (DDM), and relative valuation techniques like comparable company analysis. The goal is to determine a fair value for the security, which investors can compare against the current market price to make buy, hold, or sell decisions.

Types of Fundamental Analysis:

  1. Top-Down Analysis

Top-down analysis starts with the big picture and works its way down to individual stocks. It begins by analyzing global economic indicators and trends to identify which economies are currently strong or showing signs of growth. From there, the analysis narrows down to sectors and industries within those economies that are expected to outperform. The final step in a top-down analysis is to identify companies within those sectors that are believed to have the best growth prospects. This approach is useful for investors looking to allocate their investments across regions and sectors strategically.

Steps in Top-Down Analysis:

  1. Global Economy Analysis: Evaluates global economic conditions, including growth rates, inflation, interest rates, and geopolitical factors.
  2. Country Analysis: Focuses on economic conditions, monetary policies, and political stability within specific countries.
  3. Sector/Industry Analysis: Identifies sectors and industries expected to benefit from current economic conditions.
  4. Company Analysis: Selects companies within those sectors that have strong fundamentals.

2. Bottom-Up Analysis

In contrast to the top-down approach, bottom-up analysis ignores macroeconomic factors and focuses solely on the analysis of individual companies. Analysts using this method look for companies with strong fundamentals regardless of their industry or the overall economy. This approach involves a deep dive into a company’s financial statements, management effectiveness, product offerings, and market position to determine its intrinsic value. Investors who use the bottom-up approach believe that good companies can outperform, even in struggling industries or economies.

Steps in Bottom-Up Analysis:

  1. Company Financial Health: Examination of financial statements, revenue, profit margins, return on equity, and other financial ratios.
  2. Management Quality: Assessment of the company’s leadership effectiveness and corporate governance practices.
  3. Competitive Position: Analysis of the company’s market share, competitive advantages, and industry position.
  4. Growth Potential: Evaluation of the company’s future growth prospects in terms of revenue, earnings, and expansion opportunities.

3. Hybrid Approach

Some investors use a hybrid approach that combines elements of both top-down and bottom-up analysis. This method allows investors to consider macroeconomic and sectoral trends while also focusing on the fundamentals and performance of individual companies. By integrating both approaches, investors can make more informed decisions by balancing broader economic perspectives with detailed company analysis.

Top-down Fundamental vs. Bottom-up Fundamental analysis

Basis of Comparison Top-Down Analysis Bottom-Up Analysis
Starting Point Global economy Individual companies
Focus Macro factors Company fundamentals
Scope Broad Narrow
Investment Selection Sector before stock Stock first
Research Emphasis Economic indicators Financial statements
Market View General to specific Specific to general
Decision Criteria Economic trends Company performance
Ideal Market Condition Volatile markets Stable or growing markets
Suitability Strategic asset allocation Picking undervalued stocks
Time Horizon Long-term Varies
Risk Diversification effect Focus on single stocks
Adaptability Global changes Specific opportunities

Impact of Fundamental Analysis:

  • Investment Decision-Making

Fundamental analysis serves as a vital tool for investors aiming to make long-term investment decisions. By focusing on intrinsic value, investors can identify undervalued stocks that offer growth potential or overvalued stocks that pose a risk. This method supports a buy-and-hold strategy, as the analysis is predicated on the belief that the market will eventually recognize and correct mispricings.

  • Risk Management

Understanding a company’s fundamentals helps investors assess the risk associated with an investment. A strong balance sheet, consistent earnings growth, and a solid market position can indicate a lower risk profile, whereas high debt levels, erratic earnings, and a weak competitive stance might signal higher risk.

  • Portfolio Diversification

Fundamental analysis aids in constructing a diversified investment portfolio. By analyzing a broad range of companies across different industries and sectors, investors can select securities that align with their risk tolerance and investment objectives, thereby spreading risk and enhancing potential returns.

Limitations of Fundamental Analysis:

  1. Time-Consuming Process

Fundamental analysis involves a deep dive into financial statements, economic indicators, company management, and market conditions. This extensive research requires significant time and effort, which may not be feasible for every investor, especially those who are not investing full-time.

  1. Impact of External Factors

While fundamental analysis focuses on a company’s intrinsic value, it can sometimes overlook the potential impact of external events or market sentiments. Political events, economic downturns, sudden market trends, or global crises can affect stock prices independently of the company’s fundamentals.

  1. Subjectivity in Analysis

Interpreting financial statements and predicting future performance involve a degree of subjectivity. Different analysts may have different opinions on the same set of data, leading to varied conclusions about a stock’s intrinsic value. This subjectivity can make fundamental analysis more of an art than a strict science.

  1. Historical Data

Fundamental analysis often relies on historical data to predict future performance. However, past performance is not always a reliable indicator of future success. Changes in industry dynamics, competition, or management can significantly alter a company’s growth trajectory.

  1. Market Efficiency

The Efficient Market Hypothesis (EMH) suggests that at any given time, stock prices fully reflect all available information. If the markets are indeed efficient, trying to find undervalued stocks through fundamental analysis might be less effective since all information is already priced in.

  1. Ignoring Technical Factors

Fundamental analysis primarily focuses on a company’s value and does not take into account the stock’s price movements or market trends, which are central to technical analysis. Sometimes, these technical factors can offer trading opportunities that fundamental analysis might miss.

  1. Lagging Indicator

By the time a fundamental analysis identifies a potentially undervalued stock, the market may have already begun adjusting the price to reflect this. In rapidly moving markets, this lag can mean missing out on initial gains.

  1. Industry and Sector Blind Spots

For investors focusing exclusively on bottom-up fundamental analysis, there’s a risk of missing broader industry or sector issues that could affect a company’s performance. This approach can overlook macroeconomic factors that impact investment performance across the board.

  1. Quantitative Focus

While fundamental analysis involves qualitative factors like management quality, much of the focus is on quantitative data from financial statements. Intangible assets, brand value, or industry trends might be undervalued in this analysis framework.

  1. Rapid Changes in Business Models

In today’s fast-paced economic environment, new technologies and business models can quickly disrupt industries. Fundamental analysis might not fully account for these rapid changes, especially for industries experiencing significant innovation.

error: Content is protected !!