Decision Tree may be understood as the logical tree, is a range of conditions (premises) and actions (conclusions), which are depicted as nodes and the branches of the tree which link the premises with conclusions. It is a decision support tool, having a tree-like representation of decisions and the consequences thereof. It uses ‘AND’ and ‘OR’ operators, to recreate the structure of if-then rules.
A decision tree is helpful in reaching the ideal decision for intricate processes, especially when the decision problems are interconnected and chronological in nature.
A decision tree does not constitute a decision but assists in making one, by graphically representing the material information related to the given problem, in the form of a tree. It diagrammatically depicts various courses of action, likely outcomes, states of nature, etc. as nodes, branches or sub-branches of a horizontal tree.
Nodes
There are two types of Nodes:
- Decision Node: Represented as square, wherein different courses of action arise from decision node in main branches.
- Chance Node: Symbolised as a circle, at the terminal point of decision node, the chance node is present, where they emerge as sub-branches. These depict probabilities and outcomes.
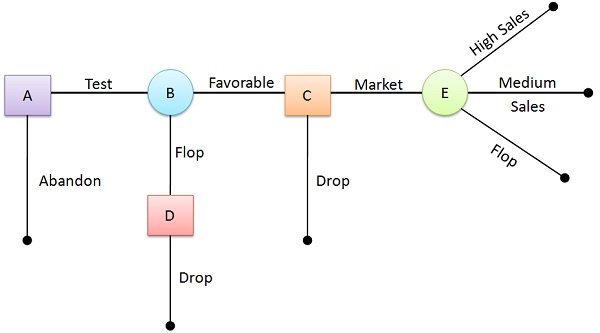
For instance: Think of a situation where a firm introduces a new product. The decision tree presented below gives a clear idea of managerial problems.

- Key A is a decision node, wherein the decision is taken, i.e. to test the product or drop the same.
- Key B is an outcome node, which shows all possible outcomes, that can be taken. As per the given situation, there are only two outcomes, i.e. favorable or not.
- Key C is again a decision node, that describes the market test is positive, so the firm’s management will decide whether to go further with complete marketing or drop the product.
- Key D is one more decision node, but does not shows any choice, which depicts that if the market test is unfavorable then the decision is to drop the product.
- Key E is again an outcome node.
The decision tree can be applied to various areas, where decisions are pending such as make or buy decision, investment decision, marketing strategy, the introduction of a new project. The decision maker will go for the alternative that increases the anticipated profit or the one which reduces the overall expected cost at each decision point.
Types of Decision Tree

In a single stage decision tree, the decision maker can find only one solution, which is the best course of action, on the basis of the information gathered. On the other hand, multi-stage decision tree involves a series of the decision to be taken.
Decision Tree Analysis
The Decision Tree Analysis is a schematic representation of several decisions followed by different chances of the occurrence. Simply, a tree-shaped graphical representation of decisions related to the investments and the chance points that help to investigate the possible outcomes is called as a decision tree analysis.
The decision tree shows Decision Points, represented by squares, are the alternative actions along with the investment outlays, that can be undertaken for the experimentation. These decisions are followed by the chance points, represented by circles, are the uncertain points, where the outcomes are dependent on the chance process. Thus, the probability of occurrence is assigned to each chance point.

Once the decision tree is described precisely, and the data about outcomes along with their probabilities is gathered, the decision alternatives can be evaluated as follows:
- Start from the extreme right-hand end of the tree and start calculating NPV for each chance points as you proceed leftward.
- Once the NPVs are calculated for each chance point, evaluate the alternatives at the final stage decision points in terms of their NPV.
- Select the alternative which has the highest NPV and cut the branch of inferior decision alternative. Assign value to each decision point equivalent to the NPV of the alternative selected.
- Again, repeat the process, proceed leftward, recalculate NPV for each chance point, select the decision alternative which has the highest NPV value and then cut the branch of the inferior decision alternative. Assign the value to each point equivalent to the NPV of selected alternative and repeat this process again and again until a final decision point is reached.
Thus, decision tree analysis helps the decision maker to take all the possible outcomes into the consideration before reaching a final investment decision.
A decision tree is a decision support tool that uses a tree-like model of decisions and their possible consequences, including chance event outcomes, resource costs, and utility. It is one way to display an algorithm that only contains conditional control statements.
Decision trees are commonly used in operations research, specifically in decision analysis, to help identify a strategy most likely to reach a goal, but are also a popular tool in machine learning.
2 thoughts on “Decision Tree Analysis”