Monopolistic Competition

Monopolistic competition characterizes an industry in which many firms offer products or services that are similar, but not perfect substitutes. Barriers to entry and exit in a monopolistic competitive industry are low, and the decisions of any one firm do not directly affect those of its competitors. Monopolistic competition is closely related to the business strategy of brand differentiation.

Monopolistic competition is a middle ground between monopoly and perfect competition (a purely theoretical state), and combines elements of each. All firms in monopolistic competition have the same, relatively low degree of market power; they are all price makers. In the long run, demand is highly elastic, meaning that it is sensitive to price changes. In the short run, economic profit is positive, but it approaches zero in the long run. Firms in monopolistic competition tend to advertise heavily.

Monopolistic competition is a form of competition that characterizes a number of industries that are familiar to consumers in their day-to-day lives. Examples include restaurants, hair salons, clothing, and consumer electronics.

Features of monopolistic competition:

The main features of monopolistic competition are as under:

  • Large Number of Buyers and Sellers

There are large number of firms but not as large as under perfect competition.

That means each firm can control its price-output policy to some extent. It is assumed that any price-output policy of a firm will not get reaction from other firms that means each firm follows the independent price policy.

If a firm reduces its price, the gains in sales will be slightly spread over many of its rivals so that the extent to which each of the rival firms suffers will be very small. Thus these rival firms will have no reason to react.

  • Free Entry and Exit of Firms

Like perfect competition, under monopolistic competition also, the firms can enter or exit freely. The firms will enter when the existing firms are making super-normal profits. With the entry of new firms, the supply would increase which would reduce the price and hence the existing firms will be left only with normal profits. Similarly, if the existing firms are sustaining losses, some of the marginal firms will exit. It will reduce the supply due to which price would rise and the existing firms will be left only with normal profit.

  • Product Differentiation

Another feature of the monopolistic competition is the product differentiation. Product differentiation refers to a situation when the buyers of the product differentiate the product with other. Basically, the products of different firms are not altogether different; they are slightly different from others. Although each firm producing differentiated product has the monopoly of its own product, yet he has to face the competition. This product differentiation may be real or imaginary. Real differences are like design, material used, skill etc. whereas imaginary differences are through advertising, trade mark and so on.

  • Selling Cost

Another feature of the monopolistic competition is that every firm tries to promote its product by different types of expenditures. Advertisement is the most important constituent of the selling cost which affects demand as well as cost of the product. The main purpose of the monopolist is to earn maximum profits; therefore, he adjusts this type of expenditure accordingly.

  • Lack of Perfect Knowledge

The buyers and sellers do not have perfect knowledge of the market. There are innumerable products each being a close substitute of the other. The buyers do not know about all these products, their qualities and prices.

Therefore, so many buyers purchase a product out of a few varieties which are offered for sale near the home. Sometimes a buyer knows about a particular commodity where it is available at low price. But he is unable to go there due to lack of time or he is too lethargic to go or he is unable to find proper conveyance. Likewise, the seller does not know the exact preference of buyers and is, therefore, unable to get advantage out of the situation.

  • Less Mobility

Under monopolistic competition both the factors of production as well as goods and services are not perfectly mobile.

  • More Elastic Demand

Under monopolistic competition, demand curve is more elastic. In order to sell more, the firms must reduce its price.

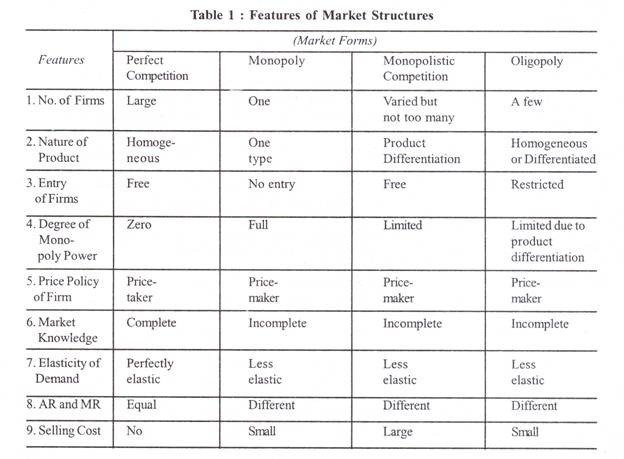
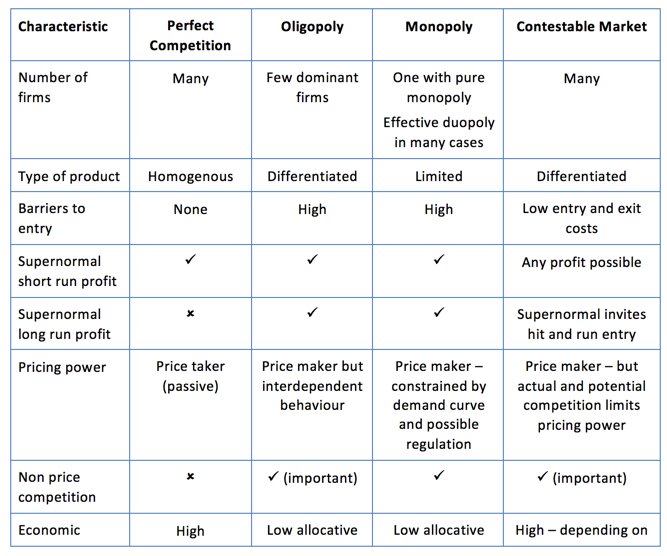
Characteristics of Monopolistic Competition:

  • Large Number of Buyers and Sellers

Monopolistic competition involves many buyers and sellers operating in the market. However, unlike perfect competition, each firm holds a relatively small market share and operates independently. No single firm has enough influence to affect overall market supply or pricing significantly. The presence of numerous sellers ensures that customers have multiple choices. Each firm faces competition from others offering close substitutes, although products are not identical. This structure encourages innovation and marketing strategies to capture consumer attention and retain a loyal customer base.

  • Product Differentiation

One of the most defining features of monopolistic competition is product differentiation. Firms sell products that are similar but not identical, which gives consumers the perception of uniqueness. Differentiation can be based on quality, packaging, features, branding, style, or customer service. This perceived uniqueness allows firms to charge slightly higher prices than competitors. For example, different brands of toothpaste or clothing are essentially the same but marketed differently. Product differentiation creates brand loyalty and gives firms a degree of pricing power in the market.

  • Freedom of Entry and Exit

Monopolistic competition allows free entry and exit of firms in the long run. New firms can enter the market when existing firms are earning supernormal profits, increasing competition and reducing profit margins over time. Conversely, firms that incur losses can leave without major obstacles. This flexibility ensures that no single firm dominates the market permanently. As firms enter or exit, the number of sellers stabilizes, and long-run equilibrium is achieved where each firm earns normal profit. This characteristic promotes healthy competition and market dynamism.

  • Some Degree of Price Control

Firms in monopolistic competition have some pricing power due to product differentiation. Unlike perfect competition, where firms are price takers, here each firm faces a downward-sloping demand curve, allowing them to set prices independently within a certain range. However, the presence of close substitutes limits this power. If a firm charges significantly higher prices, consumers may shift to competing products. Thus, while firms can influence prices to a limited extent, their pricing decisions are closely tied to how well they differentiate their product.

  • Non-Price Competition

In monopolistic competition, firms often engage in non-price competition to attract and retain customers. Since raising prices can drive customers to competitors, businesses focus on marketing tactics such as advertising, sales promotions, improved packaging, customer service, or introducing new features. These strategies build brand identity and customer loyalty without directly altering the price. For instance, mobile phone brands emphasize camera quality or screen resolution over price cuts. Non-price competition is vital in this market structure to maintain customer base and market share.

  • Independent Decision Making

Each firm in monopolistic competition makes its own independent business decisions regarding pricing, output, marketing, and product design. There is no formal coordination among firms as seen in oligopolies. The strategic decisions are based on individual cost structures, market analysis, and competitive positioning. Although firms are aware of competitors’ actions, they don’t engage in collective behavior like price fixing. This autonomy allows firms to experiment, innovate, and adopt different business strategies tailored to their product and target customers.

  • Elastic Demand Curve

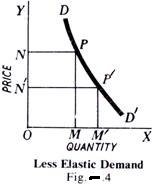
A firm in monopolistic competition faces a highly elastic but not perfectly elastic demand curve. Because there are many close substitutes available, a small increase in price may lead to a significant decrease in quantity demanded. However, due to product differentiation, the firm retains some customers who are loyal to the brand or specific features. This elasticity reflects the balance between customer preference and market competition. Firms must therefore carefully assess the price sensitivity of their consumers to maintain sales volume and revenue.

  • High Selling and Promotional Costs

Advertising, promotional campaigns, and other selling efforts are prominent in monopolistic competition. Since products are differentiated, firms spend heavily on selling costs to inform, persuade, and remind customers of their product’s uniqueness. These costs are necessary to sustain brand loyalty and attract new buyers in a highly competitive environment. Companies may invest in social media, endorsements, packaging innovations, or after-sale services. Though these expenses don’t directly enhance production, they significantly impact consumer perception and play a central role in business success.

Limitations of the model of monopolistic competition:

  • Inefficiency in Resource Allocation

Monopolistic competition often leads to inefficient allocation of resources. Firms do not produce at the minimum point of their average cost curve, unlike in perfect competition. Since each firm has some market power due to product differentiation, they charge a higher price than marginal cost, causing underproduction and inefficiency. This misallocation leads to deadweight loss and limits overall welfare. It implies that the economy does not make the best use of its resources, resulting in reduced productivity and consumer surplus.
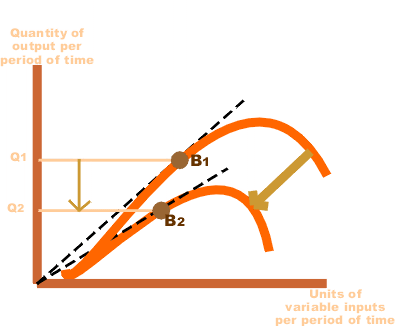
  • Excess Capacity

Firms in monopolistic competition often operate with excess capacity, meaning they do not produce at full potential or minimum average cost. Due to downward-sloping demand curves and market saturation, firms can’t maximize their scale. This inefficiency results from the competitive pressure to differentiate and maintain uniqueness. Firms intentionally avoid producing large quantities to preserve price control. This leads to wasted resources, higher unit costs, and underutilization of infrastructure and labor, which ultimately reflects a less-than-optimal economic output for the industry.

  • Higher Prices for Consumers

Due to product differentiation, firms in monopolistic competition have some price-setting power, leading to higher prices than in perfect competition. Consumers end up paying more for essentially similar products just because of perceived differences. This pricing strategy reduces consumer welfare, especially when the higher price is not justified by proportional quality improvements. In the long run, although supernormal profits are eroded by new entrants, prices still remain above marginal cost, resulting in persistent market inefficiency and higher expenditure for consumers.

  • Wastage on Advertising and Selling Costs

Firms in monopolistic competition incur excessive costs on advertising, branding, packaging, and other selling expenses to differentiate their products. These selling costs are not directly related to improving product quality or quantity but aim to manipulate consumer perception. This results in a significant portion of resources being used for persuasive rather than productive purposes. From a societal point of view, this is considered wasteful, as these expenditures could have been used for more value-adding activities or price reductions.

  • Misleading Product Differentiation

Product differentiation in monopolistic competition is often more artificial than real. Firms use branding, slogans, and packaging to create a false sense of uniqueness. This may lead consumers to believe one product is significantly better than another, even if the actual difference is minimal. Such strategies may manipulate customer decisions rather than improve the product itself. It can also promote consumerism and irrational buying behavior, where choices are driven more by image than by real value or utility.

  • Lack of Long-Term Innovation

Firms in monopolistic competition may lack incentives for long-term innovation. Since the market is crowded and profits are normal in the long run, firms often focus on short-term promotional gains rather than investing in research and development. Innovation may be limited to superficial changes like packaging or color variants. In contrast to monopolies that can invest in technological advancement due to sustained profits, monopolistic firms are under constant pressure and may avoid risky, long-term improvements that require substantial capital.

  • Unstable Market Structure

The ease of entry and exit in monopolistic competition creates a dynamic yet unstable market structure. Continuous entry of new firms erodes existing profits, while poorly performing firms frequently exit. This causes fluctuating market shares, inconsistent pricing strategies, and unpredictable consumer loyalty. The lack of stability makes it difficult for firms to plan for long-term investments or build lasting competitive advantages. This volatility can also confuse consumers due to rapidly changing product varieties and brands.

  • Duplication of Resources

Due to multiple firms offering similar yet differentiated products, there is often a duplication of efforts and resources. Each firm invests separately in advertising, packaging, distribution, and retail space for products that fulfill nearly the same function. This redundancy leads to higher production and operating costs industry-wide. It also creates environmental and logistical inefficiencies, such as excess packaging waste or transport emissions, which could be reduced in a more centralized or coordinated market structure like perfect competition or monopoly.

Marketing Research, Types, Process Tools and Techniques

Marketing Research is the systematic process of gathering, analyzing, and interpreting information about a market, target audience, competition, or industry trends. It helps businesses identify opportunities, assess consumer needs, preferences, and behaviors, and evaluate the effectiveness of marketing strategies. Marketing research can be classified into primary research (collecting new data through surveys, interviews, or experiments) and secondary research (analyzing existing data like reports or publications). It provides critical insights that guide decision-making, enhance customer satisfaction, and improve product or service offerings. Effective marketing research ensures that organizations remain competitive and responsive in dynamic market environments.

Features of Marketing Research:

1. Systematic Process

Marketing research follows a structured and methodical approach. It begins with identifying the problem or opportunity, followed by designing the research plan, data collection, analysis, and interpretation. This systematic process ensures accuracy and reliability in findings, which are critical for informed decision-making.

  • Example: A company launching a new product systematically conducts surveys and focus groups to evaluate consumer demand.

2. Objective-Oriented

The primary goal of marketing research is to provide solutions to specific marketing problems or to uncover opportunities. It focuses on collecting relevant data and generating actionable insights to achieve predefined objectives. By remaining goal-focused, marketing research helps avoid irrelevant or excessive data collection.

  • Example: A company may conduct research specifically to understand why sales of a product are declining.

3. Data-Driven

Marketing research relies on data, whether qualitative (opinions, emotions, or motivations) or quantitative (numbers, statistics, or trends). The quality of the research is directly tied to the accuracy, relevance, and timeliness of the data collected.

  • Example: A retailer analyzing customer purchase patterns uses sales data to design targeted promotions.

4. Analytical in Nature

Marketing research emphasizes rigorous analysis of collected data to derive meaningful insights. Various analytical tools and statistical techniques are used to interpret the data, identify trends, and make forecasts. This ensures that decisions are not based on guesswork but on factual evidence.

  • Example: A software company uses predictive analytics to estimate customer lifetime value based on historical behavior.

5. Continuous and Adaptive

Marketing research is not a one-time activity but an ongoing process. Markets are dynamic, with changing consumer behaviors, preferences, and competitive forces. Businesses must adapt their research efforts to stay relevant and updated with current trends.

  • Example: Social media platforms conduct regular research to understand user preferences and develop new features accordingly.

6. Problem-Solving Orientation

Marketing research aims to solve real-world problems by identifying issues and suggesting practical solutions. It provides actionable recommendations to enhance marketing strategies, product development, or customer engagement.

  • Example: Research findings may indicate the need for better customer service training to improve satisfaction levels.

Types of Marketing Research:

1. Exploratory Research

This type of research is conducted when the problem is not clearly defined, and the objective is to explore new ideas or insights. It is qualitative in nature and helps identify potential issues, opportunities, or solutions. Techniques like focus groups, in-depth interviews, and open-ended surveys are commonly used.

  • Example: A company exploring the viability of a new product concept by interviewing a small group of target customers.

2. Descriptive Research

Descriptive research aims to describe the characteristics of a specific market or consumer group. It is often quantitative and provides information about consumer demographics, behaviors, and preferences. Surveys, observational studies, and data analysis are typical methods used.

  • Example: A retailer conducting a survey to understand the purchasing habits of millennials.

3. Causal Research

Also known as experimental research, causal research is conducted to identify cause-and-effect relationships between variables. It tests hypotheses to determine how changes in one variable (e.g., price) impact another (e.g., sales).

  • Example: A business running A/B tests on two different ad campaigns to measure their impact on customer engagement.

4. Qualitative Research

This research focuses on understanding consumer emotions, motivations, and behaviors through non-numerical data. It uses methods like focus groups, interviews, and ethnographic studies to gather in-depth insights.

  • Example: A luxury brand conducting interviews to understand how customers perceive exclusivity.

5. Quantitative Research

Quantitative research collects and analyzes numerical data to identify trends, patterns, and relationships. It relies on large sample sizes and uses techniques like surveys, statistical analysis, and structured questionnaires.

  • Example: A telecom company analyzing customer satisfaction scores through large-scale surveys.

6. Primary Research

Primary research involves collecting original data directly from respondents. It provides specific insights tailored to the research objectives and is conducted through surveys, experiments, and direct observations.

  • Example: A startup conducting an online poll to gauge interest in its new app.

7. Secondary Research

This type of research involves analyzing existing data from sources like reports, studies, industry publications, and government statistics. It is cost-effective and useful for understanding broader trends.

  • Example: A business using market reports to understand industry growth rates.

8. Product Research

Product research focuses on understanding consumer preferences and feedback related to a product’s features, packaging, or usability. It helps in product development and enhancement.

  • Example: A beverage company testing different flavors with a focus group.

9. Market Segmentation Research

This research identifies distinct consumer segments within a broader market based on demographics, behaviors, or preferences. It helps businesses target the right audience effectively.

  • Example: A fashion retailer segmenting its market into groups based on age and lifestyle.

10. Competitive Analysis Research

This type examines competitors’ strategies, strengths, and weaknesses. It provides insights into the competitive landscape and helps businesses differentiate themselves.

  • Example: A software company analyzing its competitors’ pricing and features.

Process of Marketing Research:

1. Identifying the Problem or Opportunity

The first step in the marketing research process is clearly defining the problem or identifying the opportunity. This step is critical, as it sets the foundation for the entire research process. A poorly defined problem may lead to irrelevant or misleading results. Businesses need to determine what they want to achieve, whether it is understanding declining sales, evaluating a new product’s potential, or exploring customer preferences. For instance, a company may want to know why customer satisfaction levels have decreased over the past quarter.

2. Developing the Research Plan

Once the problem is identified, the next step is to design a comprehensive research plan. This involves selecting the type of research (exploratory, descriptive, or causal) and determining the research approach (qualitative, quantitative, or a mix of both). Additionally, researchers decide on the methods for data collection, such as surveys, interviews, focus groups, or experiments. The plan should also outline the sampling method, sample size, and research budget. A well-thought-out research plan ensures that the process is efficient and cost-effective.

3. Collecting Data

Data collection is a crucial step that involves gathering information from primary or secondary sources. Primary data is collected firsthand through methods like questionnaires, interviews, and observations. Secondary data is obtained from existing sources such as market reports, government publications, and industry databases. The choice of data collection method depends on the objectives and available resources. For instance, if a business wants real-time customer feedback, it may use online surveys or social media polls.

4. Analyzing the Data

After data collection, the next step is to organize, analyze, and interpret the information to derive meaningful insights. Statistical tools, software, and techniques like regression analysis, correlation, and data visualization are often employed. This step involves identifying patterns, trends, and relationships within the data. For example, analysis may reveal that customers prefer specific product features or that price sensitivity is affecting sales.

5. Presenting the Findings

Once the data is analyzed, the results need to be compiled into a clear and concise report. The report typically includes an executive summary, research objectives, methodology, key findings, and actionable recommendations. Visual aids like graphs, charts, and tables are often used to make the findings easier to understand. This presentation helps decision-makers grasp the key insights and make informed choices based on the research.

6. Taking Action and Monitoring Results

The final step in the marketing research process is to implement the recommendations and monitor the outcomes. Businesses use the insights gained to develop strategies, improve products, or enhance customer experiences. Continuous monitoring ensures that the implemented actions are achieving the desired results and allows for adjustments if necessary. For instance, if a marketing campaign based on research insights shows positive results, it validates the research process.

Tools and Techniques of Marketing Research:

1. Data Collection Tools

a. Surveys and Questionnaires

Surveys are one of the most popular tools for collecting primary data. They involve structured questions designed to gather quantitative or qualitative insights.

  • Example: Online surveys using platforms like Google Forms, SurveyMonkey, or Qualtrics.
  • Benefit: Cost-effective and scalable for large audiences.

b. Interviews

Interviews provide in-depth insights by engaging participants in detailed discussions. They can be conducted face-to-face, via phone, or online.

  • Example: One-on-one interviews with key customers to explore their motivations.
  • Benefit: Allows for probing and clarifying responses.

c. Focus Groups

Focus groups involve moderated discussions with a small group of participants to gather opinions and ideas.

  • Example: A retailer organizing focus groups to test new store layouts.
  • Benefit: Reveals group dynamics and diverse perspectives.

d. Observation

Observation involves monitoring consumer behavior in real-world settings without direct interaction.

  • Example: Watching how shoppers navigate a store.
  • Benefit: Captures actual behavior rather than self-reported data.

e. Experiments

Experiments test specific variables to determine cause-and-effect relationships.

  • Example: A/B testing two versions of a website landing page.
  • Benefit: Provides reliable data for decision-making.

2. Data Analysis Tools

a. Statistical Software

Statistical tools like SPSS, SAS, and R help analyze large datasets and uncover trends, correlations, and patterns.

  • Example: A company using SPSS to analyze survey results.
  • Benefit: Ensures accurate and sophisticated data analysis.

b. Data Visualization Tools

Tools like Tableau, Power BI, and Excel create visual representations of data, such as charts and graphs.

  • Example: A marketer using Tableau to create dashboards for campaign performance.
  • Benefit: Makes complex data easy to understand and interpret.

c. Predictive Analytics

Predictive tools use algorithms and machine learning to forecast future trends and behaviors.

  • Example: An e-commerce platform predicting customer purchase likelihood.
  • Benefit: Enables proactive decision-making.

3. Online Tools

a. Social Media Analytics

Platforms like Hootsuite and Brandwatch analyze consumer sentiment and behavior on social media.

  • Example: Tracking brand mentions and hashtags to measure campaign effectiveness.
  • Benefit: Provides real-time insights into public opinion.

b. Web Analytics

Google Analytics and similar tools track website traffic, user behavior, and conversion rates.

  • Example: Monitoring the effectiveness of an ad campaign through website traffic spikes.
  • Benefit: Helps optimize digital marketing strategies.

c. CRM Systems

Customer Relationship Management (CRM) tools like Salesforce and HubSpot track customer interactions and preferences.

  • Example: Analyzing customer purchase history to identify upselling opportunities.
  • Benefit: Enhances customer relationship strategies.

4. Secondary Research Tools

a. Industry Reports and Publications

Reports from organizations like Nielsen, Gartner, or McKinsey provide valuable secondary data.

  • Example: Using market trends from a Nielsen report to strategize.
  • Benefit: Saves time and resources on primary research.

b. Government Data

Government databases, like Census data or economic reports, offer comprehensive and reliable information.

  • Example: Analyzing population trends for market expansion.
  • Benefit: Provides credible data for broad insights.

5. Qualitative Techniques

a. SWOT Analysis

This technique assesses a business’s strengths, weaknesses, opportunities, and threats.

  • Example: A company analyzing its competitive edge in a new market.
  • Benefit: Supports strategic planning.

b. Ethnographic Research

This involves observing consumers in their natural environments to understand their habits and lifestyles.

  • Example: Studying how rural communities use a product.
  • Benefit: Offers deep, contextual insights.

Advantages of Marketing Research

(i) Marketing research helps the management of a firm in planning by providing accurate and up- to-date information about the demands, their changing tastes, attitudes, preferences, buying.

(ii) It helps the manufacturer to adjust his production according to the conditions of demand.

(iii) It helps to establish correlative relationship between the product brand and consumers’ needs and preferences.

(iv) It helps the manufacturer to secure economies in the distribution о his products.

(v) It makes the marketing of goods efficient and economical by eliminating all type of wastage.

(vi) It helps the manufacturer and dealers to find out the best way of approaching the potential.

(vii) It helps the manufacturer to find out the defects in the existing product and take the required corrective steps to improve the product.

(viii) It helps the manufacturer in finding out the effectiveness of the existing channels of distribution and in finding out the best way of distributing the goods to the ultimate consumers.

(ix) It guides the manufacturer in planning his advertising and sales promotion efforts.

(x) It is helpful in assessing the effectiveness of advertising programmes.

(xi) It is helpful in evaluating the relative efficiency of the different advertising media.

(xii) It is helpful in evaluating selling methods.

(xiii) It reveals the causes of consumer resistance.

(xiv) It minimizes the risks of uncertainties and helps in taking sound decisions.

(xv) It reveals the nature of demand for the firm’s product. That is, it indicates whether the demand for the product is constant or seasonal.

(xvi) It is helpful in ascertaining the reputation of the firm and its products.

(xvii) It helps the firm in determining the range within which its products are to be offered to the consumers. That is, it is helpful in determining the sizes, colours, designs, prices, etc., of the products of the firm.

(xviii) It would help the management to know how patents, licensing agreements and other legal restrictions affect the manufacture and sale of the firm’s products.

(xix) It is helpful to the management in determining the actual prices and the price ranges.

(xx) It is helpful to the management in determining the discount rates.

Limitations of Marketing Research

1. High Costs

Conducting marketing research can be expensive, especially for small businesses with limited budgets. Expenses for hiring research agencies, designing surveys, collecting data, and using analytical tools can add up quickly. This financial constraint may force companies to compromise on the quality or scope of the research.

  • Example: A startup may avoid conducting large-scale surveys due to high costs, leading to limited insights.

2. Time-Consuming Process

Marketing research is a time-intensive process that involves multiple steps, including planning, data collection, analysis, and reporting. In fast-moving markets, by the time the research is complete, the insights may already be outdated, rendering them less useful.

  • Example: A company taking months to complete research for a new product launch may lose its first-mover advantage.

3. Risk of Inaccurate Data

The accuracy of marketing research depends on the quality of data collected. If the data is incorrect, biased, or incomplete, the insights derived from it will also be flawed. Poor sampling techniques, respondent dishonesty, or misinterpretation can lead to unreliable results.

  • Example: Customers providing false responses in a survey to avoid revealing their true preferences.

4. Limited Scope

Marketing research often focuses on specific issues, making it difficult to gain a holistic view of the market. Additionally, certain qualitative factors, like emotional responses or cultural nuances, may be difficult to quantify or measure accurately.

  • Example: Research that examines customer satisfaction but overlooks external factors like economic conditions influencing buying behavior.

5. Dependency on Respondents

Marketing research relies heavily on respondents’ participation and honesty. If respondents are unwilling to engage, provide inaccurate information, or exhibit bias, the results can be compromised. Non-response or low response rates can also affect the validity of the study.

  • Example: Online surveys often experience low response rates, leading to insufficient data for meaningful analysis.

6. Rapid Market Changes

Markets are dynamic, with trends, consumer preferences, and competition evolving rapidly. Research findings may become irrelevant by the time they are implemented, especially in industries like technology or fashion where changes occur frequently.

  • Example: A company basing its advertising strategy on outdated research results may fail to connect with current consumer trends.

Cost of Production

Cost of Production refers to the total expenditure incurred by a business in the process of producing goods or services. It includes the monetary value of all inputs used during production, such as raw materials, labor, machinery, utilities, and overheads. Understanding production costs is crucial for determining pricing, profitability, and operational efficiency.

Cost of production is a fundamental concept in both micro and macroeconomics. It helps firms evaluate resource allocation, set competitive prices, and measure profitability. Lower production costs often lead to a higher competitive edge in the market.

Cost of production serves as a cornerstone for analyzing business operations, planning budgets, and making long-term strategic decisions, especially in a competitive and dynamic business environment.

Concept of Costs:

The concept of costs refers to the monetary value of resources sacrificed or expenses incurred in the process of producing goods or services. In economics and business, cost is a fundamental concept that helps firms make informed decisions related to production, pricing, budgeting, and profitability.

Costs are broadly classified based on purpose and perspective:

1. Short-Run and Long-Run Costs

Short-run costs refer to the costs incurred when at least one factor of production is fixed. Typically, capital or plant size is fixed in the short run, while labor and raw materials are variable. As a result, businesses face both fixed and variable costs in the short run. Short-run cost behavior includes increasing or decreasing returns due to limited flexibility in resource adjustment.

Long-run costs are incurred when all factors of production are variable. In the long run, firms can change plant size, technology, and resource combinations to achieve optimal efficiency. There are no fixed costs in the long run. Long-run cost curves represent the least-cost method of producing each output level, and they are derived from short-run average cost curves.

Understanding these concepts helps firms make strategic decisions. In the short run, businesses focus on maximizing output with limited resources, while in the long run, they plan capacity expansion, technology upgrades, and cost minimization.

2. Average and Marginal Costs

Average Cost is the cost per unit of output, calculated by dividing the total cost (TC) by the number of units produced. It indicates the efficiency of production at various output levels and helps in pricing decisions. There are different types of average costs: average total cost, average fixed cost, and average variable cost.

Marginal Cost is the additional cost incurred by producing one more unit of output. It is calculated as the change in total cost when output increases by one unit. Marginal cost plays a crucial role in decision-making, especially in determining optimal production level. If the price of the product is greater than marginal cost, firms increase production; if it’s lower, they reduce it.

The relationship between average cost and marginal cost is important:

  • When MC is less than AC, AC falls.
  • When MC is greater than AC, AC rises.
  • When MC equals AC, AC is at its minimum.

These cost concepts help firms evaluate profitability, determine output levels, and set appropriate prices for sustainability and competitiveness.

3. Total, Fixed, and Variable Costs

Total Cost refers to the overall expense incurred in the production of goods or services. It is the sum of Fixed Costs (FC) and Variable Costs (VC).
TC = FC + VC

Fixed Costs are those costs that do not vary with the level of output. They remain constant even if production is zero. Examples include rent, salaries of permanent staff, and insurance. Fixed costs are unavoidable in the short run and must be paid regardless of production volume.

Variable Costs, on the other hand, change with the level of output. The more a firm produces, the higher the variable cost. Examples include raw materials, hourly wages, and utility charges. These costs are directly proportional to the quantity of production.

Understanding these components is critical for firms to analyze cost behavior and manage operations efficiently. Total cost helps in calculating average and marginal costs, which are essential for decision-making. Fixed costs highlight the burden a firm carries regardless of activity, while variable costs help in adjusting expenses according to production scale.

MC as change in TVC:

Marginal cost for the nth unit may be expressed as

Since fixed cost remains unchanged at all levels of output up to capacity we can write FC = FCn-1 in which case MC may be expressed as:

MCn = VCn – VCn-1

Thus marginal cost refers to marginal variable cost. In other words, MC has no relation to fixed cost.

National income Analysis and Measurement

National income refers to the total monetary value of all final goods and services produced within a country’s borders over a specific period, typically a year. It serves as a crucial indicator of a country’s economic performance and standard of living. In India, national income is measured using various methods, including the production approach, income approach, and expenditure approach.

A. Gross Domestic Product (GDP)

Gross Domestic Product (GDP) is the most commonly used measure of national income and represents the total value of all final goods and services produced within a country’s borders during a specified period, usually a year. In India, GDP is calculated using both production and expenditure approaches.

Key Features of GDP:

  • Domestic Focus: It includes only the goods and services produced within the country, regardless of the nationality of the producer.

  • Final Goods Only: It counts only final goods and services to avoid double counting (intermediate goods are excluded).

  • Market Value: Goods and services are evaluated at current market prices.

  • Time-bound: GDP is always measured over a specific time period (quarterly or annually).

  • Inclusive of All Sectors: It includes the output of the agriculture, industrial, and service sectors.

Methods of Calculating GDP:

There are three main methods to calculate GDP:

1. Production (Output) Method

  • Measures the total value added at each stage of production across all sectors.
  • GDP = Gross Value of Output – Value of Intermediate Consumption

2. Income Method

  • Sums up all incomes earned by factors of production (wages, rent, interest, profit).
  • GDP = Compensation to employees + Operating surplus + Mixed income

Expenditure Method

  • Adds up all expenditures made on final goods and services.
  • GDP = C + I + G + (X – M)
    Where:
    C = Consumption
    I = Investment
    G = Government Expenditure
    X = Exports
    M = Imports

Types of GDP:

1. Nominal GDP

  • Measured at current market prices, without adjusting for inflation.

  • It reflects price changes and not actual growth.

2. Real GDP

  • Adjusted for inflation or deflation.

  • Shows the true growth in volume of goods and services.

3. GDP at Market Price (GDPMP)

  • Includes indirect taxes and excludes subsidies.

4. GDP at Factor Cost (GDPFC)

  • GDPMP – Indirect Taxes + Subsidies

  • Reflects the income earned by the factors of production.

Significance of GDP:

  • Indicator of Economic Health: Higher GDP indicates a growing economy.

  • Comparison Tool: Enables comparison of economies across countries or time periods.

  • Policy Planning: Governments use GDP data to design fiscal and monetary policies.

  • Investment Decisions: Investors rely on GDP trends for market analysis and forecasting.

Limitations of GDP:

  • Ignores Income Distribution: Doesn’t show inequality or poverty levels.

  • Non-Market Activities Excluded: Housework or informal sector contributions are not counted.

  • Environmental Degradation: GDP growth may come at the cost of resource depletion.

  • Underground Economy: Unrecorded economic activities are not included.

Components of GDP:

In India, GDP is composed of several components, including:

  • Consumption (C)

Expenditure on goods and services by households, including spending on food, housing, healthcare, education, and other consumer goods.

  • Investment (I)

Expenditure on capital goods such as machinery, equipment, construction, and infrastructure, including both private and public sector investment.

  • Government Spending (G)

Expenditure by the government on goods and services, including salaries, public infrastructure, defense, and social welfare programs.

  • Net Exports (NX)

The difference between exports and imports of goods and services. A positive value indicates a trade surplus, while a negative value indicates a trade deficit.

Sectorial Composition of GDP:

India’s GDP is composed of several sectors:

  • Agriculture

This sector includes farming, forestry, fishing, and livestock, and contributes to food security, rural livelihoods, and raw material supply for industries.

  • Industry

The industrial sector encompasses manufacturing, mining, construction, and utilities. It drives economic growth, employment generation, and technological advancement.

  • Services

The services sector includes trade, transport, communication, finance, real estate, professional services, and government services. It accounts for a significant share of GDP and employment and plays a crucial role in supporting other sectors.

B. Gross National Product (GNP)

Gross National Product (GNP) is the total monetary value of all final goods and services produced by the residents (nationals) of a country in a given period (usually a year), regardless of where the production takes place—whether within the domestic economy or abroad.

In other words, GNP = GDP + Net Factor Income from Abroad (NFIA).

Net Factor Income from Abroad (NFIA) includes:

  • Income earned by residents abroad (wages, dividends, interest, etc.)

  • Minus income earned by foreigners within the domestic territory

GNP = GDP + (Income earned from abroad − Income paid to foreigners)

Key Characteristics of GNP:

  • Nationality-Based: Focuses on ownership, not geography. It includes income earned by citizens and businesses of a country, even if earned outside its borders.

  • Includes Net Factor Income: Takes into account factor incomes (wages, rent, interest, profits) earned internationally.

  • Reflects Economic Strength Globally: Measures a nation’s economic contribution globally, especially helpful for countries with high overseas employment or investments.

  • Measured Annually or Quarterly: Like GDP, GNP is also calculated over a specific time period.

Example to Understand GNP

Suppose:

  • India’s GDP = ₹250 lakh crore

  • Income earned by Indian citizens abroad = ₹15 lakh crore

  • Income earned by foreigners in India = ₹10 lakh crore

Then:

GNP = ₹250 + ₹15 − ₹10 = ₹255 lakh crore

Types of GNP:

  • GNP at Market Prices (GNPMP): Includes indirect taxes and excludes subsidies.

  • GNP at Factor Cost (GNPFC):

    GNP at Factor Cost = GN at Market Price − Indirect Taxes + Subsidies

Importance of GNP:

  • Measures National Income Globally: Indicates the economic strength of a nation including overseas activities.

  • Helps in Policy Formulation: Useful for countries with significant remittances or foreign business operations.

  • Comparative Analysis: Helpful for comparing resident income versus domestic production (GNP vs GDP).

  • Better Measure for Some Economies: For countries with many overseas workers (e.g., Philippines, India), GNP may reflect actual income inflow more accurately than GDP.

Limitations of GNP:

  • Neglects Domestic Productivity: May overstate or understate true economic strength if NFIA is volatile.

  • Difficulties in Measuring NFIA: Tracking international incomes can be inaccurate or delayed.

  • Not a Welfare Indicator: Like GDP, GNP doesn’t reflect inequality, environmental damage, or well-being.

  • Ignores Informal Economy: Unregistered businesses and informal work are excluded.

C. Net National Product (NNP)

Net National Product (NNP) is the monetary value of all final goods and services produced by the residents of a country in a given period (usually one year), after accounting for depreciation (also known as capital consumption allowance).

It is derived from Gross National Product (GNP) by subtracting the depreciation of capital goods.

NNP = GNP − Depreciation

Features of NNP:

  • Reflects Net Output: It shows the net production of an economy after maintaining the existing capital stock.

  • Depreciation-Adjusted: More accurate than GNP or GDP because it adjusts for capital consumption.

  • Residents’ Contribution: Includes production by nationals both domestically and abroad.

  • Indicates Sustainability: Provides insight into how sustainable a country’s production is over time.

Example

Let’s say:

  • GNP of a country = ₹280 lakh crore

  • Depreciation = ₹30 lakh crore

Then:

NNP = ₹280 − ₹30 = ₹250 lakh crore

If Indirect Taxes = ₹12 lakh crore, Subsidies = ₹2 lakh crore:

Then:

NNPFC = ₹250 − ₹12 + ₹2 = ₹240 lakh crore

This ₹240 lakh crore is also called the National Income.

D. Personal Income (PI)

Personal Income refers to the total income received by individuals or households in a country from all sources before the payment of personal taxes. It includes all earnings from wages, salaries, investments, rents, interest, and transfer payments such as pensions, unemployment benefits, and subsidies.

In simple terms, Personal Income is the income available to individuals before paying taxes, but after adding transfer incomes and excluding undistributed profits and other non-receivable incomes.

Formula to Calculate Personal Income

Personal Income = National Income − Corporate Taxes − Undistributed Corporate Profits + Transfer Payments

Where:

  • National Income (NI) is the total income earned by a country’s residents.
  • Corporate Taxes are taxes paid by companies on their profits.
  • Undistributed Corporate Profits are profits retained by companies.
  • Transfer Payments include pensions, subsidies, and social security benefits.

Components of Personal Income:

  • Wages and Salaries: Earnings from employment.

  • Rent: Income from letting out property or land.

  • Interest: Returns from savings or investments in bonds.

  • Dividends: Income from shares in corporations.

  • Transfer Payments: Pensions, unemployment benefits, welfare payments, etc.

  • Proprietors’ Income: Profits from unincorporated businesses.

Importance of Personal Income:

  • Indicator of Economic Well-Being: Personal Income reflects how much money people actually receive, indicating living standards and household purchasing power.
  • Guides Taxation Policies: Governments use PI to design progressive tax policies and to decide on tax brackets for individuals.
  • Helps in Consumption Analysis: Since consumption is closely linked with income, PI helps in forecasting demand patterns and consumer spending trends.
  • Useful in Social Welfare Planning: Helps to identify income disparities and plan welfare programs such as subsidies or unemployment benefits.

E. Personal Disposable Income (PDI)

Personal Disposable Income (PDI) refers to the amount of money left with individuals or households after paying all personal direct taxes such as income tax. It is the net income available for consumption and savings.

In simple terms, PDI = Personal Income – Personal Taxes.

It represents the real purchasing power of households and is a crucial indicator of consumer behavior and economic demand.

Components of PDI:

  • Wages and Salaries – After-tax income from employment.

  • Transfer Payments – Net of any taxes (e.g., pensions, unemployment benefits).

  • Investment Income – Interest, dividends, and rent received after taxes.

  • Proprietors’ Income – Profits earned by individuals in business, minus personal tax.

Importance of Personal Disposable Income:

  • Measures Purchasing Power: PDI directly reflects how much individuals can spend or save, making it a key driver of consumer demand in the economy.
  • Helps in Demand Forecasting: Analysts use PDI trends to predict changes in consumption patterns, which guide production and marketing strategies.
  • Supports Economic Planning: Government can design policies like stimulus packages or tax reliefs based on changes in PDI to boost spending.
  • Indicates Economic Welfare: Rising PDI is a sign of improved living standards, while declining PDI may indicate growing tax burdens or inflation effects.

F. Gross Value Added (GVA)

Gross Value Added (GVA) is a measure of the value added by various sectors of the economy in the production process. It represents the difference between the value of output and the value of intermediate consumption. GVA provides insights into the contribution of different sectors to the overall economy.

G. Gross National Income (GNI)

Gross National Income (GNI) measures the total income earned by a country’s residents, including both domestic and international sources. It includes GDP plus net income from abroad, such as remittances, interest, dividends, and other payments received from overseas.

H. Net National Income (NNI)

Net National Income (NNI) is derived from GNI by subtracting depreciation or the value of capital consumption. NNI reflects the net income generated by a country’s residents after accounting for the depreciation of capital assets.

I. Per Capita Income

Per Capita Income is calculated by dividing the total national income (such as GDP or GNI) by the population of the country. It represents the average income earned per person and serves as a measure of the standard of living and economic welfare.

Trends and Challenges:

India’s national income and its aggregates have witnessed significant growth and transformation over the years. However, the country faces various challenges:

  • Income Inequality

Disparities in income distribution persist, with a significant portion of the population facing poverty and economic deprivation.

  • Sectoral Disparities

There are wide gaps in development and productivity across different sectors and regions, with disparities between rural and urban areas.

  • Unemployment and Underemployment

India grapples with high levels of unemployment and underemployment, particularly among youth and marginalized communities.

  • Infrastructure Deficit

Inadequate infrastructure, including transportation, energy, and digital connectivity, hampers economic growth and competitiveness.

  • Environmental Sustainability

Rapid economic growth has led to environmental degradation, pollution, and resource depletion, necessitating sustainable development practices.

  • Policy Reforms

Structural reforms and policy initiatives are required to address bottlenecks, promote investment, boost productivity, and enhance competitiveness.

Government Initiatives:

The Indian government has introduced various policies and initiatives to promote economic growth, employment generation, and inclusive development:

  • Make in India

A flagship initiative aimed at boosting manufacturing, promoting investment, and enhancing competitiveness.

  • Digital India

A program focused on digital infrastructure, e-governance, and digital empowerment to drive technological advancement and digital inclusion.

  • Skill India

A skill development initiative aimed at enhancing the employability of the workforce and bridging the skills gap.

  • Pradhan Mantri Jan Dhan Yojana (PMJDY)

A financial inclusion program aimed at expanding access to banking services, credit, and insurance for marginalized communities.

  • Goods and Services Tax (GST)

A comprehensive indirect tax reform aimed at simplifying the tax structure, promoting transparency, and boosting tax compliance.

Methods of Measuring National Income

  • Product Approach

In product approach, national income is measured as a flow of goods and services. Value of money for all final goods and services is produced in an economy during a year. Final goods are those goods which are directly consumed and not used in further production process. In our economy product approach benefits various sectors like forestry, agriculture, mining etc to estimate gross and net value.

  • Income Approach

In income approach, national income is measured as a flow of factor incomes. Income received by basic factors like labor, capital, land and entrepreneurship are summed up. This approach is also called as income distributed approach.

  • Expenditure Approach

This method is known as the final product method. In this method, national income is measured as a flow of expenditure incurred by the society in a particular year. The expenditures are classified as personal consumption expenditure, net domestic investment, government expenditure on goods and services and net foreign investment.

These three approaches to the measurement of national income yield identical results. They provide three alternative methods of measuring essentially the same magnitude.

Meaning, Nature and Scope of Economics

Economics is a social science that studies how individuals, businesses, and governments allocate limited resources to satisfy unlimited wants. It deals with the production, distribution, and consumption of goods and services. The core focus of economics is the problem of scarcity—resources such as land, labor, and capital are limited, while human desires are endless. This mismatch forces societies to make choices about what to produce, how to produce, and for whom to produce.

Economics is broadly divided into two branches: Microeconomics and Macroeconomics. Microeconomics examines individual units like consumers, firms, and markets, focusing on demand, supply, and price determination. Macroeconomics, on the other hand, analyzes the economy as a whole, dealing with national income, inflation, unemployment, and economic growth.

Economics also involves studying incentives and behaviors. It tries to explain how people respond to changes in prices, income, and government policies. For example, if the price of a good rises, demand may fall—this behavioral aspect is central to economic analysis.

Modern economics is applied across various fields such as healthcare, finance, environmental studies, and business strategy. It aids in policy formulation, business planning, and efficient resource utilization.

In essence, economics provides the tools to understand and respond to complex real-world issues, making it essential for making informed decisions in both personal and professional contexts.

Nature of Economics:

  • Economics as a Social Science

Economics is considered a social science because it studies human behavior in relation to the allocation of scarce resources. Like other social sciences, it analyzes patterns, choices, and decisions people make under constraints. Economics deals with real-life issues such as consumption, production, employment, and trade. It uses scientific methods to study human actions in the economic domain and formulates theories based on observation and reasoning to understand how people respond to incentives and constraints.

  • Study of Scarcity and Choice

Economics centers around the problem of scarcity, which arises due to limited resources and unlimited wants. Because not all desires can be satisfied, individuals and organizations must make choices. Economics studies how these choices are made and how resources are allocated efficiently. This nature of economics is vital in understanding trade-offs, prioritization, and opportunity costs. It helps determine the best use of available resources to maximize utility, output, or welfare.

  • Economics is Both a Science and an Art

Economics is a science because it develops principles and laws based on systematic observations, analysis, and logic. It explains cause-and-effect relationships in economic phenomena. Simultaneously, economics is also an art as it involves the practical application of knowledge to achieve economic objectives such as reducing poverty or controlling inflation. It guides individuals, businesses, and governments in decision-making and problem-solving, making it both theoretical and practical in nature.

  • Economics is Dynamic

Economics is not static—it evolves with changes in social, political, and technological environments. As consumer preferences, market conditions, and resource availability change, economic theories and practices also adapt. This dynamic nature makes economics relevant across eras, allowing it to address emerging issues like digital currencies, climate change, and global pandemics. It responds to current challenges and continuously redefines strategies for efficient economic management and sustainable development.

  • Economics is Normative and Positive

Economics has both positive and normative aspects. Positive economics deals with facts and describes what is happening in the economy—like “an increase in interest rates reduces borrowing.” Normative economics, on the other hand, involves value judgments—such as “the government should increase healthcare spending.” The nature of economics lies in balancing both perspectives: it explains real-world situations and suggests what ought to be done for better societal outcomes.

  • Economics is Concerned with Human Welfare

A core nature of economics is its concern for human welfare. Classical and modern economists view economics not just as a wealth-generating activity but also as a means to enhance the standard of living. It studies how resources can be allocated efficiently to fulfill basic needs, reduce inequality, and improve social well-being. Development economics, for example, focuses on uplifting poor communities through policy reforms and sustainable economic strategies.

  • Economics is Abstract and Quantitative

Economics often uses abstract models and assumptions to simplify complex real-world situations. Concepts like demand curves, equilibrium, and elasticity are built on theoretical frameworks. At the same time, economics is quantitative—it uses data, statistics, and mathematical tools to analyze trends and forecast outcomes. This dual nature of being both conceptual and measurable helps economists evaluate policies and make informed decisions based on empirical evidence.

  • Universal Applicability of Economics

The principles of economics apply universally across individuals, businesses, industries, and nations. Whether in a household managing a monthly budget or a multinational corporation planning global investments, economic reasoning is essential. From pricing strategies to resource allocation, the scope of economics covers all levels of decision-making. Its universal applicability makes it a valuable tool for solving diverse problems in finance, governance, marketing, and international trade.

Scope of Economics:

  • Consumption

Consumption is a fundamental area in the scope of economics. It deals with how individuals and households use goods and services to satisfy their wants. Economics studies consumer behavior, utility maximization, and demand patterns. Understanding consumption helps businesses predict buying behavior, while governments use this knowledge to design tax policies and welfare programs. Consumption analysis explains how income, price changes, and preferences affect demand and is crucial for pricing, production planning, and marketing strategies.

  • Production

Production involves the transformation of inputs (land, labor, capital, entrepreneurship) into output. Economics examines how these resources are combined efficiently to maximize output and profits. It also studies the laws of production, economies of scale, and production functions. The scope of production analysis helps businesses in cost minimization, resource allocation, and technology adoption. Efficient production is key to competitiveness and sustainability in business operations and national economic growth.

  • Distribution

Distribution refers to how income and wealth are shared among the factors of production—landowners, laborers, capitalists, and entrepreneurs. Economics studies how wages, rent, interest, and profits are determined. The fairness and efficiency of income distribution impact economic stability, social equity, and standard of living. Understanding distribution helps policymakers address inequality through taxation, welfare schemes, and labor laws. For businesses, it affects cost structures, employee compensation, and investment decisions.

  • Exchange

Exchange is the process by which goods and services are traded. Economics explores market structures (perfect competition, monopoly, oligopoly), pricing mechanisms, and trade practices. It helps understand how value is determined, how markets operate, and how supply meets demand. Exchange analysis guides businesses in setting prices, identifying competitors, and evaluating market opportunities. It also includes the role of money, banking, and credit systems in facilitating smooth transactions.

  • Public Finance

Public finance falls within the scope of economics by analyzing government income and expenditure. It includes taxation, public spending, budgeting, and debt management. Economics studies how government policies affect economic growth, inflation, employment, and income distribution. It provides tools to evaluate the impact of fiscal policies on the economy. Businesses are also affected by public finance through taxation policies, subsidies, infrastructure development, and government procurement strategies.

  • Economic Growth and Development

Economics examines both short-term growth and long-term development. Growth refers to an increase in national income, while development includes improvements in health, education, infrastructure, and living standards. Economics studies factors that promote or hinder development, such as investment, innovation, political stability, and resource management. This area is essential for policymakers and global institutions to create strategies for poverty reduction, inclusive growth, and sustainable development.

  • International Trade and Economics

International trade is a vital part of economics that deals with the exchange of goods, services, and capital across borders. It studies comparative advantage, trade policies, tariffs, exchange rates, and global economic organizations like WTO and IMF. Understanding international economics helps countries and businesses develop trade strategies, expand markets, and respond to global economic shifts. It also explains the effects of globalization, balance of payments, and international competition.

  • Economic Planning and Policy Making

Economics provides the foundation for policy formulation and planning at national and organizational levels. It assists governments in framing monetary, fiscal, and industrial policies based on economic objectives. It also helps businesses in strategic planning, risk analysis, and market forecasting. This area includes planning resource allocation, managing economic cycles, and addressing social challenges. Economics thus plays a critical role in achieving stability, growth, and sustainable development.

Consumer Behaviour, Meaning, Importance, Nature, Challenges, Determinants

Consumer behaviour refers to the study of how individuals, groups, or organizations select, buy, use, and dispose of goods, services, ideas, or experiences to satisfy their needs and wants. It involves understanding the decision-making processes of buyers, both individually and collectively, and how various internal and external factors influence their purchasing decisions.

Consumer behaviour is influenced by several psychological, personal, social, and cultural factors. These include motivation, perception, learning, personality, lifestyle, income, family, reference groups, and cultural background. For example, a consumer’s preference for a brand can be shaped by past experiences, advertisements, peer recommendations, or current trends.

The study of consumer behaviour is essential for businesses and marketers because it helps them understand what drives customer choices. It enables companies to design better products, tailor marketing strategies, set appropriate pricing, choose effective distribution channels, and enhance customer satisfaction. By analyzing consumer behaviour, businesses can also forecast demand, segment markets accurately, and gain a competitive edge.

In modern times, consumer behaviour is dynamic and continuously evolving due to digital transformation, rising consumer awareness, and socio-economic shifts. Businesses must keep track of changing consumer patterns to remain relevant and responsive to market needs.

In essence, consumer behaviour is at the heart of all marketing activities, helping businesses connect their offerings to what customers truly value.

Importance of Consumer Behaviour:

  • Helps in Product Development

Studying consumer behaviour allows businesses to design products and services that meet customer needs and preferences. By understanding what motivates buyers, companies can develop features, quality, and packaging that align with expectations. For example, rising demand for healthy lifestyles has encouraged food brands to introduce organic and low-sugar options. Without analyzing consumer behaviour, businesses risk creating irrelevant products that fail in the market. Thus, knowledge of consumer choices, trends, and feedback ensures successful product development, minimizes wastage, and increases acceptance. It also helps businesses stay ahead of competitors by offering solutions that customers genuinely value.

  • Effective Marketing Strategies

Consumer behaviour is vital for formulating effective marketing strategies. By analyzing buying patterns, attitudes, and decision-making processes, businesses can segment markets and target customers more accurately. For example, luxury brands focus on high-income groups that value prestige, while budget brands target price-sensitive consumers. This understanding helps in choosing the right pricing, promotion, and distribution channels. Additionally, it enables companies to craft persuasive messages that appeal to customer emotions and rational needs. Ultimately, consumer behaviour insights ensure that marketing campaigns reach the right audience at the right time, enhancing efficiency, profitability, and customer satisfaction for businesses.

  • Improves Customer Satisfaction

By studying consumer behaviour, businesses can better understand customer expectations, enabling them to provide personalized products, services, and experiences. When companies know what customers value most—such as quality, convenience, or affordability—they can design offerings accordingly. Satisfied customers are more likely to make repeat purchases, recommend the brand to others, and remain loyal over time. For example, e-commerce platforms analyze browsing and purchase behaviour to recommend suitable products, enhancing convenience. Meeting or exceeding customer expectations not only strengthens relationships but also reduces churn. Therefore, consumer behaviour analysis plays a crucial role in maximizing satisfaction, loyalty, and long-term success.

  • Forecasting Market Trends

Consumer behaviour analysis helps businesses predict future market trends and adapt accordingly. By observing shifts in preferences, lifestyles, and technology adoption, companies can forecast demand and plan strategies in advance. For instance, the growing interest in sustainability has encouraged businesses to adopt eco-friendly practices and products. Similarly, digital shopping behaviour has driven the growth of e-commerce platforms. Forecasting trends ensures businesses remain competitive, avoid losses, and capture emerging opportunities before rivals. Understanding consumer behaviour also minimizes risks associated with changing market conditions. In short, it acts as a guide for anticipating future demand and achieving sustainable growth.

  • Supports Business Decision-Making

Consumer behaviour provides critical insights that influence almost every business decision, from product design and pricing to advertising and distribution. By understanding how customers make choices, businesses can allocate resources more effectively and reduce the risk of failure. For example, if research shows that customers prefer online shopping over physical stores, businesses can invest more in e-commerce platforms. It also helps managers prioritize strategies that deliver maximum value. Data-driven decision-making, based on consumer behaviour, enhances efficiency and ensures business activities remain customer-focused. This leads to higher profitability, competitive advantage, and sustainable success in a dynamic marketplace.

Nature of Consumer Behaviour:

  • Complex Process

Consumer behavior is a complex process involving multiple psychological and social factors that influence decision-making. Consumers do not simply purchase products; they go through several stages, including need recognition, information search, evaluation of alternatives, purchase decision, and post-purchase behavior. The complexity arises due to varying individual preferences, motivations, cultural influences, and situational factors, making it challenging for businesses to predict consumer actions accurately.

  • Influenced by Various Factors

Consumer behavior is influenced by personal, psychological, social, and cultural factors. Personal factors include age, gender, and lifestyle, while psychological factors involve perception, learning, and attitudes. Social influences like family, reference groups, and social class also play a role. Additionally, cultural factors such as values, traditions, and societal norms shape consumer preferences and buying decisions.

  • Dynamic in Nature

Consumer behavior is dynamic and constantly evolving due to changes in personal preferences, technology, lifestyle, and market trends. New products, innovations, and marketing strategies influence consumer preferences over time. Additionally, external factors like economic conditions and societal shifts can alter consumer priorities, making it essential for businesses to stay updated and adapt to changing consumer needs.

  • Goal-Oriented

Consumers exhibit goal-oriented behavior, meaning their purchasing decisions are driven by the desire to fulfill specific needs or achieve certain outcomes. These needs may be functional, emotional, or symbolic. For instance, a consumer may buy a product for its practical utility, to gain emotional satisfaction, or to express social status. Understanding these goals helps marketers design better value propositions.

  • Varies Across Individuals

Consumer behavior varies greatly from person to person due to differences in personality, preferences, and socio-economic background. While some consumers may prioritize price, others might focus on quality, brand reputation, or convenience. This variability necessitates market segmentation and personalized marketing approaches to cater to different consumer groups effectively.

  • Involves Decision-Making

Consumer behavior involves a decision-making process where consumers evaluate various alternatives before making a final purchase. This process includes identifying needs, gathering information, comparing options, and making choices. Post-purchase evaluation, where consumers assess whether their expectations were met, is also a critical aspect. Businesses need to understand this process to influence decision-making positively.

  • Reflects Social Influence

Consumer behavior often reflects the influence of social factors such as family, friends, peer groups, and society at large. People tend to seek social acceptance and approval in their purchasing decisions. Word-of-mouth recommendations, social media, and online reviews have a significant impact on consumer behavior, making social influence a critical element in marketing strategies.

  • Varies by Product Type

Consumer behavior differs depending on the type of product or service being purchased. For high-involvement products like cars or electronics, consumers spend more time researching and comparing options. In contrast, low-involvement products like daily essentials involve quick decision-making. Understanding this distinction helps businesses tailor their marketing efforts to suit different product categories.

  • Influenced by Perception

Perception plays a significant role in consumer behavior, as individuals form subjective opinions about products and brands based on how they interpret information. Factors such as advertising, packaging, branding, and word-of-mouth shape consumer perceptions. Even if two products offer similar value, consumers may choose the one they perceive as superior due to effective marketing.

  • Leads to Customer Satisfaction

The ultimate goal of consumer behavior is to achieve customer satisfaction. When consumers feel that a product or service meets or exceeds their expectations, they experience satisfaction, leading to brand loyalty and repeat purchases. Conversely, dissatisfaction can result in negative reviews and lost customers. Understanding consumer behavior allows businesses to create offerings that maximize satisfaction and long-term relationships.

Challenges of Consumer Behaviour:

  • Complexity of Consumer Needs

Consumers have diverse and complex needs that vary across individuals and situations. A single product may cater to different needs for different people. For instance, one consumer may buy a car for luxury, while another buys it for utility. Understanding and predicting these multifaceted needs is a significant challenge for marketers aiming to create products that satisfy varying consumer expectations.

  • Rapidly Changing Preferences

Consumer preferences evolve rapidly due to factors like technological advancements, societal trends, and exposure to global cultures. What is popular today may become obsolete tomorrow. Keeping up with these changing preferences requires businesses to be highly adaptable and continuously innovate to meet new demands. Failing to do so can result in losing relevance in the market.

  • Influence of Social and Cultural Factors

Social and cultural factors greatly influence consumer behavior. These factors differ significantly across regions, making it challenging for global businesses to design universally appealing marketing strategies. For example, a product that is successful in one country may not resonate in another due to cultural differences. Understanding and respecting these nuances is critical for market success.

  • Impact of Psychological Factors

Consumer behavior is heavily influenced by psychological elements such as perception, motivation, attitudes, and beliefs. These factors are subjective and vary widely among individuals, making it difficult for marketers to generalize behaviors. Additionally, psychological factors are often subconscious, further complicating efforts to predict or influence consumer actions.

  • Information Overload

In today’s digital age, consumers are bombarded with information from multiple sources, including advertisements, social media, and peer reviews. This information overload makes it harder for businesses to capture and retain consumer attention. Moreover, consumers may struggle to process all the information, leading to unpredictable buying behavior.

  • Increasing Consumer Expectations

With the availability of numerous alternatives and personalized offerings, consumer expectations have risen significantly. Modern consumers demand high-quality products, exceptional service, and unique experiences. Meeting these elevated expectations requires businesses to continuously improve their offerings, which can be resource-intensive and difficult to sustain.

  • Influence of Technology

Technology has transformed how consumers interact with businesses. From online shopping to social media engagement, digital platforms have created new avenues for consumer behavior. However, this has also increased the complexity of tracking and understanding consumer preferences across multiple channels. Businesses must invest in advanced analytics to gain insights into online consumer behavior.

  • Brand Loyalty vs. Switching Behavior

Building brand loyalty is a key objective for businesses, but it has become more challenging due to increased competition and abundant choices. Consumers can easily switch to competitors if they find better value elsewhere. Marketers must constantly engage consumers and deliver superior value to retain loyalty while addressing switching behavior effectively.

  • Ethical and Sustainable Consumption

Modern consumers are increasingly concerned about ethical and sustainable practices. They prefer brands that prioritize environmental and social responsibility. Businesses face the challenge of aligning their operations with these values while maintaining profitability. Additionally, they must communicate their efforts effectively to gain consumer trust.

  • Difficulty in Segmenting Markets

Effective market segmentation is essential for targeted marketing, but it is not always easy to implement. Consumer behavior can vary within segments due to individual differences, making it hard to identify homogeneous groups. Moreover, segments may overlap, requiring businesses to adopt complex, multi-segment strategies for better targeting.

Individual Determinants of Consumer Behaviour:

  • Motivation

Motivation is the internal driving force that stimulates consumers to take action to satisfy their needs and wants. It arises when there is a gap between the actual state and the desired state. For example, hunger motivates the purchase of food, while the need for social status motivates luxury purchases. Theories like Maslow’s Hierarchy of Needs explain how motivation ranges from basic physiological needs to higher-level needs like esteem and self-actualization. Marketers tap into these motives by linking products with need satisfaction. Strong motivation increases involvement and purchasing urgency, while weak motivation delays decisions. Hence, motivation is a critical determinant that guides consumer choices and influences brand preference.

  • Perception

Perception refers to how consumers select, organize, and interpret information to form a meaningful picture of the world. It is not just about receiving stimuli but also about how individuals process and interpret them. For example, two consumers may view the same advertisement differently—one finds it attractive while the other ignores it. Perception is influenced by factors such as selective attention, selective distortion, and selective retention. Marketers must ensure their messages are clear, credible, and engaging to shape favourable perceptions. Since perception determines how consumers see product quality, price, and brand image, it plays a key role in influencing purchase behaviour and loyalty.

  • Learning

Learning in consumer behaviour refers to the changes in an individual’s behaviour resulting from past experiences, information, and practice. When consumers buy a product and are satisfied, they tend to repeat the purchase, which forms a habit over time. Conversely, negative experiences lead to avoidance. Learning occurs through processes such as classical conditioning, operant conditioning, and cognitive learning. For instance, repeated exposure to a brand with positive reinforcement (discounts, rewards) increases preference. Marketers use this determinant by creating associations between their products and positive experiences, ensuring consistent quality, and running loyalty programs. Learning shapes brand loyalty and simplifies decision-making in future purchases.

  • Personality

Personality is the unique set of psychological traits, characteristics, and behavioural patterns that influence how consumers respond to situations. Traits such as dominance, sociability, self-confidence, or creativity affect buying decisions. For example, extroverted consumers may prefer fashionable clothing or social activities, while introverts may prioritize books or digital gadgets. Marketers often link products to specific personality types, positioning brands as adventurous, sophisticated, or reliable. Personality is also stable over time, which allows businesses to segment markets based on personality traits. Understanding consumer personality helps marketers predict preferences, design appealing campaigns, and develop products that resonate with specific personality-driven lifestyles.

  • Attitudes

Attitudes are learned predispositions that reflect how consumers think, feel, and behave toward products, brands, or services. They consist of three components: cognitive (beliefs and knowledge), affective (emotions and feelings), and conative (behavioural intentions). For example, a consumer may believe a smartphone brand is innovative (cognitive), feel excited about it (affective), and decide to purchase it (conative). Attitudes are formed over time through experiences, word-of-mouth, and marketing influences. Since they are relatively consistent, they strongly influence buying behaviour. Marketers often use attitude-change strategies through persuasive communication, rebranding, or promotional campaigns to modify unfavourable attitudes and reinforce positive ones to build long-term loyalty.

  • Personality and SelfConcept

Beyond personality traits, the self-concept (how individuals perceive themselves) also affects consumer behaviour. Consumers buy products that reflect or enhance their self-image. For instance, a consumer with a strong self-image as eco-friendly prefers sustainable products. Self-concept includes the actual self (who the consumer thinks they are), ideal self (who they aspire to be), and social self (how they want others to see them). Marketers use this determinant by designing products that align with consumers’ self-expression and identity. Luxury brands, fitness products, and fashion items often appeal to this psychological factor, making it a powerful driver of preference and brand connection.

  • Culture

Culture is the most fundamental external determinant of consumer behaviour. It represents shared values, beliefs, customs, traditions, and lifestyles that shape consumer preferences and buying decisions. For example, in India, cultural values influence food habits, clothing choices, and festival shopping. Culture determines what is considered acceptable or desirable in society. Subcultures—based on religion, region, or ethnicity—further affect buying patterns. Marketers must design culturally sensitive products and campaigns to connect with diverse audiences. For instance, global brands often customize advertisements for Indian festivals like Diwali or Eid. Thus, culture guides long-term buying behaviour by shaping consumer priorities, needs, and perceptions of value.

  • Social Class

Social class refers to the hierarchical divisions in society based on income, education, occupation, and lifestyle. It influences consumer preferences, product choices, and spending patterns. Higher social classes often purchase luxury goods, premium brands, and services that display status, while middle or lower classes focus on value-for-money and functional products. For example, affluent consumers may prefer designer clothes, while working-class buyers prioritize affordability. Social class also affects brand loyalty and shopping behaviour, such as preference for high-end malls or local markets. Marketers use class segmentation to position products differently for premium, mid-range, and budget customers, ensuring appeal across social groups.

  • Family

Family plays a critical role in shaping consumer behaviour, as it influences purchasing decisions from childhood to adulthood. Parents, spouses, and children often act as decision-makers, influencers, or buyers. For example, children influence food, toys, and gadget purchases, while spouses decide on financial products, furniture, or vacations. Family life cycle stages (bachelorhood, married with kids, retired) also affect buying patterns, with needs changing over time. Marketers design campaigns targeting family roles, such as “family packs” or advertisements showing parents and children together. Since family values strongly affect consumption, businesses that connect with family needs build stronger emotional bonds with consumers.

  • Reference Groups

Reference groups are groups of people that individuals look up to for opinions, approval, or guidance. They include friends, colleagues, celebrities, or social influencers who shape buying behaviour by creating trends or social pressure. For example, if peers purchase the latest smartphone, others may follow to maintain social acceptance. Reference groups are classified as primary groups (close family and friends), secondary groups (colleagues, professional groups), aspirational groups (celebrities, influencers), and dissociative groups (those we avoid). Marketers often use celebrity endorsements, influencer marketing, and peer testimonials to appeal to consumers. Reference groups strongly affect youth behaviour, fashion trends, and lifestyle choices.

  • Social Factors

Social factors include broader influences such as roles, status, and peer interactions that affect how individuals consume products. Each person plays different roles in life—such as student, professional, or parent—and their purchases reflect those roles. For instance, a corporate manager may buy formal suits to reflect professional status, while the same person may buy casual wear for leisure. Status is another driver; consumers often purchase brands that signify prestige. For example, luxury watches or high-end cars symbolize higher social standing. Marketers target these factors by designing products that align with roles and highlight prestige value, encouraging status-driven purchases.

National Income, Meaning, Methods, expenditure method, income received approach, Production Method, Value added or Net product method

National Income refers to the total monetary value of all final goods and services produced by the residents of a country during a specific accounting year. It includes income earned from both domestic and foreign sources, but only by citizens or institutions of the country. National income is a critical indicator of the economic performance of a nation and reflects the overall economic health and living standards of its population.

Economists often define national income as the net national product at factor cost (NNPfc). It is calculated by subtracting depreciation and indirect taxes from the Gross Domestic Product (GDP) and adding subsidies. It encompasses all forms of income—wages, rent, interest, and profit—earned by factors of production (land, labor, capital, and entrepreneurship).

According to Marshall: “The labour and capital of a country acting on its natural resources produce annually a certain net aggregate of commodities, material and immaterial including services of all kinds. This is the true net annual income or revenue of the country or national dividend.” In this definition, the word ‘net’ refers to deductions from the gross national income in respect of depreciation and wearing out of machines. And to this, must be added income from abroad.

Simon Kuznets has defined national income as “the net output of commodities and services flowing during the year from the country’s productive system in the hands of the ultimate consumers.”

On the other hand, in one of the reports of United Nations, national income has been defined on the basis of the systems of estimating national income, as net national product, as addition to the shares of different factors, and as net national expenditure in a country in a year’s time. In practice, while estimating national income, any of these three definitions may be adopted, because the same national income would be derived, if different items were correctly included in the estimate.

Methods of Estimating National Income:

National Income is a measure of the economic performance of a nation. It can be estimated using three primary methods: Production Method, Income Method, and Expenditure Method. All three aim to calculate the same value from different angles—output, income, and spending.

1. Expenditure Method of Estimating National Income

The Expenditure Method measures national income by calculating the total expenditure incurred on final goods and services produced within the domestic territory of a country during an accounting year. It reflects the demand side of the economy and is commonly used to calculate Gross Domestic Product (GDP) at market prices.

Components of Expenditure Method:

The formula is:

GDP (MP) = C + I + G + (X−M)

Where:

  • C – Private Final Consumption Expenditure: Spending by households on goods and services (e.g., food, clothing, education, etc.).
  • I – Gross Domestic Capital Formation (Investment Expenditure): Includes investment in fixed capital (machinery, buildings) and inventory accumulation by businesses.
  • G – Government Final Consumption Expenditure: Spending by the government on goods and services such as defense, education, and health.
  • X – Exports of Goods and Services: Goods and services sold to foreigners.
  • M – Imports of Goods and Services: Goods and services bought from foreign countries. It is subtracted because it’s not part of domestic production.

Steps to Calculate National Income using Expenditure Method:

Step 1: Calculate Final Consumption Expenditure

This is the first and largest component of national expenditure. It includes the total amount spent by households and government on final goods and services.

  • Private Final Consumption Expenditure (PFCE): It covers all spending by households on goods like food, clothing, healthcare, and services like education and entertainment.
  • Government Final Consumption Expenditure (GFCE): This includes all spending by the government on goods and services such as salaries of public servants, defense services, and public health.

Only final expenditures are counted to avoid double counting. Intermediate consumption is excluded.

Step 2: Measure Gross Domestic Capital Formation (Investment Expenditure)

This includes all investments made by businesses and the government in the production process.

  • Gross Fixed Capital Formation: Investments in buildings, machinery, vehicles, and infrastructure.
  • Change in Inventories: Any change in stock of raw materials, semi-finished, and finished goods held by firms.

Together, these reflect the value added to the capital stock of the economy.

Step 3: Calculate Net Exports (Exports – Imports)

Net exports reflect the value of foreign trade in the economy.

  • Exports (X): Goods and services produced domestically and sold abroad.
  • Imports (M): Goods and services produced abroad and purchased domestically.

To ensure only domestic production is accounted for, imports are subtracted from exports. The result is:

Net Exports=X−M

If exports exceed imports, net exports will be positive and add to national income. If imports exceed exports, net exports will be negative and reduce national income.

Step 4: Add All the Components to Get GDP at Market Prices (GDPMP)

Now that we have all three key components—consumption (C), investment (I), and net exports (X – M)—along with government expenditure (G), we calculate GDP at Market Prices:

GDP at M.P =C+I+G+(X−M)

Where:

  • C = Private Final Consumption
  • I = Investment
  • G = Government Final Consumption
  • X = Exports
  • M = Imports

This represents the total market value of all final goods and services produced within the domestic territory during the year.

Step 5: Deduct Net Indirect Taxes to Get GDP at Factor Cost (GDPFC)

GDP at market prices includes indirect taxes like GST and excise duties, which are not part of factor incomes. We deduct Net Indirect Taxes (NIT) to convert GDPMP into GDP at Factor Cost (GDPFC).

Step 6: Add Net Factor Income from Abroad (NFIA) to Get National Income

The final step involves adjusting for international income flows. We add Net Factor Income from Abroad (NFIA) to GDP at factor cost to get National Income or Net National Product at Factor Cost (NNPFC).

2. Income Received Approach (Income Method)

The Income Method of estimating national income focuses on calculating the total income earned by the factors of production (land, labor, capital, and entrepreneurship) in the production of goods and services within a country during an accounting year. It emphasizes the distribution side of national income rather than the production or expenditure side.

Basic Principle of Income Received Approach:

National income is the sum of all factor incomes earned in the form of:

  • Wages (for labor)
  • Rent (for land)
  • Interest (for capital)
  • Profits (for entrepreneurship)
  • Mixed incomes (for self-employed individuals)

Components of the Income Method:

The national income using the income method includes the following key components:

1. Compensation of Employees (Wages and Salaries)

  • Includes all forms of remuneration paid to labor.
  • Covers wages, salaries, bonuses, pensions, and employer’s contributions to social security.

2. Rent

  • Income earned from the use of land or property.
  • Includes actual rent and imputed rent of owner-occupied houses.

3. Interest

  • Income earned by capital as a factor of production.
  • Includes interest on loans used for production, but excludes interest on government bonds (transfer payment).

4. Profits

Income earned by entrepreneurs for taking business risks.

Includes:

  • Dividends,
  • Undistributed profits,
  • Corporate taxes.

5. Mixed Income of Self-employed

    • Many self-employed individuals perform multiple roles—capital owner, laborer, and entrepreneur—so their income is termed as “mixed income.”

6. Net Factor Income from Abroad (NFIA)

This is the difference between income earned by residents from abroad and income earned by foreigners in the domestic territory.

Formula for National Income (NNP at Factor Cost)

National Income =Wages + Rent + Interest + Profits + Mixed Income + NFIA

Steps to Estimate National Income by Income Method

Step 1. Identify all productive enterprises and institutions in the economy.

Step 2. Classify factor incomes paid by these entities—wages, rent, interest, profit, and mixed income.

Step 3. Exclude all non-production-related incomes such as:

  • Transfer payments (pensions, subsidies),
  • Windfall gains (lottery, capital gains),
  • Illegal incomes (black money),
  • Intermediate incomes.

Step 4. Add Net Factor Income from Abroad to include international income flows.

Step 5. The resulting figure is the Net National Product at Factor Cost (NNPFC)—which represents national income.

Advantages of Income Method:

  • Gives a clear understanding of income distribution among different sectors.

  • Useful for tax policy, wage regulation, and economic planning.

  • Helps in identifying the contribution of labor, capital, and entrepreneurship in GDP.

Limitations of Income Method:

  • Requires accurate and detailed income data, which is often difficult to collect.

  • Mixed income can be hard to classify accurately.

  • Incomes earned in the informal sector may be underreported or unrecorded.

3. Production Method of Estimating National Income

The Production Method, also called the Output Method or Value-Added Method, measures national income by calculating the total value of goods and services produced in the economy over a given period, usually one year. It is based on the principle of value addition at each stage of production.

Basic Principle of Production Method of Estimating National Income

This method calculates national income as the sum total of net value added at each stage in the production process across all sectors of the economy. The approach avoids double counting by subtracting the value of intermediate goods used during production.

Steps in the Production Method:

Step 1: Identify and Classify Productive Sectors

The economy is divided into three main sectors:

  • Primary Sector – Agriculture, forestry, fishing, mining.

  • Secondary Sector – Manufacturing, construction.

  • Tertiary Sector – Services like banking, transport, communication, education, health.

All productive enterprises in these sectors are included.

Step 2: Calculate Gross Value of Output (GVO)

For each enterprise or sector, calculate the total market value of output (goods and services) produced during the year:

GVO = Quantity of output × Market Price

Step 3: Subtract Intermediate Consumption to Find Gross Value Added (GVA)

To avoid double counting, subtract the value of intermediate goods and services used in production:

GVA = Gross Value of Output (GVO) − Intermediate Consumption

This step yields the Net Value Added by each firm or sector.

Step 4: Sum Up the GVA of All Sectors

Add the GVA from all sectors and industries to find the Gross Domestic Product at Market Price (GDPMP):

Step 5: Deduct Net Indirect Taxes to Find GDP at Factor Cost

GDPMP includes indirect taxes (like GST) and excludes subsidies. To arrive at GDP at Factor Cost (GDPFC):

GDP = GDP − Net Indirect Taxes

Where:

  • Net Indirect Taxes = Indirect Taxes – Subsidies

Step 6: Add Net Factor Income from Abroad to Find National Income

To convert Domestic Product into National Product, add Net Factor Income from Abroad (NFIA):

NNP = GDP + NFIA

This gives the Net National Product at Factor Cost, which is National Income.

Precautions While Using Production Method:

  • Avoid Double Counting: Only the value added at each stage should be considered, not the total value of output.

  • Exclude Non-productive Activities: Transfer payments, illegal activities, or purely financial transactions should not be included.

  • Consider Only Final Goods: Intermediate goods should be subtracted to ensure accuracy.

  • Include Imputed Values: Include estimated values like rent of owner-occupied houses and goods produced for self-consumption.

Advantages of Production Method:

  • Directly measures productive capacity and sectoral contribution.

  • Useful for identifying which sectors drive economic growth.

  • Helps in analyzing industrial structure and development.

Limitations of Production Method:

  • Difficult to get accurate data, especially from unorganized or informal sectors.

  • Challenges in estimating self-consumed goods or home-produced services.

  • Excludes non-market transactions which may be economically significant.

4. Value Added or Net Product Method

The Value Added Method, also known as the Net Product Method or Production Method, estimates national income by measuring the net contribution of each producing unit or sector in the economy. It is called the “value added” method because it focuses on the additional value created at each stage of the production process.

Steps in Calculating National Income Using the Value Added Method:

Step 1. Classification of Sectors

The economy is divided into three production sectors:

  • Primary Sector: Agriculture, fishing, mining, etc.
  • Secondary Sector: Manufacturing, construction, etc.
  • Tertiary Sector: Services like banking, trade, transport, etc.

Each sector contributes a portion of the total national income.

Step 2. Estimate Gross Value of Output (GVO)

For each enterprise or sector, compute the value of total production:

Gross Value of Output = Quantity Produced × Price

Step 3. Deduct Intermediate Consumption

Intermediate goods used in production are subtracted to find Gross Value Added (GVA):

GVA=Gross Value of Output−Intermediate Consumption

Step 4. Add Gross Value Added Across Sectors

Total Gross Value Added (GVA) from all sectors gives Gross Domestic Product at Market Price (GDPMP).

Step 5. Adjust for Taxes and Subsidies

To derive Gross Domestic Product at Factor Cost (GDPFC):

GDPFC=GDPMP−Net Indirect Taxes

Where:

Net Indirect Taxes = Indirect Taxes – Subsidies

Step 6. Add Net Factor Income from Abroad (NFIA)

To convert domestic product into national product, we add:

National Income (NNPFC) = GDP + Net Factor Income from Abroad

This yields the Net National Product at Factor Cost, which is the national income.

Advantages of Value Added Method:

  • Prevents double counting by focusing on net contributions.
  • Helps determine sector-wise contributions to the economy.
  • Useful for productivity analysis.

Precautions in Using This Method:

  • Include only productive activities (exclude transfers, illegal income).
  • Use imputed values where actual data isn’t available (e.g., rent of owner-occupied houses).
  • Exclude the value of intermediate goods.
  • Accurate data collection is essential, especially from informal sectors.

Concepts of National Income

There are a number of concepts pertaining to national income and methods of measurement relating to them.

(i) Gross National Product (GNP)

GNP is the total measure of the flow of goods and services at market value resulting from current production during a year in a country, including net income from abroad.

GNP includes four types of final goods and services:

Consumers’ goods and services to satisfy the immediate wants of the people;

Gross private domestic investment in capital goods consisting of fixed capital formation, residential construction and inventories of finished and unfinished goods;

Goods and services produced by the government; and

Net exports of goods and services, i.e., the difference between value of exports and imports of goods and services, known as net income from abroad.

(ii) Gross Domestic Product (GDP)

GDP is the total value of goods and services produced within the country during a year. This is calculated at market prices and is known as GDP at market prices. Dernberg defines GDP at market price as “the market value of the output of final goods and services produced in the domestic territory of a country during an accounting year.”

(iii) Nominal and Real GDP

When GDP is measured on the basis of current price, it is called GDP at current prices or nominal GDP. On the other hand, when GDP is calculated on the basis of fixed prices in some year, it is called GDP at constant prices or real GDP.

Nominal GDP is the value of goods and services produced in a year and measured in terms of rupees (money) at current (market) prices. In comparing one year with another, we are faced with the problem that the rupee is not a stable measure of purchasing power. GDP may rise a great deal in a year, not because the economy has been growing rapidly but because of rise in prices (or inflation).

On the contrary, GDP may increase as a result of fall in prices in a year but actually it may be less as compared to the last year. In both 5 cases, GDP does not show the real state of the economy. To rectify the underestimation and overestimation of GDP, we need a measure that adjusts for rising and falling prices.

This can be done by measuring GDP at constant prices which is called real GDP. To find out the real GDP, a base year is chosen when the general price level is normal, i.e., it is neither too high nor too low. The prices are set to 100 (or 1) in the base year.

(iv) GDP Deflator

GDP deflator is an index of price changes of goods and services included in GDP. It is a price index which is calculated by dividing the nominal GDP in a given year by the real GDP for the same year and multiplying it by 100.

(v) GDP at Factor Cost

GDP at factor cost is the sum of net value added by all producers within the country. Since the net value added gets distributed as income to the owners of factors of production, GDP is the sum of domestic factor incomes and fixed capital consumption (or depreciation).

Thus GDP at Factor Cost = Net value added + Depreciation.

GDP at factor cost includes:

Compensation of employees i.e., wages, salaries, etc.

Operating surplus which is the business profit of both incorporated and unincorporated firms. [Operating Surplus = Gross Value Added at Factor Cost—Compensation of Employees—Depreciation]

Mixed Income of Self- employed

Conceptually, GDP at factor cost and GDP at market price must be identical/This is because the factor cost (payments to factors) of producing goods must equal the final value of goods and services at market prices. However, the market value of goods and services is different from the earnings of the factors of production.

In GDP at market price are included indirect taxes and are excluded subsidies by the government. Therefore, in order to arrive at GDP at factor cost, indirect taxes are subtracted and subsidies are added to GDP at market price.

Thus, GDP at Factor Cost = GDP at Market Price – Indirect Taxes + Subsidies.

(vi) Net Domestic Product (NDP)

NDP is the value of net output of the economy during the year. Some of the country’s capital equipment wears out or becomes obsolete each year during the production process. The value of this capital consumption is some percentage of gross investment which is deducted from GDP. Thus Net Domestic Product = GDP at Factor Cost – Depreciation.

(vii) GNP at Factor Cost

GNP at factor cost is the sum of the money value of the income produced by and accruing to the various factors of production in one year in a country. It includes all items mentioned above under income method to GNP less indirect taxes.

GNP at market prices always includes indirect taxes levied by the government on goods which raise their prices. But GNP at factor cost is the income which the factors of production receive in return for their services alone. It is the cost of production.

Thus GNP at market prices is always higher than GNP at factor cost. Therefore, in order to arrive at GNP at factor cost, we deduct indirect taxes from GNP at market prices. Again, it often happens that the cost of production of a commodity to the producer is higher than a price of a similar commodity in the market.

In order to protect such producers, the government helps them by granting monetary help in the form of a subsidy equal to the difference between the market price and the cost of production of the commodity. As a result, the price of the commodity to the producer is reduced and equals the market price of similar commodity.

For example if the market price of rice is Rs. 3 per kg but it costs the producers in certain areas Rs. 3.50. The government gives a subsidy of 50 paisa per kg to them in order to meet their cost of production. Thus in order to arrive at GNP at factor cost, subsidies are added to GNP at market prices.

GNP at Factor Cost = GNP at Market Prices – Indirect Taxes + Subsidies.

(viii) GNP at Market Prices

When we multiply the total output produced in one year by their market prices prevalent during that year in a country, we get the Gross National Product at market prices. Thus GNP at market prices means the gross value of final goods and services produced annually in a country plus net income from abroad. It includes the gross value of output of all items from (1) to (4) mentioned under GNP. GNP at Market Prices = GDP at Market Prices + Net Income from Abroad.

(xi) Net National Product (NNP)

NNP includes the value of total output of consumption goods and investment goods. But the process of production uses up a certain amount of fixed capital. Some fixed equipment wears out, its other components are damaged or destroyed, and still others are rendered obsolete through technological changes.

All this process is termed depreciation or capital consumption allowance. In order to arrive at NNP, we deduct depreciation from GNP. The word ‘net’ refers to the exclusion of that part of total output which represents depreciation. So NNP = GNP—Depreciation.

(x) NNP at Factor Cost

Net National Product at factor cost is the net output evaluated at factor prices. It includes income earned by factors of production through participation in the production process such as wages and salaries, rents, profits, etc. It is also called National Income. This measure differs from NNP at market prices in that indirect taxes are deducted and subsidies are added to NNP at market prices in order to arrive at NNP at factor cost. Thus

NNP at Factor Cost = NNP at Market Prices – Indirect taxes+ Subsidies

= GNP at Market Prices – Depreciation – Indirect taxes + Subsidies.

= National Income.

Normally, NNP at market prices is higher than NNP at factor cost because indirect taxes exceed government subsidies. However, NNP at market prices can be less than NNP at factor cost when government subsidies exceed indirect taxes.

(xi) NNP at Market Prices

Net National Product at market prices is the net value of final goods and services evaluated at market prices in the course of one year in a country. If we deduct depreciation from GNP at market prices, we get NNP at market prices. So NNP at Market Prices = GNP at Market Prices—Depreciation.

(xii) Domestic Income

Income generated (or earned) by factors of production within the country from its own resources is called domestic income or domestic product.

Domestic income includes:

  • Wages and salaries
  • Rents, including imputed house rents
  • Interest
  • Dividends
  • Undistributed corporate profits, including surpluses of public undertakings
  • Mixed incomes consisting of profits of unincorporated firms, self- employed persons, partnerships, etc., and
  • Direct taxes

Since domestic income does not include income earned from abroad, it can also be shown as: Domestic Income = National Income-Net income earned from abroad. Thus the difference between domestic income f and national income is the net income earned from abroad. If we add net income from abroad to domestic income, we get national income, i.e., National Income = Domestic Income + Net income earned from abroad.

But the net national income earned from abroad may be positive or negative. If exports exceed import, net income earned from abroad is positive. In this case, national income is greater than domestic income. On the other hand, when imports exceed exports, net income earned from abroad is negative and domestic income is greater than national income.

(xiii) Personal Income

Personal income is the total income received by the individuals of a country from all sources before payment of direct taxes in one year. Personal income is never equal to the national income, because the former includes the transfer payments whereas they are not included in national income.

Personal income is derived from national income by deducting undistributed corporate profits, profit taxes, and employees’ contributions to social security schemes. These three components are excluded from national income because they do reach individuals.

But business and government transfer payments, and transfer payments from abroad in the form of gifts and remittances, windfall gains, and interest on public debt which are a source of income for individuals are added to national income. Thus Personal Income = National Income – Undistributed Corporate Profits – Profit Taxes – Social Security Contribution + Transfer Payments + Interest on Public Debt.

Personal income differs from private income in that it is less than the latter because it excludes undistributed corporate profits.

Thus Personal Income = Private Income – Undistributed Corporate Profits – Profit Taxes.

 (xiv) Private Income

Private income is income obtained by private individuals from any source, productive or otherwise, and the retained income of corporations. It can be arrived at from NNP at Factor Cost by making certain additions and deductions.

The additions include transfer payments such as pensions, unemployment allowances, sickness and other social security benefits, gifts and remittances from abroad, windfall gains from lotteries or from horse racing, and interest on public debt. The deductions include income from government departments as well as surpluses from public undertakings, and employees’ contribution to social security schemes like provident funds, life insurance, etc.

Thus Private Income = National Income (or NNP at Factor Cost) + Transfer Payments + Interest on Public Debt — Social Security — Profits and Surpluses of Public Undertakings.

(xv) Disposable Income

Disposable income or personal disposable income means the actual income which can be spent on consumption by individuals and families. The whole of the personal income cannot be spent on consumption, because it is the income that accrues before direct taxes have actually been paid. Therefore, in order to obtain disposable income, direct taxes are deducted from personal income. Thus Disposable Income=Personal Income – Direct Taxes.

But the whole of disposable income is not spent on consumption and a part of it is saved. Therefore, disposable income is divided into consumption expenditure and savings. Thus Disposable Income = Consumption Expenditure + Savings.

If disposable income is to be deduced from national income, we deduct indirect taxes plus subsidies, direct taxes on personal and on business, social security payments, undistributed corporate profits or business savings from it and add transfer payments and net income from abroad to it.

Thus Disposable Income = National Income – Business Savings – Indirect Taxes + Subsidies – Direct Taxes on Persons – Direct Taxes on Business – Social Security Payments + Transfer Payments + Net Income from abroad.

(xvi) Per Capita Income

The average income of the people of a country in a particular year is called Per Capita Income for that year. This concept also refers to the measurement of income at current prices and at constant prices. For instance, in order to find out the per capita income for 2001, at current prices, the national income of a country is divided by the population of the country in that year.

(xvii) Real Income

Real income is national income expressed in terms of a general level of prices of a particular year taken as base. National income is the value of goods and services produced as expressed in terms of money at current prices. But it does not indicate the real state of the economy.

It is possible that the net national product of goods and services this year might have been less than that of the last year, but owing to an increase in prices, NNP might be higher this year. On the contrary, it is also possible that NNP might have increased but the price level might have fallen, as a result national income would appear to be less than that of the last year. In both the situations, the national income does not depict the real state of the country. To rectify such a mistake, the concept of real income has been evolved.

In order to find out the real income of a country, a particular year is taken as the base year when the general price level is neither too high nor too low and the price level for that year is assumed to be 100. Now the general level of prices of the given year for which the national income (real) is to be determined is assessed in accordance with the prices of the base year. For this purpose the following formula is employed.

Real NNP = NNP for the Current Year x Base Year Index (=100) / Current Year Index

Suppose 1990-91 is the base year and the national income for 1999-2000 is Rs. 20,000 crores and the index number for this year is 250. Hence, Real National Income for 1999-2000 will be = 20000 x 100/250 = Rs. 8000 crores. This is also known as national income at constant prices.

Market Structure, Meaning, Elements, Factors influencing Market Structure

Market structure refers to the organizational and competitive characteristics of a market that influence the behavior and performance of the firms operating within it. It defines how businesses interact with each other, how prices are determined, and how easily new firms can enter or exit the market.

Elements or Determinants of Market Structure:

  • Number of Buyers and Sellers

The number of buyers and sellers in a market determines the degree of competition and price influence. In a perfectly competitive market, numerous sellers exist, none of which can individually influence price. In contrast, a monopoly has a single seller with complete price control. An oligopoly features a few dominant firms, often engaging in strategic pricing and product decisions. The greater the number of sellers, the more competitive the market becomes, leading to better choices and prices for consumers. On the buyer side, the presence of many buyers ensures demand diversity and minimizes buyer influence. If a few large buyers dominate (monopsony), they may exert significant control over prices and terms. Thus, the balance of buyers and sellers shapes the market’s competitive nature.

  • Nature of the Product

The type of product offered—whether homogeneous or differentiated—significantly influences market structure. In perfect competition, products are identical (e.g., wheat, salt), leaving firms with no control over pricing. In monopolistic competition, products are similar but differentiated by branding, quality, or features (e.g., clothing brands), allowing some pricing power. In oligopoly, products may be either homogeneous (e.g., cement) or differentiated (e.g., automobiles), and product features become strategic tools for competition. In a monopoly, the firm offers a unique product with no close substitutes, granting it full pricing authority. Product nature affects customer loyalty, elasticity of demand, and marketing strategies. The greater the product differentiation, the more power a firm has to set prices and influence consumer choices.

  • Degree of Price Control

Price control refers to the extent to which a firm can influence the price of its product. In perfect competition, firms are price takers—they accept market-determined prices due to intense competition and identical products. In monopolistic competition, firms have limited pricing power due to brand loyalty and differentiation. In oligopolies, firms have considerable price control, but often follow price leadership or engage in collusive pricing to avoid price wars. A monopolist, on the other hand, is a price maker, setting prices to maximize profits, although constrained by consumer demand and potential regulation. The degree of price control depends on factors like product uniqueness, market entry barriers, and consumer sensitivity. Understanding price control helps assess market power and the potential for consumer exploitation or competitive pricing.

  • Entry and Exit Barriers

Ease of market entry and exit is a key element of market structure, affecting the level of competition and innovation. In perfect competition, there are no barriers, allowing new firms to enter freely and keep profits in check. In monopolistic competition, entry is relatively easy, though branding may pose minor challenges. In oligopoly, high entry barriers such as heavy capital investment, economies of scale, and control over distribution prevent new competitors from entering. In a monopoly, barriers are the highest, often due to patents, government licenses, or ownership of key resources. These barriers protect existing firms from competition, allowing them to maintain profits and influence. Lower entry and exit barriers promote market dynamism, while higher barriers can lead to reduced competition, higher prices, and consumer disadvantage.

Factors influencing Market Structure:

  • Number of Firms in the Market

The number of firms determines the level of competition in a market. A large number of firms typically results in a competitive structure like perfect or monopolistic competition, where no single firm dominates. Fewer firms may lead to oligopoly or monopoly, where market power is concentrated. The higher the number of firms, the less control each has over pricing and supply. This factor directly affects how freely new businesses can enter the market, influence prices, and affect consumer choices, shaping the overall structure and nature of business rivalry.

  • Nature of the Product

The similarity or differentiation of products significantly impacts market structure. Homogeneous products, such as grains or steel, lead to perfect competition, where firms compete solely on price. Differentiated products, like branded clothing or electronics, result in monopolistic competition or oligopoly, where firms gain some price control through branding and features. A unique product with no substitutes, as seen in a monopoly, gives complete pricing power to the firm. The more distinct the product, the higher the potential for firms to establish loyal customer bases and exercise market influence.

  • Control Over Prices

The degree of control firms have over pricing determines their influence in the market. In perfect competition, firms are price takers—they cannot alter prices due to intense rivalry. In monopoly, a firm is a price maker, controlling prices due to a lack of substitutes. Oligopolistic firms have considerable price-setting power but often avoid price wars through collusion or tacit agreements. Price control is shaped by product uniqueness, brand value, and the availability of alternatives. More price control indicates less competition and a more concentrated market structure.

  • Barriers to Entry and Exit

Barriers affect how easily new firms can enter or leave a market. Low barriers promote competition, as seen in perfect and monopolistic competition. High barriers, like legal restrictions, high startup costs, and access to technology, protect established firms in oligopolies and monopolies, reducing competition. These barriers determine market dynamics, profitability, and innovation levels. The ease or difficulty of entering the market shapes the competitive intensity, and hence, the overall market structure. Exit barriers, such as long-term contracts or sunk costs, also influence firms’ decisions and market fluidity.

  • Economies of Scale

When firms grow large enough to lower average costs through mass production, they experience economies of scale. This factor influences market structure by favoring oligopolies and monopolies, where large firms dominate due to cost advantages. Smaller firms find it difficult to compete, leading to a concentrated market. The presence of economies of scale raises entry barriers, discouraging new entrants and reducing competition. Industries like telecom, aviation, and energy often display this trait. This factor strengthens the position of existing firms and shapes the strategic behavior in the industry.

  • Level of Innovation and Technology

High levels of innovation and advanced technology can significantly affect market structure. In tech-driven industries, early adopters often gain a temporary monopoly due to patents, proprietary processes, or first-mover advantages. Rapid innovation can reduce entry barriers if technology is widely accessible, but may also create new barriers when it involves complex, capital-intensive processes. Innovation leads to product differentiation, changing competitive dynamics and often shifting markets from monopolistic to oligopolistic forms. It influences firm growth, pricing strategies, and the overall shape of market competition.

  • Government Policies and Regulations

Government intervention through licensing, tariffs, price controls, and antitrust laws significantly influences market structure. Policies that encourage free trade and deregulation promote competition, while those granting monopoly rights or subsidies can limit it. Regulatory frameworks may either lower or raise entry barriers, depending on their objectives. For instance, strict patent laws can create monopolies, while competition laws may break up large firms. These rules impact pricing, market access, and competitive fairness, playing a crucial role in shaping the structure and efficiency of different markets.

The features of market structures are shown in Table 1.

Important features of market structure:

  • Number and Size of Buyers and Sellers

The number and relative size of buyers and sellers directly influence the nature of competition in a market. In perfect competition, there are many small buyers and sellers, so no single entity can influence the price. In contrast, monopoly features one large seller dominating the entire market. Oligopoly has few large sellers, while monopolistic competition has many sellers offering differentiated products. The balance of power between buyers and sellers determines price-setting behavior, market entry, and overall market dynamics.

  • Nature of the Product

Products can be homogeneous (identical) or differentiated. Homogeneous goods (e.g., wheat, sugar) are typical of perfect competition, where consumers have no preference between suppliers. Differentiated products (e.g., smartphones, clothing) are associated with monopolistic competition or oligopoly, where branding and features give firms some pricing power. In monopoly, the product is unique with no close substitutes. The product’s nature shapes consumer choice, pricing strategy, and firm competitiveness, making it a key feature in defining the structure of a market.

  • Degree of Price Control

Price control refers to how much influence firms have over the price of their products. In perfect competition, firms are price takers, accepting market-determined prices. In contrast, monopolies are price makers, having full control due to lack of substitutes. Oligopolies have partial control and often avoid price wars through mutual understanding. Monopolistic competitors can influence prices slightly due to product differentiation. The ability to control prices affects profitability, strategic planning, and the level of consumer surplus in different market structures.

  • Entry and Exit Conditions

The ease with which firms can enter or exit the market impacts the level of competition. Free entry and exit, seen in perfect and monopolistic competition, keeps profits normal in the long run. High entry barriers in monopoly and oligopoly markets, such as large capital requirements, patents, and government regulations, protect existing firms from new competitors. These conditions influence firm behavior, investment decisions, and the long-term structure of the industry. Exit barriers also matter, including sunk costs and contractual obligations.

  • Flow of Information

Market transparency, or the availability of information, significantly impacts decision-making. In perfect competition, information is perfect and freely available to all participants, ensuring rational decisions and uniform prices. In monopoly, oligopoly, or monopolistic competition, information may be asymmetric—some firms have better access to market data, customer preferences, or production techniques. Information asymmetry leads to inefficiencies, mispricing, and poor resource allocation. The better the information flow, the more efficient and competitive the market structure becomes.

  • Interdependence Among Firms

In oligopoly, firms are highly interdependent; the actions of one firm significantly impact others. For example, a price cut by one may trigger retaliatory pricing. In monopoly and perfect competition, interdependence is minimal—monopolies face no rivals, and perfect competitors are too small to affect market outcomes. Monopolistic competition lies in between, with firms competing based on product features. This interdependence influences strategic behavior, including pricing, advertising, and innovation, and it makes game theory and collusion relevant in oligopolistic settings.

  • Government Regulation and Legal Framework

Government rules and policies shape the nature and behavior of market structures. Antitrust laws, price controls, trade regulations, and licensing influence how freely firms can operate, compete, or dominate. Monopolies may be state-sanctioned, while competitive markets are supported by policies promoting transparency and consumer rights. Legal restrictions may also create barriers to entry, affecting the long-term dynamics of the industry. In regulated markets, government action balances business interests with consumer welfare, playing a crucial role in defining market behavior and structure.

  • Profit Margins and Cost Efficiency

The structure of a market significantly impacts potential profit margins and cost structures. Perfect competition leads to minimal profit margins due to intense competition and price pressure. In contrast, monopolies enjoy higher profit margins due to price-setting power and absence of competition. Oligopolistic firms also enjoy significant profits through collusion or differentiated services. Monopolistic competitors rely on brand value to maintain margins. Additionally, cost efficiency varies—larger firms may benefit from economies of scale, leading to lower average costs and higher profitability in certain structures.

Types of market structure:

1. Perfect Competition

Perfect competition is an idealized market structure where a large number of small firms sell identical products. No single firm can influence the price, making them price takers. The product is homogeneous, and all buyers and sellers have perfect knowledge. Entry and exit are completely free, and there is no government intervention. Examples include agricultural markets like wheat or rice, where products are uniform and pricing is dictated by market forces. Long-run profits tend toward normal, and efficiency is maximized.

2. Monopoly

A monopoly exists when a single firm dominates the entire market with no close substitutes for its product. The firm is a price maker, meaning it has full control over the price. High entry barriers such as patents, licenses, large capital requirements, or government protection prevent other firms from entering. Consumers have limited choices, and the monopolist maximizes profit by producing where marginal cost equals marginal revenue. Examples include utilities like electricity and water supply in many regions.

3. Monopolistic Competition

This structure features many sellers offering similar but differentiated products. Firms have some price-setting power due to brand identity, quality, packaging, or advertising. Entry and exit are relatively easy, and information is fairly well distributed among buyers and sellers. This market is common in retail sectors like clothing, restaurants, or consumer electronics, where consumers perceive differences in brands even if the underlying product is similar. Firms compete on both price and non-price factors like style, location, and service.

4. Oligopoly

In an oligopoly, a few large firms dominate the market. Products may be homogeneous (e.g., steel, cement) or differentiated (e.g., cars, smartphones). Firms are interdependent and often respond to each other’s actions—especially regarding pricing and output. Barriers to entry are high, which keeps competition limited. Pricing may be rigid due to fear of price wars. Strategic planning and collusion (formal or informal) are common. Real-world examples include the airline industry, telecom sector, and automobile manufacturing.

Production, Meaning, Factors of Production, Production Function, Features, Types

Production is a fundamental economic activity that involves transforming inputs into outputs to satisfy human wants and needs. It refers to the creation of utility by converting raw materials, natural resources, and various inputs such as labor and capital into finished goods or services. The term “production” is not confined only to manufacturing physical products but also includes the provision of services like healthcare, education, transportation, and banking.

In economics, production is defined as any activity that results in the generation of value. It adds utility in terms of form (changing the shape or structure of goods), place (making goods available where they are needed), and time (making goods available when they are required). For instance, converting cotton into fabric or providing consultancy services both fall under the scope of production.

Production plays a central role in the functioning of any economy. It is the backbone of economic development, as it creates goods and services, generates income, provides employment, and contributes to the GDP. The process involves the effective combination and utilization of the four factors of production—land, labor, capital, and entrepreneurship.

Efficient production ensures cost-effectiveness, quality output, and customer satisfaction. In a competitive business environment, firms continuously seek to improve their production processes through innovation and technology. Thus, production is not merely a technical activity but also a strategic function that directly influences business performance and market success.

Factors of Production:

  • Land

Land refers to all natural resources used in the creation of goods and services. This includes physical land, forests, minerals, water, and other gifts of nature. It is a passive factor but essential, as it provides the base for agriculture, manufacturing, and infrastructure. The availability and productivity of land influence industrial location and output. It is fixed in supply and subject to diminishing returns if overused without improvement or technological intervention.

  • Labour

Labor represents the human effort—both physical and mental—used in production. It includes the work of employees, professionals, and skilled or unskilled workers. The productivity of labor depends on education, health, skills, motivation, and working conditions. Labor is an active factor that contributes directly to the creation of goods and services. Effective labor management and training programs can enhance output, efficiency, and innovation, making labor a critical resource in competitive business environments.

  • Capital

Capital comprises man-made resources such as tools, machinery, buildings, and technology used to produce other goods and services. It differs from money, as capital refers specifically to physical assets that facilitate production. Capital improves labor productivity and production efficiency. It can be categorized into fixed capital (long-term assets) and working capital (short-term inputs). Businesses must invest in and maintain capital assets to scale operations and stay technologically competitive in dynamic markets.

  • Entrepreneurship

Entrepreneurship is the ability to identify opportunities, organize resources, take risks, and innovate. Entrepreneurs combine land, labor, and capital to initiate and manage production activities. They are the decision-makers who determine what, how, and for whom to produce. Successful entrepreneurs drive innovation, generate employment, and stimulate economic growth. Their risk-taking ability and vision are essential for launching new ventures and sustaining businesses in a changing economic landscape.

  • Human Capital

Human capital refers to the knowledge, skills, experience, and competencies possessed by individuals. Unlike labor, which measures effort, human capital emphasizes quality and expertise. Investment in education, training, and healthcare improves human capital, leading to higher productivity and innovation. In knowledge-driven economies, human capital is crucial for sectors like IT, R&D, and services. Businesses that cultivate strong human capital gain a strategic advantage through creativity, efficiency, and decision-making capabilities.

  • Information and Knowledge

Information and knowledge have become key production factors in the digital era. Access to market data, consumer insights, and industry trends enables firms to make informed decisions and respond to changes swiftly. Knowledge fuels innovation, strategy, and process improvement. Companies use data analytics and research to optimize supply chains, target customers, and reduce risks. In the modern economy, intangible assets like intellectual property and brand reputation also derive from valuable information.

  • Time

Time, though often overlooked, is a vital factor of production. It affects productivity, cost-efficiency, and market responsiveness. Timely decision-making, project execution, and delivery influence customer satisfaction and profitability. Time also determines the depreciation of assets and the lifecycle of products. Efficient time management leads to leaner operations and better resource utilization. In fast-moving markets, the ability to act quickly on opportunities is a decisive competitive advantage.

  • Technology

Technology enhances all other factors of production by increasing efficiency, reducing costs, and enabling innovation. It transforms traditional processes into automated, scalable, and intelligent systems. For instance, AI, robotics, and cloud computing streamline manufacturing, logistics, and customer service. Technology reduces reliance on physical labor and optimizes capital usage. In modern business strategy, adopting and upgrading technology is not optional—it is essential for survival, growth, and staying ahead in competitive markets.

Production Function:

Production Function is an economic concept that describes the relationship between the inputs used in production and the resulting output. It shows how different combinations of labor, capital, and other factors of production contribute to the production of goods or services. The production function helps in understanding the efficiency of resource utilization, and how changes in the quantity of inputs affect the level of output. It is often expressed as an equation or graph, representing the technological relationship in production.

Mathematically, such a basic relationship between inputs and outputs may be expressed as:

Q = f( L, C, N )

Where

Q = Quantity of output

L = Labour

C = Capital

N = Land.

Hence, the level of output (Q), depends on the quantities of different inputs (L, C, N) available to the firm. In the simplest case, where there are only two inputs, labour (L) and capital (C) and one output (Q), the production function becomes.

Q = f(L, C)

“The production function is a technical or engineering relation between input and output. As long as the natural laws of technology remain unchanged, the production function remains unchanged.” Prof. L.R. Klein

“Production function is the relationship between inputs of productive services per unit of time and outputs of product per unit of time.” Prof. George J. Stigler

“The relationship between inputs and outputs is summarized in what is called the production function. This is a technological relation showing for a given state of technological knowledge how much can be produced with given amounts of inputs.” Prof. Richard J. Lipsey

Thus, from the above definitions, we can conclude that production function shows for a given state of technological knowledge, the relation between physical quantities of inputs and outputs achieved per period of time.

Features of Production Function:

Following are the main features of production function:

1. Substitutability

The factors of production or inputs are substitutes of one another which make it possible to vary the total output by changing the quantity of one or a few inputs, while the quantities of all other inputs are held constant. It is the substitutability of the factors of production that gives rise to the laws of variable proportions.

2. Complementarity

The factors of production are also complementary to one another, that is, the two or more inputs are to be used together as nothing will be produced if the quantity of either of the inputs used in the production process is zero.

The principles of returns to scale is another manifestation of complementarity of inputs as it reveals that the quantity of all inputs are to be increased simultaneously in order to attain a higher scale of total output.

3. Specificity

It reveals that the inputs are specific to the production of a particular product. Machines and equipment’s, specialized workers and raw materials are a few examples of the specificity of factors of production. The specificity may not be complete as factors may be used for production of other commodities too. This reveals that in the production process none of the factors can be ignored and in some cases ignorance to even slightest extent is not possible if the factors are perfectly specific.

Production involves time; hence, the way the inputs are combined is determined to a large extent by the time period under consideration. The greater the time period, the greater the freedom the producer has to vary the quantities of various inputs used in the production process.

In the production function, variation in total output by varying the quantities of all inputs is possible only in the long run whereas the variation in total output by varying the quantity of single input may be possible even in the short run.

Time Period and Production Functions

The production function is differently defined in the short run and in the long run. This distinction is extremely relevant in microeconomics. The distinction is based on the nature of factor inputs.

Those inputs that vary directly with the output are called variable factors. These are the factors that can be changed. Variable factors exist in both, the short run and the long run. Examples of variable factors include daily-wage labour, raw materials, etc.

On the other hand, those factors that cannot be varied or changed as the output changes are called fixed factors. These factors are normally characteristic of the short run or short period of time only. Fixed factors do not exist in the long run.

Consequently, we can define two production functions: short-run and long-run. The short-run production function defines the relationship between one variable factor (keeping all other factors fixed) and the output. The law of returns to a factor explains such a production function.

For example, consider that a firm has 20 units of labour and 6 acres of land and it initially uses one unit of labour only (variable factor) on its land (fixed factor). So, the land-labour ratio is 6:1. Now, if the firm chooses to employ 2 units of labour, then the land-labour ratio becomes 3:1 (6:2).

The long-run production function is different in concept from the short run production function. Here, all factors are varied in the same proportion. The law that is used to explain this is called the law of returns to scale. It measures by how much proportion the output changes when inputs are changed proportionately.

Types of Production Function:

1. Short-Run Production Function

In the short run, at least one input is fixed (usually capital), while other inputs (like labor) are variable. The short-run production function examines how changes in variable inputs affect output, keeping the fixed input constant.

Key Features:

  • Focuses on the law of variable proportions (diminishing marginal returns).
  • Output increases initially at an increasing rate, then at a decreasing rate, and eventually may decline.

Example:

A factory with fixed machinery (capital) adds more workers (labor). Initially, productivity increases, but as workers crowd the factory, additional output diminishes.

2. Long-Run Production Function

In the long run, all inputs are variable, allowing firms to adjust labor, capital, and other resources fully. The long-run production function focuses on the optimal combination of inputs to achieve maximum efficiency and output.

Key Features:

  • Examines returns to scale:
    • Increasing Returns to Scale: Doubling inputs results in more than double the output.
    • Constant Returns to Scale: Doubling inputs results in a proportional doubling of output.
    • Decreasing Returns to Scale: Doubling inputs results in less than double the output.
  • Useful for long-term planning and investment decisions.

3. Cobb-Douglas Production Function

A mathematical representation of the relationship between two or more inputs (e.g., labor and capital) and output. It is commonly expressed as:

Q = A*L^α*K^β*

Where:

  • Q: Total output
  • L: Labor input
  • K: Capital input
  • α,β: Elasticities of output with respect to labor and capital
  • A: Total factor productivity

Key Features:

  • Demonstrates the contribution of labor and capital to output.
  • Widely used in economics for empirical studies and forecasting.

4. Fixed Proportions Production Function (Leontief Production Function)

In this type, inputs are used in fixed proportions to produce output. Increasing one input without proportionately increasing the other does not lead to higher output.

Example:

A car requires one engine and four tires. Adding more engines without increasing the number of tires will not produce more cars.

5. Variable Proportions Production Function

Inputs can be substituted for one another in varying proportions while producing the same level of output.

Example:

A firm can use either more machines and less labor or more labor and fewer machines to produce the same output.

6. Isoquant Production Function

An isoquant represents all possible combinations of two inputs (e.g., labor and capital) that produce the same level of output. The isoquant approach analyzes how inputs can be substituted while maintaining output levels.

Key Features:

  • Focuses on input substitution.
  • Helps determine the least-cost combination of inputs for a given output.

Elasticity of Demand, Meaning, Types, Significance and price, income and cross elasticity

Elasticity of demand refers to the responsiveness or sensitivity of the quantity demanded of a good or service to changes in one of its determining factors, primarily its price, income of the consumer, or prices of related goods. In simpler terms, it measures how much the demand for a product changes when its price or other influencing factor changes.

The most common and widely used form is Price Elasticity of Demand (PED), which shows the extent to which the quantity demanded changes in response to a change in the price of the product. If a small change in price leads to a large change in quantity demanded, demand is said to be elastic. If a change in price results in little or no change in demand, it is inelastic.

Besides PED, there are other forms:

  • Income Elasticity of Demand (YED): Measures demand responsiveness to changes in consumer income.
  • Cross Elasticity of Demand (XED): Measures demand changes due to the price change of related goods (substitutes or complements).

Elasticity helps businesses make strategic decisions in pricing, marketing, taxation impact, and forecasting revenue. For instance, if a product is price elastic, lowering the price may increase total revenue. Conversely, if demand is inelastic, a firm can raise prices without a major drop in sales volume.

Understanding elasticity is crucial for firms, policymakers, and economists to predict consumer behavior and optimize resource allocation in response to changing economic variables.

Types of Elasticity:

Distinction may be made between Price Elasticity, Income Elasticity and Cross Elasticity. Price Elasticity is the responsiveness of demand to change in price; income elasticity means a change in demand in response to a change in the consumer’s income; and cross elasticity means a change in the demand for a commodity owing to change in the price of another commodity.

(a) Infinite or Perfect Elasticity of Demand

Let as first take one extreme case of elasticity of demand, viz., when it is infinite or perfect. Elasticity of demand is infinity when even a negligible fall in the price of the commodity leads to an infinite extension in the demand for it. In Fig. 1 the horizontal straight line DD’ shows infinite elasticity of demand. Even when the price remains the same, the demand goes on changing.

(b) Perfectly Inelastic Demand

The other extreme limit is when demand is perfectly inelastic. It means that howsoever great the rise or fall in the price of the commodity in question, its demand remains absolutely unchanged. In Fig. 2, the vertical line DD’ shows a perfectly inelastic demand. In other words, in this case elasticity of demand is zero. No amount of change in price induces a change in demand.

In the real world, there is no commodity the demand for which may be absolutely inelastic, i.e., changes in its price will fail to bring about any change at all in the demand for it. Some extension/contraction is bound to occur that is why economists say that elasticity of demand is a matter of degree only. In the same manner, there are few commodities in whose case the demand is perfectly elastic. Thus, in real life, the elasticity of demand of most goods and services lies between the two limits given above, viz., infinity and zero. Some have highly elastic demand while others have less elastic demand.

(c) Very Elastic Demand

Demand is said to be very elastic when even a small change in the price of a commodity leads to a considerable extension/con­traction of the amount demanded of it. In Fig. 3, DD’ curve illustrates such a demand. As a result of change of T in the price, the quantity demanded extends/contracts by MM’, which clearly is comparatively a large change in demand.

(d) Less Elastic Demand

When even a substantial change in price brings only a small extension/contraction in demand, it is said to be less elastic. In Fig. 4, DD’ shows less elastic demand. A fall of NN’ in price extends demand by MM’ only, which is very small.

Significance of Elasticity of Demand:

  • Determination of Output Level

For making production profitable, it is essential that the quantity of goods and services should be produced corresponding to the demand for that product. Since the changes in demand are due to the change in price, the knowledge of elasticity of demand is necessary for determining the output level.

  • Determination of Price

The elasticity of demand for a product is the basis of its price determination. The ratio in which the demand for a product will fall with the rise in its price and vice versa can be known with the knowledge of elasticity of demand.

If the demand for a product is inelastic, the producer can charge high price for it, whereas for an elastic demand product he will charge low price. Thus, the knowledge of elasticity of demand is essential for management in order to earn maximum profit.

  • Price Discrimination by Monopolist

Under monopoly discrimination the problem of pricing the same commodity in two different markets also depends on the elasticity of demand in each market. In the market with elastic demand for his commodity, the discriminating monopolist fixes a low price and in the market with less elastic demand, he charges a high price.

  • Price Determination of Factors of Production

The concept of elasticity for demand is of great importance for determining prices of various factors of production. Factors of production are paid according to their elasticity of demand. In other words, if the demand of a factor is inelastic, its price will be high and if it is elastic, its price will be low.

  • Demand Forecasting

The elasticity of demand is the basis of demand forecasting. The knowledge of income elasticity is essential for demand forecasting of producible goods in future. Long- term production planning and management depend more on the income elasticity because management can know the effect of changing income levels on the demand for his product.

  • Dumping

A firm enters foreign markets for dumping his product on the basis of elasticity of demand to face foreign competition.

  • Determination of Prices of Joint Products

The concept of the elasticity of demand is of much use in the pricing of joint products, like wool and mutton, wheat and straw, cotton and cotton seeds, etc. In such cases, separate cost of production of each product is not known.

Therefore, the price of each is fixed on the basis of its elasticity of demand. That is why products like wool, wheat and cotton having an inelastic demand are priced very high as compared to their byproducts like mutton, straw and cotton seeds which have an elastic demand.

  • Determination of Government Policies

The knowledge of elasticity of demand is also helpful for the government in determining its policies. Before imposing statutory price control on a product, the government must consider the elasticity of demand for that product.

The government decision to declare public utilities those industries whose products have inelastic demand and are in danger of being controlled by monopolist interests depends upon the elasticity of demand for their products.

  • Helpful in Adopting the Policy of Protection

The government considers the elasticity of demand of the products of those industries which apply for the grant of a subsidy or protection. Subsidy or protection is given to only those industries whose products have an elastic demand. As a consequence, they are unable to face foreign competition unless their prices are lowered through sub­sidy or by raising the prices of imported goods by imposing heavy duties on them.

  • Determination of Gains from International Trade

The gains from international trade depend, among others, on the elasticity of demand. A country will gain from international trade if it exports goods with less elasticity of demand and import those goods for which its demand is elastic.

In the first case, it will be in a position to charge a high price for its products and in the latter case it will be paying less for the goods obtained from the other country. Thus, it gains both ways and shall be able to increase the volume of its exports and imports.

Price Elasticity of Demand (PED):

Price Elasticity of Demand measures how much the quantity demanded of a product changes in response to a change in its price. It is calculated using the formula:

PED=% change in quantity demanded% change in price\text{PED} = \frac{\%\text{ change in quantity demanded}}{\%\text{ change in price}}

If PED > 1, demand is elastic (responsive to price changes). If PED < 1, demand is inelastic (not responsive). If PED = 1, demand is unitary elastic. For example, if the price of a luxury car drops and sales rise significantly, the demand is elastic. However, for necessities like salt or milk, even a big price rise may not reduce demand much, indicating inelastic demand.

Understanding PED helps businesses set pricing strategies. If demand is inelastic, firms can raise prices to increase total revenue. If it’s elastic, they may lower prices to attract more buyers and increase sales volume. Government agencies also consider PED when imposing taxes.

Income Elasticity of Demand (YED):

Income Elasticity of Demand measures how sensitive the quantity demanded of a good is to a change in consumers’ income. The formula is:

YED=% change in quantity demanded% change in income\text{YED} = \frac{\%\text{ change in quantity demanded}}{\%\text{ change in income}}

If YED > 1, the product is a luxury good, and demand increases more than proportionally with income. If 0 < YED < 1, it’s a normal good, and demand rises with income but at a slower rate. If YED < 0, it is an inferior good, and demand falls as income rises.

For example, as income increases, people may shift from public transport (inferior good) to personal vehicles (normal or luxury goods). Firms use YED to predict sales trends during economic growth or recession. High-income elasticity indicates sales will rise rapidly in prosperous times, while a low or negative elasticity means demand could fall during downturns.

Cross Elasticity of Demand (XED):

Cross Elasticity of Demand measures how the quantity demanded of one good responds to a price change of another related good. It is used to understand the relationship between substitute and complementary goods. The formula is:

XED=% change in quantity demanded of Good A% change in price of Good B\text{XED} = \frac{\%\text{ change in quantity demanded of Good A}}{\%\text{ change in price of Good B}}

If XED > 0, the goods are substitutes (e.g., tea and coffee); a price rise in one increases demand for the other. If XED < 0, the goods are complements (e.g., printers and ink cartridges); a price rise in one reduces demand for the other. If XED = 0, the goods are unrelated.

Businesses analyze XED to predict how a competitor’s price change can impact their own sales. For example, a soft drink company may monitor price changes of rival products to anticipate changes in their own demand. It’s also valuable in pricing bundled products or forming strategic alliances with producers of complementary goods.

error: Content is protected !!