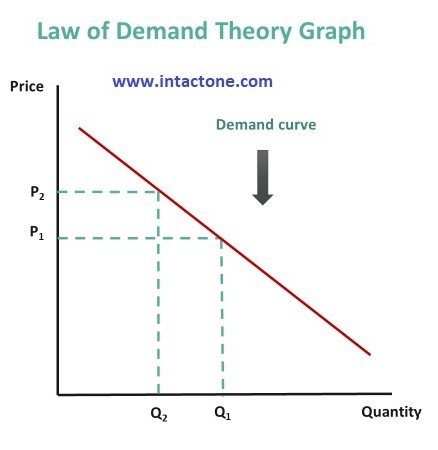
Nature and Scope of Marketing

Marketing is the process of creating, communicating, delivering, and exchanging offerings that have value for customers, clients, partners, and society at large. It involves understanding customer needs and wants, designing products or services to meet those needs, and promoting them effectively to the target audience. Marketing is not limited to selling or advertising—it encompasses market research, product development, pricing strategies, distribution, and relationship building.

In a broader sense, marketing is both an art and a science. It requires creativity to design appealing offerings and analytical skills to interpret market data and trends. The ultimate aim is to satisfy customers profitably while building brand trust and loyalty. In today’s competitive and dynamic environment, marketing also plays a role in anticipating future needs, adapting to technological changes, and delivering value in a socially responsible manner, ensuring long-term success for both businesses and their stakeholders.

Nature of Marketing:

  • Customer-Oriented Process

Marketing focuses primarily on identifying and satisfying customer needs and wants. It starts with understanding the target audience through market research and ends with delivering products or services that meet their expectations. This orientation ensures that all business activities revolve around providing value to customers. By prioritizing customer satisfaction, marketing helps build loyalty, trust, and repeat business. The success of any marketing effort is measured by how well it fulfills customer demands while creating mutual value for both the buyer and the seller. Without a customer-oriented approach, marketing loses its effectiveness and long-term impact.

  • Goal-Oriented Activity

Marketing is directed towards achieving specific organizational goals, such as increasing sales, maximizing profits, expanding market share, or building brand awareness. Every marketing activity—from product development to promotional campaigns—is planned to contribute to these objectives. Goal orientation ensures that marketing efforts are measurable and aligned with the company’s overall strategy. It provides direction, motivates employees, and helps allocate resources efficiently. Without clear goals, marketing activities may become uncoordinated and ineffective. Therefore, a results-driven approach is essential for ensuring that marketing not only attracts customers but also delivers tangible benefits to the business.

  • Continuous and Dynamic Process

Marketing is an ongoing process that evolves with changes in customer preferences, market trends, technology, and competition. It is not a one-time activity but a continuous cycle of research, planning, implementation, and evaluation. The dynamic nature of marketing demands flexibility and innovation to adapt strategies in response to market changes. For example, shifts in consumer behavior due to digitalization or economic fluctuations require businesses to adjust pricing, promotion, and distribution strategies. This adaptability ensures relevance in the market and helps businesses maintain a competitive advantage over time.

  • Value Creation and Satisfaction

At its core, marketing is about creating and delivering value to customers. Value refers to the perceived benefits a customer receives compared to the cost they pay. By offering high-quality products, unique features, and excellent service, businesses can enhance customer satisfaction and loyalty. This value creation goes beyond the product—it includes after-sales support, emotional connection, and brand experience. When customers feel that they receive more benefits than they pay for, they are likely to repurchase and recommend the brand. Thus, value creation is essential for sustainable growth and long-term business success.

  • Integrated Organizational Function

Marketing is not just the responsibility of the marketing department; it is a function that integrates all areas of a business. Production, finance, research, customer service, and logistics must work together to fulfill marketing objectives. This integration ensures that every department contributes to delivering value and maintaining customer satisfaction. For example, production must ensure quality, finance must manage pricing strategies, and logistics must ensure timely delivery. A coordinated approach strengthens the brand image and ensures consistent communication with customers. Integrated marketing helps avoid conflicts, reduces inefficiencies, and enhances the overall customer experience.

  • Mutual Benefit for Business and Society

Marketing creates value not only for businesses but also for society. By providing goods and services that meet consumer needs, marketing improves living standards and supports economic growth. It also fosters employment opportunities, encourages innovation, and promotes fair competition. Ethical marketing practices ensure that products are safe, environmentally friendly, and socially responsible. This balance between business goals and societal welfare builds trust and enhances a brand’s reputation. When marketing serves both business and society, it contributes to sustainable development and creates a positive impact beyond profit-making.

  • Influenced by External Environment

Marketing activities are significantly affected by external environmental factors, including economic conditions, cultural values, technological advancements, legal regulations, and competition. These factors are largely uncontrollable but must be closely monitored to adjust marketing strategies accordingly. For example, changes in government policies may affect pricing or distribution, while technological innovations may open new promotional channels. Understanding the external environment enables businesses to anticipate challenges, seize opportunities, and remain competitive. This adaptability to external influences ensures marketing strategies remain relevant and effective in achieving business objectives.

Scope of Marketing:

  • Study of Consumer Needs and Wants

The scope of marketing begins with identifying and understanding the needs and wants of consumers. This involves conducting market research to gather insights into buyer behavior, preferences, and purchasing patterns. By analyzing this data, businesses can design products and services that match customer expectations. The process includes segmentation, targeting, and positioning to serve the right market effectively. Without a clear understanding of consumer needs, marketing strategies may fail to attract or retain customers. Thus, studying customer needs forms the foundation for all marketing decisions and helps in developing products that deliver genuine value.

  • Product Planning and Development

Product planning is a key part of the marketing scope, involving the creation or improvement of goods and services to meet market demands. This includes determining product features, quality standards, packaging, branding, and after-sales service. Development may involve introducing completely new products or upgrading existing ones to suit changing preferences and technological advancements. Effective product planning ensures that offerings remain competitive and relevant. It also considers factors such as design, innovation, and sustainability. Since products are the core of any marketing strategy, careful planning and development directly impact customer satisfaction and business profitability.

  • Pricing Decisions

Pricing is a critical element of marketing, as it directly affects sales, revenue, and profitability. The scope of marketing includes setting prices that reflect product value, match market conditions, and meet consumer expectations. Pricing strategies may vary based on factors like competition, cost, demand, and government regulations. Marketers may use approaches such as penetration pricing, skimming pricing, or value-based pricing to achieve business goals. The right pricing decision ensures competitiveness without sacrificing profitability. It must also consider psychological aspects, as customers often associate price with quality, making it a key factor in brand positioning.

  • Promotion and Communication

Promotion refers to all activities that inform, persuade, and remind customers about products and services. It includes advertising, personal selling, sales promotions, public relations, and digital marketing. Communication plays a crucial role in creating awareness, generating interest, and building brand loyalty. Marketers must design effective messages and choose suitable media channels to reach their target audience. The scope of promotion extends to creating emotional connections with customers and maintaining consistent brand identity. In today’s digital era, social media and online campaigns have become vital tools for promotional success, ensuring wider reach at lower costs.

  • Distribution (Place) Decisions

Distribution is the process of making products available to customers at the right place, time, and quantity. It involves selecting suitable channels such as wholesalers, retailers, e-commerce platforms, or direct sales. The scope of marketing includes designing efficient distribution networks, managing logistics, warehousing, and transportation. The goal is to ensure product accessibility and customer convenience. Choosing the right distribution strategy can improve market coverage and customer satisfaction. Factors like product type, target market, and cost efficiency influence these decisions. In modern marketing, online distribution has become increasingly important for reaching global audiences quickly.

  • After-Sales Service

After-sales service is a vital part of marketing, especially for products that require installation, maintenance, or repair. It helps in building customer trust and loyalty by ensuring continued satisfaction even after purchase. Services may include warranties, customer support, training, and complaint handling. The scope of marketing recognizes after-sales service as a competitive advantage, as it enhances brand reputation and encourages repeat purchases. Effective after-sales programs also generate positive word-of-mouth, which can attract new customers. In industries like electronics, automobiles, and machinery, after-sales service often determines long-term customer relationships and overall business success.

  • Market Research

Market research involves collecting and analyzing data to support marketing decisions. It helps businesses understand customer behavior, market trends, competition, and potential opportunities. This scope of marketing ensures that strategies are based on facts rather than assumptions. Research may include surveys, focus groups, observation, and data analytics. The insights gained guide product development, pricing, promotion, and distribution. Market research also helps in identifying emerging trends and minimizing risks. In a competitive environment, continuous research is essential for adapting to changes, staying ahead of competitors, and meeting evolving customer needs effectively.

Marketing Research, Types, Process Tools and Techniques

Marketing Research is the systematic process of gathering, analyzing, and interpreting information about a market, target audience, competition, or industry trends. It helps businesses identify opportunities, assess consumer needs, preferences, and behaviors, and evaluate the effectiveness of marketing strategies. Marketing research can be classified into primary research (collecting new data through surveys, interviews, or experiments) and secondary research (analyzing existing data like reports or publications). It provides critical insights that guide decision-making, enhance customer satisfaction, and improve product or service offerings. Effective marketing research ensures that organizations remain competitive and responsive in dynamic market environments.

Features of Marketing Research:

1. Systematic Process

Marketing research follows a structured and methodical approach. It begins with identifying the problem or opportunity, followed by designing the research plan, data collection, analysis, and interpretation. This systematic process ensures accuracy and reliability in findings, which are critical for informed decision-making.

  • Example: A company launching a new product systematically conducts surveys and focus groups to evaluate consumer demand.

2. Objective-Oriented

The primary goal of marketing research is to provide solutions to specific marketing problems or to uncover opportunities. It focuses on collecting relevant data and generating actionable insights to achieve predefined objectives. By remaining goal-focused, marketing research helps avoid irrelevant or excessive data collection.

  • Example: A company may conduct research specifically to understand why sales of a product are declining.

3. Data-Driven

Marketing research relies on data, whether qualitative (opinions, emotions, or motivations) or quantitative (numbers, statistics, or trends). The quality of the research is directly tied to the accuracy, relevance, and timeliness of the data collected.

  • Example: A retailer analyzing customer purchase patterns uses sales data to design targeted promotions.

4. Analytical in Nature

Marketing research emphasizes rigorous analysis of collected data to derive meaningful insights. Various analytical tools and statistical techniques are used to interpret the data, identify trends, and make forecasts. This ensures that decisions are not based on guesswork but on factual evidence.

  • Example: A software company uses predictive analytics to estimate customer lifetime value based on historical behavior.

5. Continuous and Adaptive

Marketing research is not a one-time activity but an ongoing process. Markets are dynamic, with changing consumer behaviors, preferences, and competitive forces. Businesses must adapt their research efforts to stay relevant and updated with current trends.

  • Example: Social media platforms conduct regular research to understand user preferences and develop new features accordingly.

6. Problem-Solving Orientation

Marketing research aims to solve real-world problems by identifying issues and suggesting practical solutions. It provides actionable recommendations to enhance marketing strategies, product development, or customer engagement.

  • Example: Research findings may indicate the need for better customer service training to improve satisfaction levels.

Types of Marketing Research:

1. Exploratory Research

This type of research is conducted when the problem is not clearly defined, and the objective is to explore new ideas or insights. It is qualitative in nature and helps identify potential issues, opportunities, or solutions. Techniques like focus groups, in-depth interviews, and open-ended surveys are commonly used.

  • Example: A company exploring the viability of a new product concept by interviewing a small group of target customers.

2. Descriptive Research

Descriptive research aims to describe the characteristics of a specific market or consumer group. It is often quantitative and provides information about consumer demographics, behaviors, and preferences. Surveys, observational studies, and data analysis are typical methods used.

  • Example: A retailer conducting a survey to understand the purchasing habits of millennials.

3. Causal Research

Also known as experimental research, causal research is conducted to identify cause-and-effect relationships between variables. It tests hypotheses to determine how changes in one variable (e.g., price) impact another (e.g., sales).

  • Example: A business running A/B tests on two different ad campaigns to measure their impact on customer engagement.

4. Qualitative Research

This research focuses on understanding consumer emotions, motivations, and behaviors through non-numerical data. It uses methods like focus groups, interviews, and ethnographic studies to gather in-depth insights.

  • Example: A luxury brand conducting interviews to understand how customers perceive exclusivity.

5. Quantitative Research

Quantitative research collects and analyzes numerical data to identify trends, patterns, and relationships. It relies on large sample sizes and uses techniques like surveys, statistical analysis, and structured questionnaires.

  • Example: A telecom company analyzing customer satisfaction scores through large-scale surveys.

6. Primary Research

Primary research involves collecting original data directly from respondents. It provides specific insights tailored to the research objectives and is conducted through surveys, experiments, and direct observations.

  • Example: A startup conducting an online poll to gauge interest in its new app.

7. Secondary Research

This type of research involves analyzing existing data from sources like reports, studies, industry publications, and government statistics. It is cost-effective and useful for understanding broader trends.

  • Example: A business using market reports to understand industry growth rates.

8. Product Research

Product research focuses on understanding consumer preferences and feedback related to a product’s features, packaging, or usability. It helps in product development and enhancement.

  • Example: A beverage company testing different flavors with a focus group.

9. Market Segmentation Research

This research identifies distinct consumer segments within a broader market based on demographics, behaviors, or preferences. It helps businesses target the right audience effectively.

  • Example: A fashion retailer segmenting its market into groups based on age and lifestyle.

10. Competitive Analysis Research

This type examines competitors’ strategies, strengths, and weaknesses. It provides insights into the competitive landscape and helps businesses differentiate themselves.

  • Example: A software company analyzing its competitors’ pricing and features.

Process of Marketing Research:

1. Identifying the Problem or Opportunity

The first step in the marketing research process is clearly defining the problem or identifying the opportunity. This step is critical, as it sets the foundation for the entire research process. A poorly defined problem may lead to irrelevant or misleading results. Businesses need to determine what they want to achieve, whether it is understanding declining sales, evaluating a new product’s potential, or exploring customer preferences. For instance, a company may want to know why customer satisfaction levels have decreased over the past quarter.

2. Developing the Research Plan

Once the problem is identified, the next step is to design a comprehensive research plan. This involves selecting the type of research (exploratory, descriptive, or causal) and determining the research approach (qualitative, quantitative, or a mix of both). Additionally, researchers decide on the methods for data collection, such as surveys, interviews, focus groups, or experiments. The plan should also outline the sampling method, sample size, and research budget. A well-thought-out research plan ensures that the process is efficient and cost-effective.

3. Collecting Data

Data collection is a crucial step that involves gathering information from primary or secondary sources. Primary data is collected firsthand through methods like questionnaires, interviews, and observations. Secondary data is obtained from existing sources such as market reports, government publications, and industry databases. The choice of data collection method depends on the objectives and available resources. For instance, if a business wants real-time customer feedback, it may use online surveys or social media polls.

4. Analyzing the Data

After data collection, the next step is to organize, analyze, and interpret the information to derive meaningful insights. Statistical tools, software, and techniques like regression analysis, correlation, and data visualization are often employed. This step involves identifying patterns, trends, and relationships within the data. For example, analysis may reveal that customers prefer specific product features or that price sensitivity is affecting sales.

5. Presenting the Findings

Once the data is analyzed, the results need to be compiled into a clear and concise report. The report typically includes an executive summary, research objectives, methodology, key findings, and actionable recommendations. Visual aids like graphs, charts, and tables are often used to make the findings easier to understand. This presentation helps decision-makers grasp the key insights and make informed choices based on the research.

6. Taking Action and Monitoring Results

The final step in the marketing research process is to implement the recommendations and monitor the outcomes. Businesses use the insights gained to develop strategies, improve products, or enhance customer experiences. Continuous monitoring ensures that the implemented actions are achieving the desired results and allows for adjustments if necessary. For instance, if a marketing campaign based on research insights shows positive results, it validates the research process.

Tools and Techniques of Marketing Research:

1. Data Collection Tools

a. Surveys and Questionnaires

Surveys are one of the most popular tools for collecting primary data. They involve structured questions designed to gather quantitative or qualitative insights.

  • Example: Online surveys using platforms like Google Forms, SurveyMonkey, or Qualtrics.
  • Benefit: Cost-effective and scalable for large audiences.

b. Interviews

Interviews provide in-depth insights by engaging participants in detailed discussions. They can be conducted face-to-face, via phone, or online.

  • Example: One-on-one interviews with key customers to explore their motivations.
  • Benefit: Allows for probing and clarifying responses.

c. Focus Groups

Focus groups involve moderated discussions with a small group of participants to gather opinions and ideas.

  • Example: A retailer organizing focus groups to test new store layouts.
  • Benefit: Reveals group dynamics and diverse perspectives.

d. Observation

Observation involves monitoring consumer behavior in real-world settings without direct interaction.

  • Example: Watching how shoppers navigate a store.
  • Benefit: Captures actual behavior rather than self-reported data.

e. Experiments

Experiments test specific variables to determine cause-and-effect relationships.

  • Example: A/B testing two versions of a website landing page.
  • Benefit: Provides reliable data for decision-making.

2. Data Analysis Tools

a. Statistical Software

Statistical tools like SPSS, SAS, and R help analyze large datasets and uncover trends, correlations, and patterns.

  • Example: A company using SPSS to analyze survey results.
  • Benefit: Ensures accurate and sophisticated data analysis.

b. Data Visualization Tools

Tools like Tableau, Power BI, and Excel create visual representations of data, such as charts and graphs.

  • Example: A marketer using Tableau to create dashboards for campaign performance.
  • Benefit: Makes complex data easy to understand and interpret.

c. Predictive Analytics

Predictive tools use algorithms and machine learning to forecast future trends and behaviors.

  • Example: An e-commerce platform predicting customer purchase likelihood.
  • Benefit: Enables proactive decision-making.

3. Online Tools

a. Social Media Analytics

Platforms like Hootsuite and Brandwatch analyze consumer sentiment and behavior on social media.

  • Example: Tracking brand mentions and hashtags to measure campaign effectiveness.
  • Benefit: Provides real-time insights into public opinion.

b. Web Analytics

Google Analytics and similar tools track website traffic, user behavior, and conversion rates.

  • Example: Monitoring the effectiveness of an ad campaign through website traffic spikes.
  • Benefit: Helps optimize digital marketing strategies.

c. CRM Systems

Customer Relationship Management (CRM) tools like Salesforce and HubSpot track customer interactions and preferences.

  • Example: Analyzing customer purchase history to identify upselling opportunities.
  • Benefit: Enhances customer relationship strategies.

4. Secondary Research Tools

a. Industry Reports and Publications

Reports from organizations like Nielsen, Gartner, or McKinsey provide valuable secondary data.

  • Example: Using market trends from a Nielsen report to strategize.
  • Benefit: Saves time and resources on primary research.

b. Government Data

Government databases, like Census data or economic reports, offer comprehensive and reliable information.

  • Example: Analyzing population trends for market expansion.
  • Benefit: Provides credible data for broad insights.

5. Qualitative Techniques

a. SWOT Analysis

This technique assesses a business’s strengths, weaknesses, opportunities, and threats.

  • Example: A company analyzing its competitive edge in a new market.
  • Benefit: Supports strategic planning.

b. Ethnographic Research

This involves observing consumers in their natural environments to understand their habits and lifestyles.

  • Example: Studying how rural communities use a product.
  • Benefit: Offers deep, contextual insights.

Advantages of Marketing Research

(i) Marketing research helps the management of a firm in planning by providing accurate and up- to-date information about the demands, their changing tastes, attitudes, preferences, buying.

(ii) It helps the manufacturer to adjust his production according to the conditions of demand.

(iii) It helps to establish correlative relationship between the product brand and consumers’ needs and preferences.

(iv) It helps the manufacturer to secure economies in the distribution о his products.

(v) It makes the marketing of goods efficient and economical by eliminating all type of wastage.

(vi) It helps the manufacturer and dealers to find out the best way of approaching the potential.

(vii) It helps the manufacturer to find out the defects in the existing product and take the required corrective steps to improve the product.

(viii) It helps the manufacturer in finding out the effectiveness of the existing channels of distribution and in finding out the best way of distributing the goods to the ultimate consumers.

(ix) It guides the manufacturer in planning his advertising and sales promotion efforts.

(x) It is helpful in assessing the effectiveness of advertising programmes.

(xi) It is helpful in evaluating the relative efficiency of the different advertising media.

(xii) It is helpful in evaluating selling methods.

(xiii) It reveals the causes of consumer resistance.

(xiv) It minimizes the risks of uncertainties and helps in taking sound decisions.

(xv) It reveals the nature of demand for the firm’s product. That is, it indicates whether the demand for the product is constant or seasonal.

(xvi) It is helpful in ascertaining the reputation of the firm and its products.

(xvii) It helps the firm in determining the range within which its products are to be offered to the consumers. That is, it is helpful in determining the sizes, colours, designs, prices, etc., of the products of the firm.

(xviii) It would help the management to know how patents, licensing agreements and other legal restrictions affect the manufacture and sale of the firm’s products.

(xix) It is helpful to the management in determining the actual prices and the price ranges.

(xx) It is helpful to the management in determining the discount rates.

Limitations of Marketing Research

1. High Costs

Conducting marketing research can be expensive, especially for small businesses with limited budgets. Expenses for hiring research agencies, designing surveys, collecting data, and using analytical tools can add up quickly. This financial constraint may force companies to compromise on the quality or scope of the research.

  • Example: A startup may avoid conducting large-scale surveys due to high costs, leading to limited insights.

2. Time-Consuming Process

Marketing research is a time-intensive process that involves multiple steps, including planning, data collection, analysis, and reporting. In fast-moving markets, by the time the research is complete, the insights may already be outdated, rendering them less useful.

  • Example: A company taking months to complete research for a new product launch may lose its first-mover advantage.

3. Risk of Inaccurate Data

The accuracy of marketing research depends on the quality of data collected. If the data is incorrect, biased, or incomplete, the insights derived from it will also be flawed. Poor sampling techniques, respondent dishonesty, or misinterpretation can lead to unreliable results.

  • Example: Customers providing false responses in a survey to avoid revealing their true preferences.

4. Limited Scope

Marketing research often focuses on specific issues, making it difficult to gain a holistic view of the market. Additionally, certain qualitative factors, like emotional responses or cultural nuances, may be difficult to quantify or measure accurately.

  • Example: Research that examines customer satisfaction but overlooks external factors like economic conditions influencing buying behavior.

5. Dependency on Respondents

Marketing research relies heavily on respondents’ participation and honesty. If respondents are unwilling to engage, provide inaccurate information, or exhibit bias, the results can be compromised. Non-response or low response rates can also affect the validity of the study.

  • Example: Online surveys often experience low response rates, leading to insufficient data for meaningful analysis.

6. Rapid Market Changes

Markets are dynamic, with trends, consumer preferences, and competition evolving rapidly. Research findings may become irrelevant by the time they are implemented, especially in industries like technology or fashion where changes occur frequently.

  • Example: A company basing its advertising strategy on outdated research results may fail to connect with current consumer trends.

Personal Selling, Meaning, Objectives, Process, Importance, Techniques, Strategies and Considerations

Personal Selling is a crucial component of the promotional mix that involves direct interaction between a salesperson and a potential customer. It is a highly personalized form of communication that allows for tailored product presentations, addressing customer needs and concerns, building relationships, and ultimately persuading customers to make a purchase. In this section, we will delve into the concept of personal selling, its objectives, process, techniques, and the skills required for effective personal selling.

Personal selling can be defined as a face-to-face communication process between a salesperson and a prospective customer, with the goal of making a sale. Unlike other forms of promotion, personal selling offers direct interaction, enabling the salesperson to customize the sales message and adapt to the customer’s specific needs and preferences.

Primary Objectives of Personal Selling

  • Generating Sales

The primary objective of personal selling is to generate sales by persuading potential customers to purchase a product or service. The salesperson uses their expertise and communication skills to showcase the features, benefits, and value of the offering, emphasizing how it meets the customer’s needs.

  • Building Relationships

Personal selling allows salespeople to establish and nurture relationships with customers. By understanding their needs, providing personalized attention, and offering ongoing support, salespeople can build trust, loyalty, and long-term relationships with customers.

  • Providing Information and Education

Salespeople play a crucial role in providing customers with detailed product or service information, addressing their questions and concerns, and educating them on how the offering can solve their problems or fulfill their desires. This information exchange helps customers make informed purchase decisions.

  • Gathering Feedback

Through personal interactions, salespeople can gather valuable feedback from customers. They can gain insights into customer preferences, market trends, competitors’ activities, and potential areas of improvement for the product or service. This feedback is valuable for refining marketing strategies and enhancing the offering.

  • Market Research

Salespeople are often at the front lines of customer interactions, making them a valuable source of market intelligence. They can collect information about customer preferences, competitor strategies, and market trends, which can be used for market research and analysis.

Personal Selling Process

The personal selling process involves several sequential steps that guide salespeople in their interactions with customers. While the specific steps may vary depending on the sales methodology or organization, the general process includes the following stages:

  • Prospecting

The salesperson identifies potential customers or leads through various sources such as referrals, databases, networking, or market research. Prospecting involves evaluating the leads to determine their potential as qualified prospects.

  • Pre-approach

In the pre-approach stage, the salesperson gathers information about the prospect, such as their needs, preferences, and background. This research helps in tailoring the sales presentation and approach to address the prospect’s specific requirements.

  • Approach

The salesperson makes initial contact with the prospect. The approach should be professional, courteous, and engaging, aiming to capture the prospect’s attention and establish rapport.

  • Needs Assessment

In this stage, the salesperson engages in a conversation with the prospect to identify their needs, challenges, and goals. By asking open-ended questions and actively listening, the salesperson gains a deeper understanding of the prospect’s situation, which forms the basis for the subsequent stages.

  • Presentation

Based on the needs assessment, the salesperson designs a customized presentation that highlights the features, benefits, and value of the product or service. The presentation should focus on how the offering addresses the prospect’s specific needs and provides a solution to their challenges.

  • Handling Objections

Prospects may have concerns, objections, or doubts that need to be addressed. The salesperson should listen empathetically, clarify misunderstandings, provide additional information, and present compelling arguments to overcome objections. Handling objections requires active listening, empathy, product knowledge, and persuasive communication skills.

  • Closing the Sale

Once the prospect’s objections have been addressed, the salesperson moves towards closing the sale. This involves asking for the order or commitment from the prospect. Closing techniques may vary, including trial closes, assumptive closes, or offering incentives to prompt the prospect to make a buying decision.

  • Follow-up and Relationship Building

After the sale is closed, the salesperson follows up with the customer to ensure satisfaction, address any post-purchase concerns, and solidify the relationship. Effective follow-up helps in building customer loyalty, generating repeat business, and potentially obtaining referrals.

Importance of Personal Selling

  • Builds Strong Customer Relationships

Personal selling enables direct interaction between the salesperson and the customer, allowing for meaningful conversations and trust-building. Through one-on-one communication, the salesperson can understand customer needs better and provide personalized solutions. This approach fosters long-term relationships, increases customer loyalty, and encourages repeat business. Unlike impersonal advertising, personal selling creates a human connection, which is especially important in high-value or complex purchases where customer assurance and trust are essential for decision-making.

  • Helps Understand Customer Needs

Personal selling allows marketers to gain deep insights into individual customer needs, preferences, and concerns. Salespersons can ask questions, listen actively, and observe reactions to tailor their pitch accordingly. This interactive process helps businesses adapt their offerings in real-time and solve specific problems faced by customers. Understanding these needs not only increases the chances of closing a sale but also provides valuable feedback for product improvement and marketing strategies, enhancing overall customer satisfaction.

  • Effective for Complex Products

When dealing with complex, technical, or expensive products, personal selling becomes essential. Customers often need detailed explanations, demonstrations, or reassurance before making a purchase. Salespersons can clarify doubts, provide in-depth product knowledge, and customize solutions based on customer requirements. This face-to-face interaction builds confidence in the product and company, making personal selling ideal for products like machinery, financial services, or medical equipment where informed decisions are critical.

  • Immediate Feedback and Adaptation

Personal selling offers the unique advantage of receiving immediate feedback from customers. Sales representatives can quickly assess customer reactions, objections, or confusion and modify their sales approach accordingly. This real-time exchange improves communication effectiveness and enhances the chance of closing the deal. It also helps in identifying potential improvements in the product or marketing message. The adaptability of personal selling gives it a distinct edge over other promotional tools that lack interactive capabilities.

  • Enhances Sales Conversion Rates

Compared to other promotional methods, personal selling often results in higher conversion rates. The salesperson’s ability to tailor the sales message, answer questions, and handle objections directly increases the likelihood of turning interest into actual purchases. The personal touch, persuasive skills, and detailed product demonstrations create a more convincing environment for the buyer. This effectiveness makes personal selling especially valuable in business-to-business (B2B) contexts or high-involvement consumer purchases where buyers seek assurance and detailed information.

  • Supports New Product Introduction

When launching a new product, personal selling plays a vital role in creating awareness and educating customers. Salespersons can explain the product’s features, benefits, and usage in a clear and engaging manner. They also gather customer reactions and relay feedback to the company, aiding in refining the product or marketing strategy. In markets where consumers are unfamiliar with the product, personal selling bridges the information gap and accelerates acceptance by building trust and providing clarity.

  • Increases Customer Satisfaction

Personal selling allows businesses to offer personalized service, which enhances customer satisfaction. Salespeople can address individual queries, offer tailored recommendations, and ensure the customer fully understands the product. This level of attention and care makes customers feel valued and respected. When customers have a positive experience during the buying process, they are more likely to return, refer others, and become brand advocates, contributing to long-term business growth and profitability.

Techniques and Strategies in Personal Selling

  • Relationship Building

Personal selling emphasizes building strong relationships with customers. This involves understanding their needs, maintaining regular communication, providing ongoing support, and demonstrating a genuine interest in their success.

  • Consultative Selling

Consultative selling focuses on being a trusted advisor to the customer. Salespeople actively listen, ask probing questions, and provide solutions that align with the customer’s needs. This approach positions the salesperson as a problem-solver rather than a mere product pusher.

  • Solution Selling

Solution selling involves identifying the customer’s pain points and offering customized solutions that address those specific challenges. It requires a deep understanding of the customer’s business, industry, and competitive landscape to provide value-added solutions.

  • Relationship Marketing

Salespeople can employ relationship marketing strategies to cultivate long-term customer relationships. This involves personalized interactions, loyalty programs, after-sales support, and ongoing communication to strengthen the bond between the customer and the salesperson.

  • Team Selling

In some cases, complex sales require a team-based approach. Salespeople work together, combining their expertise and skills to address various aspects of the customer’s needs. Team selling ensures comprehensive coverage and provides a seamless experience for the customer.

  • Adaptive Selling

Adaptive selling refers to the salesperson’s ability to adapt their selling style and approach to match the customer’s communication style, preferences, and decision-making process. This requires flexibility, active listening, and the ability to read and respond to the customer’s verbal and non-verbal cues.

Skills Required for Effective Personal Selling

  • Communication Skills

Salespeople need strong verbal and written communication skills to effectively convey their messages, actively listen to customers, and articulate the value proposition of the product or service.

  • Interpersonal Skills

Building rapport, empathy, and trust are crucial in personal selling. Salespeople should be able to establish connections with customers, understand their perspectives, and navigate different personality types.

  • Product Knowledge

Salespeople must have in-depth knowledge of the product or service they are selling. This includes understanding its features, benefits, competitive advantages, and how it solves customer problems.

  • Persuasion and Negotiation Skills

Salespeople need the ability to persuade and influence customers, particularly in addressing objections and closing sales. Effective negotiation skills help in finding mutually beneficial outcomes and reaching agreement with customers.

  • Problem-Solving Skills

Salespeople should be adept at identifying customer problems or challenges and offering appropriate solutions. Problem-solving skills enable salespeople to customize their offerings and address unique customer needs effectively.

  • Time Management and Organization

Personal selling involves managing multiple prospects and leads simultaneously. Salespeople should have strong organizational skills to prioritize tasks, manage their time effectively, and follow up with prospects in a timely manner.

  • Resilience and Perseverance

Rejection is a common aspect of personal selling. Salespeople must possess the resilience to handle rejection, stay motivated, and persistently pursue new opportunities.

Ethical Considerations in Personal Selling

Personal selling, like any other business activity, requires ethical conduct to build trust and maintain long-term relationships with customers.

  • Honesty and Integrity

Salespeople should always be honest in their interactions with customers. They should avoid making false claims or exaggerations about the product or service and provide accurate information to enable customers to make informed decisions.

  • Transparency

Salespeople should disclose any potential conflicts of interest, such as receiving commissions or incentives for selling certain products. Transparent communication builds trust and ensures that customers have all the relevant information to make a decision.

  • Customer’s Best Interest

Salespeople should prioritize the customer’s best interest over their own. They should recommend products or services that genuinely meet the customer’s needs, even if it means recommending a lower-priced option or referring them to a competitor.

  • Confidentiality

Salespeople should respect the confidentiality of customer information shared during the sales process. They should handle customer data securely and use it only for the intended purpose.

  • Respect and Professionalism:

Salespeople should treat customers with respect, professionalism, and courtesy. They should avoid aggressive or manipulative tactics and ensure that customers feel valued and heard throughout the sales process.

  • Compliance with Laws and Regulations

Salespeople should adhere to all applicable laws and regulations governing personal selling, including consumer protection laws, privacy regulations, and advertising standards.

  • Ethical Sales Practices

Salespeople should avoid engaging in unethical practices, such as high-pressure selling, bait-and-switch techniques, or misleading advertising. They should focus on building trust and long-term relationships rather than short-term gains.

Marketing Planning, Importance, Steps, Elements, Benefits and Challenges

Marketing Planning is the systematic process of designing and organizing strategies to achieve marketing objectives. It involves analyzing the market, understanding customer needs, setting clear goals, and outlining actionable steps to position a company’s product or service effectively. A well-structured marketing plan serves as a roadmap, guiding businesses in allocating resources, managing activities, and responding to market changes.

Importance of Marketing Planning

  • Provides Direction and Focus

Marketing planning helps organizations focus on specific goals and objectives. It ensures all efforts align with the company’s vision and mission, minimizing wasted resources and maximizing efficiency.

  • Facilitates Decision-Making

By understanding market dynamics, competition, and customer behavior, marketing planning empowers businesses to make informed decisions.

  • Improves Coordination

Marketing planning integrates various functions, ensuring cohesive efforts between teams like sales, advertising, and product development.

  • Adaptability to Change

A marketing plan allows businesses to anticipate challenges and respond to market fluctuations or opportunities effectively.

Steps in Marketing Planning

1. Situational Analysis

  • Market Research: Gather data on market trends, customer preferences, and industry developments.
  • SWOT Analysis: Evaluate strengths, weaknesses, opportunities, and threats to understand the company’s internal and external environment.
  • Competitor Analysis: Identify competitors’ strategies, strengths, and weaknesses to carve out a competitive edge.
  • Customer Analysis: Understand the target audience, their needs, purchasing behavior, and preferences.

2. Setting Marketing Objectives

Objectives should be SMART:

  • Specific: Clearly define what the business aims to achieve.
  • Measurable: Ensure objectives can be tracked and evaluated.
  • Achievable: Set realistic and attainable goals.
  • Relevant: Align objectives with overall business goals.
  • Time-Bound: Establish a timeline for achieving goals.

Example objectives include increasing market share, boosting sales, enhancing brand awareness, or entering new markets.

3. Developing Marketing Strategies

A strategy outlines how the objectives will be achieved. This includes:

  • Segmentation: Divide the market into distinct groups based on demographics, behavior, or needs.
  • Targeting: Select the most profitable and suitable segments to focus on.
  • Positioning: Create a unique value proposition to differentiate the product or service from competitors.

4Ps of Marketing Mix play a central role here:

  • Product: Develop offerings that meet customer needs.
  • Price: Determine pricing strategies based on value, competition, and cost.
  • Place: Ensure efficient distribution channels to reach the target audience.
  • Promotion: Use advertising, sales promotion, and public relations to communicate with customers.

4. Budgeting and Resource Allocation

Allocate resources, including financial, human, and technological, to implement marketing strategies effectively. Create a detailed budget outlining expected costs for each activity, ensuring alignment with the company’s overall financial plan.

5. Implementation of the Plan

Execution involves turning strategies into actionable tasks. This includes:

  • Launching campaigns across selected channels.
  • Engaging with target audiences through advertising, social media, and events.
  • Monitoring team performance to ensure activities align with goals.

Proper coordination among teams and departments is crucial for successful implementation.

6. Monitoring and Evaluation

Measure the effectiveness of marketing activities using key performance indicators (KPIs), such as:

  • Sales growth
  • Customer acquisition cost
  • Return on investment (ROI)
  • Website traffic or social media engagement

Regular evaluation helps identify areas of improvement, ensuring the marketing plan remains relevant and effective.

Elements of a Marketing Plan

  • Executive Summary: A brief overview of the plan, highlighting key goals and strategies.
  • Market Analysis: Detailed insights into market trends, customer preferences, and competitive landscape.
  • Marketing Objectives: Clearly defined and measurable goals.
  • Marketing Strategies: Plans for segmentation, targeting, positioning, and the marketing mix.
  • Budget: Estimated costs for campaigns, promotions, and operational activities.
  • Action Plan: A timeline for tasks, responsibilities, and milestones.
  • Performance Metrics: Criteria for measuring success and tracking progress.

Benefits of Marketing Planning:

  • Enhances Market Understanding: Provides insights into customer behavior, competition, and market trends.
  • Optimizes Resource Utilization: Allocates resources effectively, reducing wastage and maximizing ROI.
  • Increases Efficiency: Streamlines processes and aligns team efforts with organizational goals.
  • Improves Risk Management: Anticipates challenges and prepares contingency plans.
  • Boosts Competitive Advantage: Helps businesses position themselves effectively in the market.

Challenges in Marketing Planning:

  • Rapid Market Changes: Adapting to evolving consumer preferences and technology can be challenging.
  • Resource Constraints: Limited budgets or staff can hinder the execution of plans.
  • Data Overload: Analyzing large volumes of data may complicate decision-making.
  • Resistance to Change: Teams may struggle to adapt to new strategies or processes.
  • Uncertainty: External factors like economic downturns or regulatory changes can impact plans.

Cost of Production

Cost of Production refers to the total expenditure incurred by a business in the process of producing goods or services. It includes the monetary value of all inputs used during production, such as raw materials, labor, machinery, utilities, and overheads. Understanding production costs is crucial for determining pricing, profitability, and operational efficiency.

Cost of production is a fundamental concept in both micro and macroeconomics. It helps firms evaluate resource allocation, set competitive prices, and measure profitability. Lower production costs often lead to a higher competitive edge in the market.

Cost of production serves as a cornerstone for analyzing business operations, planning budgets, and making long-term strategic decisions, especially in a competitive and dynamic business environment.

Concept of Costs:

The concept of costs refers to the monetary value of resources sacrificed or expenses incurred in the process of producing goods or services. In economics and business, cost is a fundamental concept that helps firms make informed decisions related to production, pricing, budgeting, and profitability.

Costs are broadly classified based on purpose and perspective:

1. Short-Run and Long-Run Costs

Short-run costs refer to the costs incurred when at least one factor of production is fixed. Typically, capital or plant size is fixed in the short run, while labor and raw materials are variable. As a result, businesses face both fixed and variable costs in the short run. Short-run cost behavior includes increasing or decreasing returns due to limited flexibility in resource adjustment.

Long-run costs are incurred when all factors of production are variable. In the long run, firms can change plant size, technology, and resource combinations to achieve optimal efficiency. There are no fixed costs in the long run. Long-run cost curves represent the least-cost method of producing each output level, and they are derived from short-run average cost curves.

Understanding these concepts helps firms make strategic decisions. In the short run, businesses focus on maximizing output with limited resources, while in the long run, they plan capacity expansion, technology upgrades, and cost minimization.

2. Average and Marginal Costs

Average Cost is the cost per unit of output, calculated by dividing the total cost (TC) by the number of units produced. It indicates the efficiency of production at various output levels and helps in pricing decisions. There are different types of average costs: average total cost, average fixed cost, and average variable cost.

Marginal Cost is the additional cost incurred by producing one more unit of output. It is calculated as the change in total cost when output increases by one unit. Marginal cost plays a crucial role in decision-making, especially in determining optimal production level. If the price of the product is greater than marginal cost, firms increase production; if it’s lower, they reduce it.

The relationship between average cost and marginal cost is important:

  • When MC is less than AC, AC falls.
  • When MC is greater than AC, AC rises.
  • When MC equals AC, AC is at its minimum.

These cost concepts help firms evaluate profitability, determine output levels, and set appropriate prices for sustainability and competitiveness.

3. Total, Fixed, and Variable Costs

Total Cost refers to the overall expense incurred in the production of goods or services. It is the sum of Fixed Costs (FC) and Variable Costs (VC).
TC = FC + VC

Fixed Costs are those costs that do not vary with the level of output. They remain constant even if production is zero. Examples include rent, salaries of permanent staff, and insurance. Fixed costs are unavoidable in the short run and must be paid regardless of production volume.

Variable Costs, on the other hand, change with the level of output. The more a firm produces, the higher the variable cost. Examples include raw materials, hourly wages, and utility charges. These costs are directly proportional to the quantity of production.

Understanding these components is critical for firms to analyze cost behavior and manage operations efficiently. Total cost helps in calculating average and marginal costs, which are essential for decision-making. Fixed costs highlight the burden a firm carries regardless of activity, while variable costs help in adjusting expenses according to production scale.

MC as change in TVC:

Marginal cost for the nth unit may be expressed as

Since fixed cost remains unchanged at all levels of output up to capacity we can write FC = FCn-1 in which case MC may be expressed as:

MCn = VCn – VCn-1

Thus marginal cost refers to marginal variable cost. In other words, MC has no relation to fixed cost.

National income Analysis and Measurement

National income refers to the total monetary value of all final goods and services produced within a country’s borders over a specific period, typically a year. It serves as a crucial indicator of a country’s economic performance and standard of living. In India, national income is measured using various methods, including the production approach, income approach, and expenditure approach.

A. Gross Domestic Product (GDP)

Gross Domestic Product (GDP) is the most commonly used measure of national income and represents the total value of all final goods and services produced within a country’s borders during a specified period, usually a year. In India, GDP is calculated using both production and expenditure approaches.

Key Features of GDP:

  • Domestic Focus: It includes only the goods and services produced within the country, regardless of the nationality of the producer.

  • Final Goods Only: It counts only final goods and services to avoid double counting (intermediate goods are excluded).

  • Market Value: Goods and services are evaluated at current market prices.

  • Time-bound: GDP is always measured over a specific time period (quarterly or annually).

  • Inclusive of All Sectors: It includes the output of the agriculture, industrial, and service sectors.

Methods of Calculating GDP:

There are three main methods to calculate GDP:

1. Production (Output) Method

  • Measures the total value added at each stage of production across all sectors.
  • GDP = Gross Value of Output – Value of Intermediate Consumption

2. Income Method

  • Sums up all incomes earned by factors of production (wages, rent, interest, profit).
  • GDP = Compensation to employees + Operating surplus + Mixed income

Expenditure Method

  • Adds up all expenditures made on final goods and services.
  • GDP = C + I + G + (X – M)
    Where:
    C = Consumption
    I = Investment
    G = Government Expenditure
    X = Exports
    M = Imports

Types of GDP:

1. Nominal GDP

  • Measured at current market prices, without adjusting for inflation.

  • It reflects price changes and not actual growth.

2. Real GDP

  • Adjusted for inflation or deflation.

  • Shows the true growth in volume of goods and services.

3. GDP at Market Price (GDPMP)

  • Includes indirect taxes and excludes subsidies.

4. GDP at Factor Cost (GDPFC)

  • GDPMP – Indirect Taxes + Subsidies

  • Reflects the income earned by the factors of production.

Significance of GDP:

  • Indicator of Economic Health: Higher GDP indicates a growing economy.

  • Comparison Tool: Enables comparison of economies across countries or time periods.

  • Policy Planning: Governments use GDP data to design fiscal and monetary policies.

  • Investment Decisions: Investors rely on GDP trends for market analysis and forecasting.

Limitations of GDP:

  • Ignores Income Distribution: Doesn’t show inequality or poverty levels.

  • Non-Market Activities Excluded: Housework or informal sector contributions are not counted.

  • Environmental Degradation: GDP growth may come at the cost of resource depletion.

  • Underground Economy: Unrecorded economic activities are not included.

Components of GDP:

In India, GDP is composed of several components, including:

  • Consumption (C)

Expenditure on goods and services by households, including spending on food, housing, healthcare, education, and other consumer goods.

  • Investment (I)

Expenditure on capital goods such as machinery, equipment, construction, and infrastructure, including both private and public sector investment.

  • Government Spending (G)

Expenditure by the government on goods and services, including salaries, public infrastructure, defense, and social welfare programs.

  • Net Exports (NX)

The difference between exports and imports of goods and services. A positive value indicates a trade surplus, while a negative value indicates a trade deficit.

Sectorial Composition of GDP:

India’s GDP is composed of several sectors:

  • Agriculture

This sector includes farming, forestry, fishing, and livestock, and contributes to food security, rural livelihoods, and raw material supply for industries.

  • Industry

The industrial sector encompasses manufacturing, mining, construction, and utilities. It drives economic growth, employment generation, and technological advancement.

  • Services

The services sector includes trade, transport, communication, finance, real estate, professional services, and government services. It accounts for a significant share of GDP and employment and plays a crucial role in supporting other sectors.

B. Gross National Product (GNP)

Gross National Product (GNP) is the total monetary value of all final goods and services produced by the residents (nationals) of a country in a given period (usually a year), regardless of where the production takes place—whether within the domestic economy or abroad.

In other words, GNP = GDP + Net Factor Income from Abroad (NFIA).

Net Factor Income from Abroad (NFIA) includes:

  • Income earned by residents abroad (wages, dividends, interest, etc.)

  • Minus income earned by foreigners within the domestic territory

GNP = GDP + (Income earned from abroad − Income paid to foreigners)

Key Characteristics of GNP:

  • Nationality-Based: Focuses on ownership, not geography. It includes income earned by citizens and businesses of a country, even if earned outside its borders.

  • Includes Net Factor Income: Takes into account factor incomes (wages, rent, interest, profits) earned internationally.

  • Reflects Economic Strength Globally: Measures a nation’s economic contribution globally, especially helpful for countries with high overseas employment or investments.

  • Measured Annually or Quarterly: Like GDP, GNP is also calculated over a specific time period.

Example to Understand GNP

Suppose:

  • India’s GDP = ₹250 lakh crore

  • Income earned by Indian citizens abroad = ₹15 lakh crore

  • Income earned by foreigners in India = ₹10 lakh crore

Then:

GNP = ₹250 + ₹15 − ₹10 = ₹255 lakh crore

Types of GNP:

  • GNP at Market Prices (GNPMP): Includes indirect taxes and excludes subsidies.

  • GNP at Factor Cost (GNPFC):

    GNP at Factor Cost = GN at Market Price − Indirect Taxes + Subsidies

Importance of GNP:

  • Measures National Income Globally: Indicates the economic strength of a nation including overseas activities.

  • Helps in Policy Formulation: Useful for countries with significant remittances or foreign business operations.

  • Comparative Analysis: Helpful for comparing resident income versus domestic production (GNP vs GDP).

  • Better Measure for Some Economies: For countries with many overseas workers (e.g., Philippines, India), GNP may reflect actual income inflow more accurately than GDP.

Limitations of GNP:

  • Neglects Domestic Productivity: May overstate or understate true economic strength if NFIA is volatile.

  • Difficulties in Measuring NFIA: Tracking international incomes can be inaccurate or delayed.

  • Not a Welfare Indicator: Like GDP, GNP doesn’t reflect inequality, environmental damage, or well-being.

  • Ignores Informal Economy: Unregistered businesses and informal work are excluded.

C. Net National Product (NNP)

Net National Product (NNP) is the monetary value of all final goods and services produced by the residents of a country in a given period (usually one year), after accounting for depreciation (also known as capital consumption allowance).

It is derived from Gross National Product (GNP) by subtracting the depreciation of capital goods.

NNP = GNP − Depreciation

Features of NNP:

  • Reflects Net Output: It shows the net production of an economy after maintaining the existing capital stock.

  • Depreciation-Adjusted: More accurate than GNP or GDP because it adjusts for capital consumption.

  • Residents’ Contribution: Includes production by nationals both domestically and abroad.

  • Indicates Sustainability: Provides insight into how sustainable a country’s production is over time.

Example

Let’s say:

  • GNP of a country = ₹280 lakh crore

  • Depreciation = ₹30 lakh crore

Then:

NNP = ₹280 − ₹30 = ₹250 lakh crore

If Indirect Taxes = ₹12 lakh crore, Subsidies = ₹2 lakh crore:

Then:

NNPFC = ₹250 − ₹12 + ₹2 = ₹240 lakh crore

This ₹240 lakh crore is also called the National Income.

D. Personal Income (PI)

Personal Income refers to the total income received by individuals or households in a country from all sources before the payment of personal taxes. It includes all earnings from wages, salaries, investments, rents, interest, and transfer payments such as pensions, unemployment benefits, and subsidies.

In simple terms, Personal Income is the income available to individuals before paying taxes, but after adding transfer incomes and excluding undistributed profits and other non-receivable incomes.

Formula to Calculate Personal Income

Personal Income = National Income − Corporate Taxes − Undistributed Corporate Profits + Transfer Payments

Where:

  • National Income (NI) is the total income earned by a country’s residents.
  • Corporate Taxes are taxes paid by companies on their profits.
  • Undistributed Corporate Profits are profits retained by companies.
  • Transfer Payments include pensions, subsidies, and social security benefits.

Components of Personal Income:

  • Wages and Salaries: Earnings from employment.

  • Rent: Income from letting out property or land.

  • Interest: Returns from savings or investments in bonds.

  • Dividends: Income from shares in corporations.

  • Transfer Payments: Pensions, unemployment benefits, welfare payments, etc.

  • Proprietors’ Income: Profits from unincorporated businesses.

Importance of Personal Income:

  • Indicator of Economic Well-Being: Personal Income reflects how much money people actually receive, indicating living standards and household purchasing power.
  • Guides Taxation Policies: Governments use PI to design progressive tax policies and to decide on tax brackets for individuals.
  • Helps in Consumption Analysis: Since consumption is closely linked with income, PI helps in forecasting demand patterns and consumer spending trends.
  • Useful in Social Welfare Planning: Helps to identify income disparities and plan welfare programs such as subsidies or unemployment benefits.

E. Personal Disposable Income (PDI)

Personal Disposable Income (PDI) refers to the amount of money left with individuals or households after paying all personal direct taxes such as income tax. It is the net income available for consumption and savings.

In simple terms, PDI = Personal Income – Personal Taxes.

It represents the real purchasing power of households and is a crucial indicator of consumer behavior and economic demand.

Components of PDI:

  • Wages and Salaries – After-tax income from employment.

  • Transfer Payments – Net of any taxes (e.g., pensions, unemployment benefits).

  • Investment Income – Interest, dividends, and rent received after taxes.

  • Proprietors’ Income – Profits earned by individuals in business, minus personal tax.

Importance of Personal Disposable Income:

  • Measures Purchasing Power: PDI directly reflects how much individuals can spend or save, making it a key driver of consumer demand in the economy.
  • Helps in Demand Forecasting: Analysts use PDI trends to predict changes in consumption patterns, which guide production and marketing strategies.
  • Supports Economic Planning: Government can design policies like stimulus packages or tax reliefs based on changes in PDI to boost spending.
  • Indicates Economic Welfare: Rising PDI is a sign of improved living standards, while declining PDI may indicate growing tax burdens or inflation effects.

F. Gross Value Added (GVA)

Gross Value Added (GVA) is a measure of the value added by various sectors of the economy in the production process. It represents the difference between the value of output and the value of intermediate consumption. GVA provides insights into the contribution of different sectors to the overall economy.

G. Gross National Income (GNI)

Gross National Income (GNI) measures the total income earned by a country’s residents, including both domestic and international sources. It includes GDP plus net income from abroad, such as remittances, interest, dividends, and other payments received from overseas.

H. Net National Income (NNI)

Net National Income (NNI) is derived from GNI by subtracting depreciation or the value of capital consumption. NNI reflects the net income generated by a country’s residents after accounting for the depreciation of capital assets.

I. Per Capita Income

Per Capita Income is calculated by dividing the total national income (such as GDP or GNI) by the population of the country. It represents the average income earned per person and serves as a measure of the standard of living and economic welfare.

Trends and Challenges:

India’s national income and its aggregates have witnessed significant growth and transformation over the years. However, the country faces various challenges:

  • Income Inequality

Disparities in income distribution persist, with a significant portion of the population facing poverty and economic deprivation.

  • Sectoral Disparities

There are wide gaps in development and productivity across different sectors and regions, with disparities between rural and urban areas.

  • Unemployment and Underemployment

India grapples with high levels of unemployment and underemployment, particularly among youth and marginalized communities.

  • Infrastructure Deficit

Inadequate infrastructure, including transportation, energy, and digital connectivity, hampers economic growth and competitiveness.

  • Environmental Sustainability

Rapid economic growth has led to environmental degradation, pollution, and resource depletion, necessitating sustainable development practices.

  • Policy Reforms

Structural reforms and policy initiatives are required to address bottlenecks, promote investment, boost productivity, and enhance competitiveness.

Government Initiatives:

The Indian government has introduced various policies and initiatives to promote economic growth, employment generation, and inclusive development:

  • Make in India

A flagship initiative aimed at boosting manufacturing, promoting investment, and enhancing competitiveness.

  • Digital India

A program focused on digital infrastructure, e-governance, and digital empowerment to drive technological advancement and digital inclusion.

  • Skill India

A skill development initiative aimed at enhancing the employability of the workforce and bridging the skills gap.

  • Pradhan Mantri Jan Dhan Yojana (PMJDY)

A financial inclusion program aimed at expanding access to banking services, credit, and insurance for marginalized communities.

  • Goods and Services Tax (GST)

A comprehensive indirect tax reform aimed at simplifying the tax structure, promoting transparency, and boosting tax compliance.

Methods of Measuring National Income

  • Product Approach

In product approach, national income is measured as a flow of goods and services. Value of money for all final goods and services is produced in an economy during a year. Final goods are those goods which are directly consumed and not used in further production process. In our economy product approach benefits various sectors like forestry, agriculture, mining etc to estimate gross and net value.

  • Income Approach

In income approach, national income is measured as a flow of factor incomes. Income received by basic factors like labor, capital, land and entrepreneurship are summed up. This approach is also called as income distributed approach.

  • Expenditure Approach

This method is known as the final product method. In this method, national income is measured as a flow of expenditure incurred by the society in a particular year. The expenditures are classified as personal consumption expenditure, net domestic investment, government expenditure on goods and services and net foreign investment.

These three approaches to the measurement of national income yield identical results. They provide three alternative methods of measuring essentially the same magnitude.

Indifference Curve Analysis

Indifference curve analysis is basically an attempt to improve cardinal utility analysis (principle of marginal utility). The cardinal utility approach, though very useful in studying elementary consumer behavior, is criticized for its unrealistic assumptions vehemently. In particular, economists such as Edgeworth, Hicks, Allen and Slutsky opposed utility as a measurable entity. According to them, utility is a subjective phenomenon and can never be measured on an absolute scale. The disbelief on the measurement of utility forced them to explore an alternative approach to study consumer behavior. The exploration led them to come up with the ordinal utility approach or indifference curve analysis. Because of this reason, aforementioned economists are known as ordinalists. As per indifference curve analysis, utility is not a measurable entity. However, consumers can rank their preferences.

Indifference Curve Analysis Vs. Marginal Utility Approach

Let us look at a simple example. Suppose there are two commodities, namely apple and orange. The consumer has $10. If he spends entire money on buying apple, it means that apple gives him more satisfaction than orange. Thus, in indifference curve analysis, we conclude that the consumer prefers apple to orange. In other words, he ranks apple first and orange second. However, in cardinal or marginal utility approach, the utility derived from apple is measured (for example, 10 utils). Similarly, the utility derived from orange is measured (for example, 5 utils). Now the consumer compares both and prefers the commodity that gives higher amount of utility. Indifference curve analysis strictly says that utility is not a measurable entity. What we do here is that we observe what the consumer prefers and conclude that the preferred commodity (apple in our example) gives him more satisfaction. We never try to answer ‘how much satisfaction (utility)’ in indifference curve analysis.

Assumptions

Theories of economics cannot survive without assumptions and indifference curve analysis is no different. The following are the assumptions of indifference curve analysis:

  • Rationality

The theory of indifference curve studies consumer behavior. In order to derive a plausible conclusion, the consumer under consideration must be a rational human being. For example, there are two commodities called ‘A’ and ‘B’. Now the consumer must be able to say which commodity he prefers. The answer must be a definite. For instance – ‘I prefer A to B’ or ‘I prefer B to A’ or ‘I prefer both equally’. Technically, this assumption is known as completeness or trichotomy assumption.

  • Consistency

Another important assumption is consistency. It means that the consumer must be consistent in his preferences. For example, let us consider three different commodities called ‘A’, ‘B’ and ‘C’. If the consumer prefers A to B and B to C, obviously, he must prefer A to C. In this case, he must not be in a position to prefer C to A since this decision becomes self-contradictory.

Symbolically,

If A > B, and B > c, then A > C.

  • More Goods to Less

The indifference curve analysis assumes that consumer always prefers more goods to less. Suppose there are two bundles of commodities – ‘A’ and ‘B’. If bundle A has more goods than bundle B, then the consumer prefers bundle A to B.

  • Substitutes and Complements

In indifference curve analysis, there exist substitutes and complements for the goods preferred by the consumer. However, in marginal utility approach, we assume that goods under consideration do not have substitutes and complements.

  • Income and Market Prices

Finally, the consumer’s income and prices of commodities are fixed. In other words, with given income and market prices, the consumer tries to maximize utility.

  • Indifference Schedule

An indifference schedule is a list of various combinations of commodities that give equal satisfaction or utility to consumers. For simplicity, we have considered only two commodities, ‘X’ and ‘Y’, in our Table 1. Table 1 shows various combinations of X and Y; however, all these combinations give equal satisfaction (k) to the consumer.

Table 1: Indifference Schedule

Combinations X (Oranges) Y (Apples) Satisfaction
A 2 15 k
B 5 9 k
C 7 6 k
D 17 2 k

You can construct an indifference curve from an indifference schedule in the same way you construct a demand curve from a demand schedule.

On the graph, the locus of all combinations of commodities (X and Y in our example) forms an indifference curve (figure 1). Movement along the indifference curve gives various combinations of commodities (X and Y); however, yields same level of satisfaction. An indifference curve is also known as iso utility curve (“iso” means same). A set of indifference curves is known as an indifference map.

Marginal Rate of Substitution

Marginal rate of substitution is an eminent concept in the indifference curve analysis. Marginal rate of substitution tells you the amount of one commodity the consumer is willing to give up for an additional unit of another commodity. In our example (table 1), we have considered commodity X and Y. Hence, the marginal rate of substitution of X for Y (MRSxy) is the maximum amount of Y the consumer is willing to give up for an additional unit of X. However, the consumer remains on the same indifference curve.

In other words, the marginal rate of substitution explains the tradeoff between two goods.

Diminishing marginal rate of substitution

From table 1 and figure 1, we can easily explain the concept of diminishing marginal rate of substitution. In our example, we substitute commodity X for commodity Y. Hence, the change in Y is negative (i.e., -ΔY) since Y decreases.

Thus, the equation is

MRSxy = -ΔY/ΔX and

MRSyx = -ΔX/ΔY

However, convention is to ignore the minus sign; hence,

MRSxy = ΔY/ΔX

In figure 1, X denotes oranges and Y denotes apples. Points A, B, C and D indicate various combinations of oranges and apples.

In this example, we have the following marginal rate of substitution:

MRSx for y between A and B: AA­­1/A1B = 6/3 = 2.0

MRSx for y between B and C: BB­­1/B1C = 3/2 = 1.5

MRSx for y between C and D: CC­­1/C1D = 4/10 = 0.4

Thus, MRSx for y diminishes for every additional units of X. This is the principle of diminishing marginal rate of substitution.

Law of Demand

Demand theory is a principle relating to the relationship between consumer demand for goods and services and their prices. Demand theory forms the basis for the demand curve, which relates consumer desire to the amount of goods available. As more of a good or service is available, demand drops and so does the equilibrium price.

Demand is the quantity of a good or service that consumers are willing and able to buy at a given price in a given time period. People demand goods and services in an economy to satisfy their wants, such as food, healthcare, clothing, entertainment, shelter, etc. The demand for a product at a certain price reflects the satisfaction that an individual expects from consuming the product. This level of satisfaction is referred to as utility and it differs from consumer to consumer. The demand for a good or service depends on two factors:

  • Its utility to satisfy a want or need.
  • The consumer’s ability to pay for the good or service. In effect, real demand is when the readiness to satisfy a want is backed up by the individual’s ability and willingness to pay.

Built into demand are factors such as consumer preferences, tastes, choices, etc. Evaluating demand in an economy is, therefore, one of the most important decision-making variables that a business must analyze if it is to survive and grow in a competitive market. The market system is governed by the laws of supply and demand, which determine the prices of goods and services. When supply equals demand, prices are said to be in a state of equilibrium. When demand is higher than supply, prices increase to reflect scarcity. Conversely, when demand is lower than supply, prices fall due to the surplus.

The law of demand introduces an inverse relationship between price and demand for a good or service. It simply states that as the price of a commodity increases, demand decreases, provided other factors remain constant. Also, as the price decreases, demand increases. This relationship can be illustrated graphically using a tool known as the demand curve.

The demand curve has a negative slope as it charts downward from left to right to reflect the inverse relationship between the price of an item and the quantity demanded over a period of time. An expansion or contraction of demand occurs as a result of the income effect or substitution effect. When the price of a commodity falls, an individual can get the same level of satisfaction for less expenditure, provided it’s a normal good. In this case, the consumer can purchase more of the goods on a given budget. This is the income effect. The substitution effect is observed when consumers switch from more costly goods to substitutes that have fallen in price. As more people buy the good with the lower price, demand increases.

Sometimes, consumers buy more or less of a good or service due to factors other than price. This is referred to as a change in demand. A change in demand refers to a shift in the demand curve to the right or left following a change in consumers’ preferences, taste, income, etc. For example, a consumer who receives an income raise at work will have more disposable income to spend on goods in the markets, regardless of whether prices fall, leading to a shift to the right of the demand curve.

The law of demand is violated when dealing with Giffen or inferior goods. Giffen goods are inferior goods that people consume more of as prices rise, and vice versa. Since a Giffen good does not have easily available substitutes, the income effect dominates the substitution effect.

Demand theory is one of the core theories of microeconomics. It aims to answer basic questions about how badly people want things, and how demand is impacted by income levels and satisfaction (utility). Based on the perceived utility of goods and services by consumers, companies adjust the supply available and the prices charged.

Law of Demand

The law of demand is one of the most fundamental concepts in economics. It works with the law of supply to explain how market economies allocate resources and determine the prices of goods and services that we observe in everyday transactions. The law of demand states that quantity purchased varies inversely with price. In other words, the higher the price, the lower the quantity demanded. This occurs because of diminishing marginal utility. That is, consumers use the first units of an economic good they purchase to serve their most urgent needs first, and use each additional unit of the good to serve successively lower valued ends.

  • The law of demand is a fundamental principle of economics which states that at a higher price consumers will demand a lower quantity of a good.
  • Demand is derived from the law of diminishing marginal utility, the fact that consumers use economic goods to satisfy their most urgent needs first.
  • A market demand curve expresses the sum of quantity demanded at each price across all consumers in the market.
  • Changes in price can be reflected in movement along a demand curve, but do not by themselves increase or decrease demand.
  • The shape and magnitude of demand shifts in response to changes in consumer preferences, incomes, or related economic goods, NOT to changes in price.

Understanding the Law of Demand

Economics involves the study of how people use limited means to satisfy unlimited wants. The law of demand focuses on those unlimited wants. Naturally, people prioritize more urgent wants and needs over less urgent ones in their economic behavior, and this carries over into how people choose among the limited means available to them. For any economic good, the first unit of that good that a consumer gets their hands on will tend to be put to use to satisfy the most urgent need the consumer has that that good can satisfy.

For example, consider a castaway on a desert island who obtains a six pack of bottled, fresh water washed up on shore. The first bottle will be used to satisfy the castaway’s most urgently felt need, most likely drinking water to avoid dying of thirst. The second bottle might be used for bathing to stave off disease, an urgent but less immediate need. The third bottle could be used for a less urgent need such as boiling some fish to have a hot meal, and on down to the last bottle, which the castaway uses for a relatively low priority like watering a small potted plant to keep him company on the island.

In our example, because each additional bottle of water is used for a successively less highly valued want or need by our castaway, we can say that the castaway values each additional bottle less than the one before. Similarly, when consumers purchase goods on the market each additional unit of any given good or service that they buy will be put to a less valued use than the one before, so we can say that they value each additional unit less and less. Because they value each additional unit of the good less, they are willing to pay less for it. So the more units of a good consumers buy, the less they are willing to pay in terms of the price.

By adding up all the units of a good that consumers are willing to buy at any given price we can describe a market demand curve, which is always downward-sloping, like the one shown in the chart below. Each point on the curve (A, B, C) reflects the quantity demanded (Q) at a given price (P). At point A, for example, the quantity demanded is low (Q1) and the price is high (P1). At higher prices, consumers demand less of the good, and at lower prices, they demand more.

Factors Affecting Demand

The shape and position of the demand curve can be impacted by several factors. Rising incomes tend to increase demand for normal economic goods, as people are willing to spend more. The availability of close substitute products that compete with a given economic good will tend to reduce demand for that good, since they can satisfy the same kinds of consumer wants and needs. Conversely, the availability of closely complementary goods will tend to increase demand for an economic good, because the use of two goods together can be even more valuable to consumers than using them separately, like peanut butter and jelly. Other factors such as future expectations, changes in background environmental conditions, or change in the actual or perceived quality of a good can change the demand curve, because they alter the pattern of consumer preferences for how the good can be used and how urgently it is needed.

Demand theory objectives

  • Forecasting sales
  • Ma­nipulating demand
  • Appraising salesmen’s performance for setting their sales quotas
  • Watching the trend of the company’s competi­tive position.

Of these the first two are most im­portant and the last two are ancillary to the main economic problem of planning for profit.

1. Forecasting Demand

Forecasting refers to predicting the future level of sales on the basis of current and past trends. This is perhaps the most important use of demand stud­ies. True, sales forecast is the foundation for plan­ning all phases of the company’s operations. There­fore, purchasing and capital budget (expenditure) programmes are all based on the sales forecast.

2. Manipulating Demand

Sales forecasting is most passive. Very few com­panies take full advantage of it as a technique for formulating business plans and policies. However, “management must recognize the degree to which sales are a result only of the external economic environment but also of the action of the company itself.

Sales volumes do differ, “depending upon how much money is spent on advertising, what price policy is adopted, what product improve­ments are made, how accurately salesmen and sales efforts are matched with potential sales in the various territories, and so forth”.

Often advertising is intended to change consumer tastes in a manner favourable to the advertiser’s product. The efforts of so-called ‘hidden persuaders’ are directed to ma­nipulate people’s ‘true’ wants. Thus sales forecasts should be used for estimating the consequences of other plans for adjusting prices, promotion and/or products.

Importance of Demand Analysis

  • Business Forecasting

Demand analysis is vital for forecasting future sales. It helps businesses estimate the quantity of a product that consumers will likely purchase over a specific period. Accurate forecasts enable companies to plan production schedules, manage inventory, allocate resources efficiently, and avoid underproduction or overproduction. This proactive planning improves operational efficiency and reduces costs. Demand forecasting also helps firms adapt to seasonal changes, market trends, and economic fluctuations, ensuring they remain responsive to consumer needs and market conditions.

  • Pricing Policy Formulation

Understanding demand is essential for determining the most effective pricing strategy. Through demand analysis, firms can identify how sensitive consumers are to price changes (price elasticity of demand). If demand is inelastic, companies may raise prices without a significant drop in sales. If it is elastic, firms must remain competitive with pricing. Analyzing demand patterns helps in setting optimal prices that balance profitability with consumer satisfaction, ensuring maximum revenue without alienating potential buyers.

  • Efficient Resource Allocation

Demand analysis aids in the optimal allocation of limited resources. By knowing which products or services are in high demand, businesses can prioritize investments, labor, and raw materials accordingly. This ensures resources are not wasted on low-demand items. For example, if demand analysis shows growing interest in electric vehicles, manufacturers may divert resources from traditional models to electric production, leading to better financial returns and strategic growth.

  • Marketing and Sales Strategy Development

An effective marketing plan depends on a deep understanding of consumer demand. Demand analysis reveals who the buyers are, what they need, and how much they are willing to spend. Businesses can tailor promotions, distribution channels, and product features to match demand patterns. Targeted campaigns and personalized customer engagement strategies become more effective when rooted in accurate demand insights, leading to higher conversion rates and customer loyalty.

  • Product Planning and Development

Demand analysis supports product innovation and development decisions. It helps firms identify unmet needs and emerging trends in the market. By studying demand data, companies can decide whether to introduce new products, discontinue existing ones, or modify features to meet changing customer preferences. This reduces the risk of product failure and increases the chances of launching offerings that are relevant, timely, and well-received by consumers.

  • Investment Decision-Making

Before investing in new plants, equipment, or market expansion, companies need to assess whether future demand justifies such expenditure. Demand analysis provides the necessary insights to evaluate potential returns on investment. For example, if demand is expected to grow significantly in a region, it may warrant establishing a new facility there. This minimizes financial risk and aligns investment decisions with long-term market opportunities and consumer behavior.

  • Helps Government and Policy Makers

Governments and policy makers use demand analysis to make informed decisions about infrastructure, subsidies, taxes, and social welfare programs. By understanding what goods and services are in high demand, governments can align public spending with citizen needs. Demand insights also aid in controlling inflation, managing subsidies, and framing import-export policies. For instance, demand data for housing or healthcare helps governments prioritize urban development and public service improvements.

  • Risk Management and Contingency Planning

Demand analysis helps businesses identify potential risks associated with market fluctuations. By studying demand trends, companies can anticipate downturns, supply disruptions, or changing customer preferences. This allows them to develop contingency plans, diversify offerings, or explore new markets in advance. For example, if a drop in demand for fossil fuels is predicted, energy firms can pivot toward renewables. Thus, demand analysis minimizes uncertainty and enhances long-term sustainability.

Law of Diminishing Marginal utility

Law of Diminishing Marginal Utility states that as a person consumes additional units of a good or service, the satisfaction (utility) derived from each successive unit decreases, assuming all other factors remain constant. Initially, the first few units provide significant satisfaction, but as consumption increases, the utility of each extra unit diminishes. For example, the first slice of pizza may bring great joy, but by the fifth or sixth slice, the additional satisfaction reduces. This principle underlies consumer behavior and helps explain demand curves, as consumers are less willing to pay the same price for additional units of a product.

Assumptions:

Following are the assumptions of the law of diminishing marginal utility.

  1. The utility is measurable and a person can express the utility derived from a commodity in qualitative terms such as 2 units, 4 units and 7 units etc.
  2. A rational consumer aims at the maximization of his utility.
  3. It is necessary that a standard unit of measurement is constant
  4. A commodity is being taken continuously. Any gap between the consumption of a commodity should be suitable.
  5. There should be proper units of a good consumed by the consumer.
  6. It is assumed that various units of commodity homogeneous in characteristics.
  7. The taste of the consumer remains same during the consumption o the successive units of commodity.
  8. Income of the consumer remains constant during the operation of the law of diminishing marginal utility.
  9. It is assumed that the commodity is divisible.
  • There should be not change in fashion. For example, if there is a fashion of lifted shirts, then the consumer may have no utility in open shirts.
  • It is assumed that the prices of the substitutes do not change. For example, the demand for CNG increases due to rise in the prices of petroleum and these price changes effect the utility of CNG.

Explanation with Schedule and Diagram:

We assume that a man is very thirsty. He takes the glasses of water successively. The marginal utility of the successive glasses of water decreases, ultimately, he reaches the point of satiety. After this point the marginal utility becomes negative, if he is forced further to take a glass of water. The behavior of the consumer is indicated in the following schedule:

Units of commodity Marginal utility Total utility
1st glass 10 10
2nd glass 8 18
3rd glass 6 24
4th glass 4 28
5th glass 2 30
6th glass 0 30
7th glass -2 28

On taking the 1st glass of water, the consumer gets 10 units of utility, because he is very thirsty. When he takes 2nd glass of water, his marginal utility goes down to 8 units because his thirst has been partly satisfied. This process continues until the marginal utility drops down to zero which is the saturation point. By taking the seventh glass of water, the marginal utility becomes negative because the thirst of the consumer has already been fully satisfied.

The law of diminishing marginal utility can be explained by the following diagram drawn with the help of above schedule:

9.1.png

In the above figure, the marginal utility of different glasses of water is measured on the y-axis and the units (glasses of water) on X-axis. With the help of the schedule, the points A, B, C, D, E, F and G are derived by the different combinations of units of the commodity (glasses of water) and the marginal utility gained by different units of commodity. By joining these points, we get the marginal utility curve. The marginal utility curve has the downward negative slope. It intersects the X-axis at the point of 6th unit of the commodity. At this point “F” the marginal utility becomes zero. When the MU curve goes beyond this point, the MU becomes negative. So there is an inverse functional relationship between the units of a commodity and the marginal utility of that commodity.

Exceptions or Limitations:

The limitations or exceptions of the law of diminishing marginal utility are as follows:

  1. The law does not hold well in the rare collections. For example, collection of ancient coins, stamps etc.
  2. The law is not fully applicable to money. The marginal utility of money declines with richness but never falls to zero.
  3. It does not apply to the knowledge, art and innovations.
  4. The law is not applicable for precious goods.
  5. Historical things are also included in exceptions to the law.
  6. Law does not operate if consumer behaves in irrational manner. For example, drunkard is said to enjoy each successive peg more than the previous one.
  7. Man is fond of beauty and decoration. He gets more satisfaction by getting the above merits of the commodities.
  8. If a dress comes in fashion, its utility goes up. On the other hand its utility goes down if it goes out of fashion.
  9. The utility increases due to demonstration. It is a natural element.

Importance of the Law of Diminishing Marginal Utility:

  1. By purchasing more of a commodity the marginal utility decreases. Due to this behaviour, the consumer cuts his expenditures to that commodity.
  2. In the field of public finance, this law has a practical application, imposing a heavier burden on the rich people.
  3. This law is the base of some other economic laws such as law of demand, elasticity of demand, consumer surplus and the law of substitution etc.
  4. The value of commodity falls by increasing the supply of a commodity. It forms a basis of the theory of value. In this way prices are determined

Equi Marginal Utility

Equi-Marginal Principle (also known as the principle of equal marginal utility or the law of equi-marginal utility) is a fundamental concept in economics that helps individuals and businesses maximize satisfaction or profit. According to this principle, resources should be allocated in such a way that the marginal utility or marginal returns from each resource are equal across all possible uses.

In other words, whether a consumer is trying to maximize their utility or a firm is trying to maximize profit, they will distribute their limited resources (money, labor, time, etc.) among various alternatives so that the additional (marginal) benefit derived from the last unit of resource used in each alternative is equal.

Key Elements of the Equi-Marginal Principle:

  1. Marginal Utility:

Marginal utility refers to the additional satisfaction or benefit that a person receives from consuming an additional unit of a good or service. As more of a good is consumed, the marginal utility usually decreases, a concept known as diminishing marginal utility.

  1. Marginal Productivity/Returns:

In business, marginal productivity or marginal returns refer to the additional output that can be obtained by using an additional unit of input. Like marginal utility, marginal returns also generally diminish as more units of input are added.

  1. Optimization:

The equi-marginal principle is about optimization. Consumers aim to allocate their resources (income) in such a way that the marginal utility per unit of money spent is equal for all goods. Similarly, firms allocate inputs like labor and capital to maximize profit, ensuring that the marginal returns from each input are equal across all uses.

Formula for the Equi-Marginal Principle

For consumers: The formula for maximizing utility using the equi-marginal principle is as follows:

8.2

Example: Allocation of Consumer Budget

Let’s assume a consumer has a budget of $100 to spend on two goods, A and B. The consumer’s goal is to allocate their budget in such a way that the total utility derived from consuming both goods is maximized.

Table of Marginal Utility and Price:

Units Consumed Marginal Utility of A (MUA​) Price of A (PA​) MUA​/PA​ Marginal Utility of B (MUB​) Price of B (PB​) MUB​/PB​
1 20 $10 2 24 $8 3
2 18 $10 1.8 20 $8 2.5
3 16 $10 1.6 16 $8 2
4 14 $10 1.4 12 $8 1.5
5 12 $10 1.2 8 $8 1

From the table, we can see the marginal utility per dollar spent on each good for various levels of consumption.

Allocation Process:

  1. Initially, the consumer will compare the MU/P ratios for both goods.
  2. The consumer will spend their first dollar on Good B because it provides a higher marginal utility per dollar (3) than Good A (2).
  3. After consuming the first unit of Good B, the consumer will compare the MU/P ratios again. Since MUB/PB=2.5 is still higher than MUA/PA=2, the consumer will purchase another unit of Good B.
  4. This process will continue until the MU/P ratios for both goods are equal or the consumer’s budget is exhausted.

In this case, the consumer might end up purchasing 2 units of Good A and 3 units of Good B, at which point the marginal utility per dollar for both goods becomes approximately equal, maximizing their total utility.

Example: Firm’s Input Allocation

Let’s assume a firm has two inputs: labor (L) and capital (K). The firm wants to allocate these inputs to maximize profit, with the marginal product and cost data as follows:

Input Marginal Product of Labor (MPL​) Cost of Labor (CL) MPL​/CL​ Marginal Product of Capital (MPK​) Cost of Capital (CK​) MPK​/CK​
1 50 $10 5 80 $20 4
2 40 $10 4 70 $20 3.5
3 30 $10 3 60 $20 3
4 20 $10 2 50 $20 2.5
5 10 $10 1 40 $20 2

The firm’s goal is to allocate labor and capital in such a way that the marginal product per unit of cost is equal for both inputs.

Allocation Process:

  1. Initially, the firm compares the MP/C ratios for labor and capital.
  2. The firm will allocate its first dollar towards labor, where MPL/CL=5 is greater than MPK/CK=4.
  3. After allocating more resources, the firm will continue comparing the ratios.
  4. The firm will keep allocating resources until the marginal product per unit cost for both labor and capital is equal.

In this case, the optimal allocation would involve using 2 units of labor and 1 unit of capital, where the marginal products per unit cost are equal (4), maximizing the firm’s profit.

Importance of the Equi-Marginal Principle:

  • Efficient Allocation:

The equi-marginal principle ensures the efficient allocation of resources, whether for consumers aiming to maximize utility or firms aiming to maximize profit. By allocating resources where they provide the highest marginal benefit, both individuals and businesses can make the best possible use of their limited resources.

  • Economic Decision-Making:

This principle is a key component of rational decision-making in economics. It helps in determining the optimal quantity of goods to consume, the best mix of inputs to use in production, or even the best way to allocate time among different activities.

  • Flexibility:

The equi-marginal principle can be applied across various fields of economics, from consumer theory and production theory to cost minimization and utility maximization.

Explanation of the Law:

In order to get maximum satisfaction out of the funds we have, we carefully weigh the satisfaction obtained from each rupee ‘had we spend If we find that a rupee spent in one direction has greater utility than in another, we shall go on spending money on the former commodity, till the satisfaction derived from the last rupee spent in the two cases is equal.

It other words, we substitute some units of the commodity of greater utility tor some units of the commodity of less utility. The result of this substitution will be that the marginal utility of the former will fall and that of the latter will rise, till the two marginal utilities are equalized. That is why the law is also called the Law of Substitution or the Law of equimarginal Utility.

Suppose apples and oranges are the two commodities to be purchased. Suppose further that we have got seven rupees to spend. Let us spend three rupees on oranges and four rupees on apples. What is the result? The utility of the 3rd unit of oranges is 6 and that of the 4th unit of apples is 2. As the marginal utility of oranges is higher, we should buy more of oranges and less of apples. Let us substitute one orange for one apple so that we buy four oranges and three apples.

Now the marginal utility of both oranges and apples is the same, i.e., 4. This arrangement yields maximum satisfaction. The total utility of 4 oranges would be 10 + 8 + 6 + 4 = 28 and of three apples 8 + 6 + 4= 18 which gives us a total utility of 46. The satisfaction given by 4 oranges and 3 apples at one rupee each is greater than could be obtained by any other combination of apples and oranges. In no other case does this utility amount to 46. We may take some other combinations and see.

We thus come to the conclusion that we obtain maximum satisfaction when we equalize marginal utilities by substituting some units of the more useful for the less useful commodity. We can illustrate this principle with the help of a diagram.

Diagrammatic Representation:

In the two figures given below, OX and OY are the two axes. On X-axis OX are represented the units of money and on the Y-axis marginal utilities. Suppose a person has 7 rupees to spend on apples and oranges whose diminishing marginal utilities are shown by the two curves AP and OR respectively.

The consumer will gain maximum satisfaction if he spends OM money (3 rupees) on apples and OM’ money (4 rupees) on oranges because in this situation the marginal utilities of the two are equal (PM = P’M’). Any other combination will give less total satisfaction.

Let the purchase spend MN money (one rupee) more on apples and the same amount of money, N’M'( = MN) less on oranges. The diagram shows a loss of utility represented by the shaded area LN’M’P’ and a gain of PMNE utility. As MN = N’M’ and PM=P’M’, it is proved that the area LN’M’P’ (loss of utility from reduced consumption of oranges) is bigger than PMNE (gain of utility from increased consumption of apples). Hence the total utility of this new combination is less.

We then, conclude that no other combination of apples and oranges gives as great a satisfaction to the consumer as when PM = P’M’, i.e., where the marginal utilities of apples and oranges purchased are equal, with given amour, of money at our disposal.

Limitations of the Law of Equi-marginal Utility

Like other economic laws, the law of equimarginal utility too has certain limitations or exceptions. The following are the main exception.

(i) Ignorance

If the consumer is ignorant or blindly follows custom or fashion, he will make a wrong use of money. On account of his ignorance he may not know where the utility is greater and where less. Thus, ignorance may prevent him from making a rational use of money. Hence, his satisfaction may not be the maximum, because the marginal utilities from his expenditure can­not be equalised due to ignorance.

(ii) Inefficient Organisation

In the same manner, an incompetent organ­iser of business will fail to achieve the best results from the units of land, labour and capital that he employs. This is so because he may not be able to divert expenditure to more profitable channels from the less profitable ones.

(iii) Unlimited Resources

The law has obviously no place where this resources are unlimited, as for example, is the case with the free gifts of nature. In such cases, there is no need of diverting expenditure from one direction to another.

(iv) Hold of Custom and Fashion

A consumer may be in the strong clutches of custom, or is inclined to be a slave of fashion. In that case, he will not be able to derive maximum satisfaction out of his expenditure, because he cannot give up the consumption of such commodities. This is specially true of the conventional necessaries like dress or when a man is addicted to some into­xicant.

(v) Frequent Changes in Prices

Frequent changes in prices of different goods render the observance of the law very difficult. The consumer may not be able to make the necessary adjustments in his expenditure in a constantly changing price situation.

error: Content is protected !!