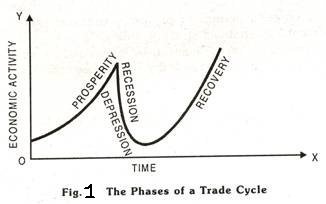
Recent World Trade Scenario of Trading

The global economy has been on a subdued growth path since the advent of ‘Financial Crisis’ of 2008, and has now started to show signs of global recovery. In October 2017, the IMF projected world GDP growth to pick up from 3.2% in 2016 to 3.6% in 2017, and further to 3.7% in 2018. Economic activity has also picked up in developed market economies such as the US, UK, and Europe. There is a rise in global demand, which is expected to remain buoyant. The developing and emerging market economies have seen mixed economic performance. The pickup in momentum of global demand has been led by investment demand. More specifically, production of both consumer durables and capital goods have rebounded since the second half of 2016. Some factors that have contributed to these developments include global recovery in investments, led by infrastructure and real estate investment in China; firming global commodity prices; and end of an inventory cycle in US.

On the back of this global recovery, the world is witnessing a pickup in global trade. The Asian Development Bank, in its recent update1, noted that most of the emerging economies (excluding China) are witnessing a rebound in manufacturing exports, “particularly in electronics, where foreign direct investment has been strengthening”. The economies of south-east Asia are also gaining from increased activity along cross-border manufacturing supply chains. The World Trade Organization (WTO), has recently in its September 2017 press release upgraded the growth forecast for global trade in the year 2017, from 2.4% to 3.6%. Particularly, in the first half of 2017, world trade rose by a robust 4.2% (year on year), driven by exports of developing economies which grew by 5.9 percent as compared to a growth of 3.1 percent witnessed in exports of developed economies. Imports by developed and developing economies also increased by 2.1% and 6.9%, respectively. Moreover, the ratio of trade growth to world GDP growth is also set to recover and reach around 1.3, which will be at a highest level in last 5 years.

This pickup in global growth which has boosted demand for imports, spurred intra-Asia-trade as demand was transmitted through global value chains. In this current scenario, even though India is witnessing a mild rebound in its exports, there are concerns that merchandise exports in Asia’s second largest economy are lagging behind other major Asian economies. Today global attention is riveted on emerging and developing economies and especially Asia, driven by the continent’s growing appetite for industrial investment, burgeoning infrastructural requirements and its quest for expanding trade.

Indian economy and its trade scenario

India’s growth story, especially since the start of the 21st century has been remarkable. The Indian economy has come a long way since its economic liberalisation, and is amongst the fastest growing major economies of the world today. While India witnessed a relatively moderate growth during the period 2011-12 to 2013-14, on account of the global economic slowdown, the economy recorded a robust growth averaging 7.5 percent during the period 2014-15 to 2016-17, much above the growth rate of other emerging and developing economies. In the last one year, it has seen major economic policy developments with the introduction of Goods and Services Tax (GST) and demonetization of higher currency notes.

Even though the GDP growth in the first quarter of current fiscal has fallen down to a low of 5.7%, its lowest since March 2014, it is widely believed that the economy has bottomed out and it can only rise from here. According to the IMF, India is expected to grow at 7.2% in this fiscal year, aided by higher government spending and a pickup in the service sector performance.

Fueling India’s growth through international trade

In recent years, India’s robust growth has been driven by the dynamic private sector. An encouraging phenomenon that has been witnessed has been the emergence of a large number of investment driven small and medium enterprises with immense potential for growth. A large number of such enterprises have also endeavoured to expand their business operations overseas. The Indian economy is more globalized than we could imagine. As a result, India’s foreign trade has seen a multi-fold increase, since liberalization of the economy.

Accordingly, there have been significant structural shifts not only in the product basket, but also in the geographical composition of India’s foreign trade. The opening up of Indian economy led to a massive increase in the foreign trade, which aided in sustained GDP growth over last two decades. During the last 25 years Indian exports have increased by 17 times and imports by 19 times. India’s share in global merchandise exports has risen from 0.6 percent in early 1990s to 1.7 percent in 2016, and similarly the share of imports has risen from 0.6 percent to 2.4 percent during the same period. India’s trade to GDP ratio, a measure of an economy’s openness and integration into the global economy, has witnessed a phenomenal increase over the last few decades. Foreign trade which constituted around 13-15 percent of India’s GDP in the early nineties, peaked at 55 percent in 2012- 13 and today accounts for around 40 percent in 2016-17. India also, ranked as the 20th largest exporter and 14th largest importer in the world in 2016.

Concomitantly, India’s engagement with Global Value Chains (GVCs), which have become dominant feature of world trade, has increased significantly since 1990s. In manufacturing sector, especially for electrical and optical equipment, India is more integrated with the south east Asian region, while for services the integration in GVCs is with western countries like the US and UK. According to an OECD estimate, developing economies with fastest growing GVC participation have experienced a GDP per capita growth rate percent above average.

India has set an ambitious target of achieving exports worth US $ 900 billion by 2020, while accounting for a share of 3.5 percent of global exports4. In the current global macroeconomic scenario, while it seems like a challenging task, concerted efforts would need to be made for India to be able to achieve its trade target and realign its foreign trade policy with the new global trading system.

While the global economic scenario is crucial, the domestic factors are no less important, when it comes to trade. India’s overall trade policy faces certain challenges viz. inadequate export diversification in terms of products and geographical distribution; insignificant involvement of a majority of states in exports; rationalisation of the tariff regime and export promotion schemes; and factor market reforms which are critically linked with export performance. These challenges not only affect the productivity and competitiveness of domestic firms but also restrict them from participating in global production networks.

(i) Integrating into and moving up the value chain

Most manufactured products, often high technology manufactured products, that are part of GVCs are infrastructure critical products whose parts are manufactured in several countries. A robust transport and connectivity network supported by fast entry/exit through port/customs is a precondition to making such products as delay may disrupt the entire value chain. There is a need for India to focus on expanding production capacity along with value addition, and moving up the value chain,while creating an enabling environment to account for a sizeable share in major leading global exports. This gain seven more significance given that India’s labour force is projected to swell by about 110 mn by 2020. The biggest challenge is to employ the surplus labour coming out of agriculture into industry and services.

(ii) Upscaling Manufacturing

The Make in India initiative is an important initiative of the Government of India, which envisages to promote India as a manufacturing hub and investment destination. There is need for highlighting the potential and stimulating the manufacturing sector through supporting mechanisms and conducive policy measures, including support for R&D, technology orientation and investment incentives. A Higher expenditure on R&D generally correlates with increase in high-technology exports, and increased local value addition. R&D expenditure as a percentage share of GDP in India has remained extremely low at less than1 percent, much lower even in comparison to other developing economies. Also, while we lay emphasis on the manufacturing sector and thereby on manufactured exports, it is also important to ensure an enabling environment and improving our competitiveness by investing in infrastructure such as better connectivity through roads and ports, coal availability, labour reforms and flexibility in factor markets.

(iii) Aligning India’s Export Capability in-Line with Global Import Demand

With regard to India’s exports, while merchandise exports have more than doubled over the period 2006-07 to 2016-17 from US$ 126 billion to more than US$276 billion, there remains huge potential for exports of select products to select countries in line with India’s export capability and import demand. There is need for identifying and aligning India’s export capability vis-à-vis global import demand. Such in-depth analysis has been the focus of research studies in Exim Bank. Comparative analyses of global trends in trade, undertaken in such studies have yielded interesting results.

To Conclude

All in all, a pick-up in global growth is expected to contribute to the revival of international trade, but the downside risks such as the possible adoption of protectionist trade policies by especially developed market economies, around the world weigh on the recovery of trade. As a result, there is an increasing need for India and other emerging market economies, relying on export led economic growth, to take a proactive stand for globalization and international trade.

There is a need to shift our focus from exporting what we can (or supply based), to items that are globally demanded. A demand-based export basket diversification approach could give a big push to exports. While India has made remarkable progress in the recent past, it facesan even more challenging global environment today. Itis certainly a daunting, yet possible, task to ensure that India repositions itself as an important driver of global economic growth.

Meaning of Correlation, Importance

Correlation, in the finance and investment industries, is a statistic that measures the degree to which two securities move in relation to each other. Correlations are used in advanced portfolio management, computed as the correlation coefficient, which has a value that must fall between -1.0 and +1.0

A perfect positive correlation means that the correlation coefficient is exactly 1. This implies that as one security moves, either up or down, the other security moves in lockstep, in the same direction. A perfect negative correlation means that two assets move in opposite directions, while a zero correlation implies no relationship at all.

For example, large-cap mutual funds generally have a high positive correlation to the Standard and Poor’s (S&P) 500 Index – very close to 1. Small-cap stocks have a positive correlation to that same index, but it is not as high – generally around 0.8.

However, put option prices and their underlying stock prices will tend to have a negative correlation. As the stock price increases, the put option prices go down. This is a direct and high-magnitude negative correlation.

  • Correlation is a statistic that measures the degree to which two variables move in relation to each other.
  • In finance, the correlation can measure the movement of a stock with that of a benchmark index, such as the Beta.
  • Correlation measures association, but does not tell you if x causes y or vice versa, or if the association is caused by some third (perhaps unseen) factor.

Importance of correlation Analysis

Correlation is very important in the field of Psychology and Education as a measure of relationship between test scores and other measures of performance. With the help of correlation, it is possible to have a correct idea of the working capacity of a person. With the help of it, it is also possible to have a knowledge of the various qualities of an individual.

After finding the correlation between the two qualities or different qualities of an individual, it is also possible to provide his vocational guidance. In order to provide educational guidance to a student in selection of his subjects of study, correlation is also helpful and necessary.

Correlation Statistics and Investing

The correlation between two variables is particularly helpful when investing in the financial markets. For example, a correlation can be helpful in determining how well a mutual fund performs relative to its benchmark index, or another fund or asset class. By adding a low or negatively correlated mutual fund to an existing portfolio, the investor gains diversification benefits.

In other words, investors can use negatively-correlated assets or securities to hedge their portfolio and reduce market risk due to volatility or wild price fluctuations. Many investors hedge the price risk of a portfolio, which effectively reduces any capital gains or losses because they want the dividend income or yield from the stock or security.

Correlation statistics also allows investors to determine when the correlation between two variables changes. For example, bank stocks typically have a highly-positive correlation to interest rates since loan rates are often calculated based on market interest rates. If the stock price of a bank is falling while interest rates are rising, investors can glean that something’s askew. If the stock prices of similar banks in the sector are also rising, investors can conclude that the declining bank stock is not due to interest rates. Instead, the poorly-performing bank is likely dealing with an internal, fundamental issue.

Various Phases of Trade Cycle

Trade Cycle, also known as the business cycle, refers to the recurring fluctuations in economic activity characterized by periods of expansion, peak, contraction, and trough. These cycles reflect the natural rhythm of economic growth and contraction within a market economy. During expansion phases, economic output, employment, and consumer spending increase, leading to prosperity. Peaks mark the highest point of economic activity. Contractions, or recessions, follow, characterized by decreased production, rising unemployment, and reduced consumer spending. Finally, troughs represent the lowest point of the cycle, before the economy begins to recover. Understanding trade cycles is crucial for policymakers, businesses, and investors to anticipate and manage the impacts of economic fluctuations on various sectors and stakeholders.

Four Phases of a Trade cycle are:

  1. Prosperity phase: Expansion or the upswing.
  2. Recessionary phase: A turn from prosperity to depression (or upper turning point).
  3. Depressionary phase: Contraction or downswing.
  4. Revival or recovery phase: The turn from depression to prosperity (or lower turning point).

The above four phases of a trade cycle are shown in Fig. 1. These phases are recurrent and follow a regular sequence.

Phases of a Trade Cycle

1. Expansion Phase:

The expansion phase marks the beginning of the trade cycle. It is characterized by increasing economic activity across various sectors of the economy. During this phase, several key indicators typically show positive trends:

  • Gross Domestic Product (GDP) Growth:

GDP, which measures the total value of goods and services produced within a country’s borders, tends to rise during the expansion phase. Increased production, consumer spending, and investment contribute to this growth.

  • Employment:

As economic activity expands, businesses experience rising demand for goods and services. This often leads to increased hiring to meet the growing demand, resulting in lower unemployment rates.

  • Consumer Spending:

Consumers tend to have more disposable income during periods of economic expansion, leading to increased spending on goods and services. This increased consumer demand further fuels economic growth.

  • Business Investment:

Businesses are more likely to invest in capital goods, such as machinery and equipment, during the expansion phase. Higher confidence in future economic prospects encourages firms to expand their productive capacity to meet growing demand.

  • Stock Market Performance:

Stock prices typically rise during the expansion phase as investors anticipate higher corporate profits and economic growth. Bull markets, characterized by rising stock prices, are common during this phase.

2. Peak Phase:

The peak phase represents the highest point of economic activity within the trade cycle. It is characterized by several key features:

  • Full Capacity Utilization:

During the peak phase, resources such as labor and capital are fully utilized as demand for goods and services reaches its highest levels. Production may be operating at or near maximum capacity.

  • Inflationary Pressures:

As demand outstrips supply during the peak phase, prices tend to rise, leading to inflationary pressures. This can be reflected in higher consumer prices, wage growth, and increased production costs.

  • Tight Labor Market:

With low unemployment rates and high demand for labor, competition for workers intensifies during the peak phase. This can lead to wage increases and labor shortages in certain industries.

  • Business Confidence:

Businesses may become increasingly optimistic about future economic prospects during the peak phase, leading to higher levels of investment and expansion plans.

  • Stock Market Volatility:

While stock prices may continue to rise during the peak phase, volatility often increases as investors become more cautious about the sustainability of economic growth.

3. Contraction Phase:

Following the peak phase, the economy enters the contraction phase, also known as a recession or downturn. This phase is characterized by declining economic activity and several negative trends:

  • GDP Contraction:

Economic output, as measured by GDP, begins to decline during the contraction phase as demand for goods and services weakens. This can be driven by factors such as reduced consumer spending, declining investment, and falling exports.

  • Rising Unemployment:

As businesses cut back on production and investment in response to weakening demand, unemployment rates tend to rise. Layoffs and hiring freezes become more common as companies adjust to the downturn.

  • Decreased Consumer Spending:

Consumer confidence often declines during the contraction phase, leading to reduced spending on discretionary goods and services. Consumers may prioritize essential purchases and cut back on non-essential items.

  • Declining Business Investment:

Businesses become more cautious about investing in new capital projects and expansion plans during the contraction phase. Uncertainty about future economic conditions and weak demand can lead to a decrease in business investment.

  • Stock Market Decline:

Stock prices typically fall during the contraction phase as investors react to negative economic news and uncertainty about future earnings prospects. Bear markets, characterized by falling stock prices, are common during recessions.

4. Trough Phase:

The trough phase represents the lowest point of the trade cycle and marks the end of the contraction phase. While economic conditions remain challenging, there are signs of stabilization and the beginning of recovery:

  • Stabilization of Economic Indicators:

Economic indicators such as GDP, employment, and consumer spending may stabilize or show signs of improvement during the trough phase. The rate of decline in economic activity begins to slow down.

  • Policy Responses:

Governments and central banks often implement monetary and fiscal policies to stimulate economic growth during the trough phase. These may include interest rate cuts, fiscal stimulus measures, and efforts to restore confidence in the financial system.

  • Inventory Rebuilding:

Businesses may start to rebuild inventories during the trough phase in anticipation of future demand. This can contribute to a gradual increase in production and economic activity.

  • Bottoming Out of Stock Market:

While stock prices may still be volatile during the trough phase, there may be signs that the market is bottoming out as investors anticipate a recovery in corporate earnings and economic growth.

  • Early Signs of Recovery:

Some sectors of the economy may begin to show signs of improvement during the trough phase, signaling the start of the recovery process. These early indicators can include increased consumer confidence, rising business investment, and stabilization in housing markets.

Trade Cycle: Introduction and Theories of Trade Cycle

Trade Cycle refers to fluctuations in economic activities specially in employment, output and income, prices, profits etc. It has been defined differently by different economists. According to Mitchell, “Business cycles are of fluctuations in the economic activities of organized communities. The adjective ‘business’ restricts the concept of fluctuations in activities which are systematically conducted on commercial basis.

Features of a Trade Cycle

  • A business cycle is synchronic. When cyclical fluctuations start in one sector it spreads to other sectors.
  • In a trade cycle, a period of prosperity is followed by a period of depression. Hence trade cycle is a wave like movement.
  • Business cycle is recurrent and rhythmic; prosperity is followed by depression and vice versa.
  • Trade cycle is cumulative and self-reinforcing. Each phase feeds on itself and creates further movement in the same direction.
  • Trade cycle is asymmetrical. The prosperity phase is slow and gradual and the phase of depression is rapid.
  • The business cycle is not periodical. Some trade cycles last for three or four years, while others last for six or eight or even more years.
  • The impact of a trade cycle is differential. It affects different industries in different ways.
  • Trade cycle is international in character. Through international trade, booms and depressions in one country are passed to other countries.

Theories of Trade Cycle

Many theories have been put forward from time to time to explain the phenomenon of trade cycles. These theories can be classified into non-monetary and monetary theories.

Non-Monetary Theories of Trade Cycle

(a) Sunspot Theory or Climatic Theory

It is the oldest theory of trade cycle. It is associated with W.S.Jevons and later on developed by H.C.Moore. According to this theory, the spot that appears on the sun influences the climatic conditions. When the spot appears, it will affect rainfall and hence agricultural crops.

When there is crop failure, that will result in depression. On the other hand, if the spot did not appear on the sun, rainfall is good leading to prosperity. Thus, the variations in climate are so regular that depression is followed by prosperity.

However, this theory is not accepted today. Trade cycle is a complex phenomenon and it cannot be associated with climatic conditions. If this theory is correct, then industrialised countries should be free from cyclical fluctuations. But it is the advanced, industrialised countries which are affected by trade cycles.

(b) Psychological Theory

This theory was developed by A.C. Pigou. He emphasized the role of psychological factor in the generation of trade cycles. According to Pigou, the main cause for trade cycle is optimism and pessimism among business people and bankers. During the period of good trade, entrepreneurs become optimistic which would lead to increase in production.

The feeling of optimism is spread to other. Hence investments are increased beyond limits and there is over production, which results in losses. Entrepreneurs become pessimistic and reduce their investment and production. Thus, fluctuations are due to optimism leading to prosperity and pessimism resulting depression.

Though there is an element of truth in this theory, this theory is unable to explain the occurrence of boom and starting of revival. Further this theory fails to explain the periodicity of trade cycle.

(c) Overinvestment Theory

Arthur Spiethoff and D.H. Robertson have developed the over investment theory. It is based on Say’s law of markets. It believes that over production in one sector leads to over production in other sectors. Suppose, there is over production and excess supply in one sector, that will result in fall in price and income of the people employed in that sector. Fall in income will lead to a decline in demand for goods and services produced by other sectors. This will create over production in other sectors.

Spiethoff has pointed out that over investment is the cause for trade cycle. Over investment is due to indivisibility of investment and excess supply of bank credit. He gives the example of a railway company which lays down one more track to avoid traffic congestion. But this may result in excess capacity because the additional traffic may not be sufficient to utilise the second track fully.

Over investment and overproduction are encouraged by monetary factors. If the banking system places more money in the hands of entrepreneurs, prices will increase. The rise in prices may induce the entrepreneurs to increase their investments leading to over-investment. Thus Prof. Robertson has successfully combined real and monetary factors to explain business cycle.

This theory is realistic in the sense that it considers over investment as the cause of trade cycle. But it has failed to explain revival.

(d) Over-Saving or Under Consumption Theory

This theory is the oldest explanation of the cyclical fluctuations. This theory has been formulated by Malthus, Marx and Hobson. According to this theory, depression is due to over-saving. In the modern society, there is great inequalities of income. Rich people have large income but their marginal propensity to consume is less.

Hence they save and invest which results in an increase in the volume of goods. This causes a general glut in the market. At the same time, as majority of the people are poor, they have low propensity to consume. Therefore, consumption will not increase. Increase in the supply of goods and decline in the demand create under consumption and hence over production.

This theory is not free from criticism. This theory explains only the turning point from prosperity to depression. It does not say anything about recovery. This theory assumes that the amount saved would be automatically invested. But this is not true. It pays too much attention on saving and too little on others.

(e) Keynes’ Theory of Trade Cycles

Keynes doesn’t develop a complete and pure theory of trade cycles. According to Keynes, effective demand is composed of consumption and investment expenditure. It is effective demand which determines the level of income and employment.

Therefore, changes in total expenditure i.e., consumption and investment expenditures, affect effective demand and this will bring about fluctuation in economic activity. Keynes believes that consumption expenditure is stable and it is the fluctuation in investment expenditure which is responsible for changes in output, income and employment.

Investment depends on rate of interest and marginal efficiency of capital. Since rate of interest is more or less stable, marginal efficiency of capital determines investment. Marginal efficiency of capital depends on two factors – prospective yield and supply price of the capital asset. An increase in MEC will create more employment, output and income leading to prosperity. On the other hand, a decline in MEC leads to unemployment and fall in income and output. It results in depression.

During the period of expansion businessmen are optimistic. MEC is rapidly increasing and rate of interest is sticky. So entrepreneurs undertake new investment. The process of expansion goes on till the boom is reached. As the process of expansion continues, cost of production increases, due to scarcity of factors of production. This will lead to a fall in MEC. Further, price of the product falls due to abundant supply leading to a decline in profits.

This leads to depression. As time passes, existing machinery becomes worn out and has to be replaced. Surplus stocks of goods are exhausted. As there is a fall in price of raw-materials and equipment, costs fall. Wages also go down. MEC increases leading to recovery. Keynes states that, “Trade cycle can be described and analyzed in terms of the fluctuations of the marginal efficiency of capital relatively to the rate of interest”.

The merit of Keynes’ theory lies in explaining the turning points-the lower and upper turning points of a trade cycle. The earlier economists considered the changes in the amount of credit given by banking system to be responsible for cyclical fluctuations. But for Keynes, the change in consumption function with its effect on MEC is responsible for trade cycle. Keynes, thus, has given a satisfactory explanation of the turning points of the trade cycle, “Keynes consumption function filled a serious gap and corrected a serious error in the previous theory of the business cycle”.

Critics have pointed out the weakness of Keynes’ theory. Firstly, according to Keynes the main cause for trade cycle is the fluctuations in MEC. But the term marginal efficiency of capital is vague. MEC depends on the expectations of the entrepreneur about future. In this sense, it is similar to that of Pigou’s psychological theory. He has ignored real factors.

Secondly, Keynes assumes that rate of interest is stable. But rate of interest does play an important role in decision making process of entrepreneurs.

Thirdly, Keynes does not explain periodicity of trade cycle. In a period of recession and depression, according to Keynes, rate of interest should be high due to strong liquidity preference. But, during this period, rate of interest is very low. Similarly during boom, rate of interest should be low because of weak liquidity preference; but actually the rate of interest is high.

(f) Schumpeter’s Innovation Theory

Joseph A. Schumpeter has developed innovation theory of trade cycles. An innovation includes the discovery of a new product, opening of a new market, reorganization of an industry and development of a new method of production. These innovations may reduce the cost of production and may shift the demand curve. Thus innovations may bring about changes in economic conditions.

Suppose, at the full employment level, an innovation in the form of a new product has been introduced. Innovation is financed by bank loans. As there is full employment already, factors of production have to be withdrawn from others to manufacture the new product. Hence, due to competition for factors of production costs may go up, leading to an increase in price.

When the new product becomes successful, other entrepreneurs will also produce similar products. This will result in cumulative expansion and prosperity. When the innovation is adopted by many, supernormal profits will be competed away. Firms incurring losses will go out of business. Employment, output and income fall resulting in depression.

Schumpeter’s theory has been criticised on the following grounds.

Firstly, Schumpter’s theory is based on two assumptions viz., full employment and that innovation is being financed by banks. But full employment is an unrealistic assumption, as no country in the world has achieved full employment. Further innovation is usually financed by the promoters and not by banks. Secondly, innovation is not the only cause of business cycle. There are many other causes which have not been analysed by Schumpter.

Monetary Theories of Trade Cycles

(a) Over-Investment Theory

Prof. Von Hayek in his books on “Monetary Theory and Trade Cycle” and “Prices and Production” has developed a theory of trade cycle. He has distinguished between equilibrium or natural rate of interest and market rate of interest. Market rate of interest is one at which demand for and supply of money are equal.

Equilibrium rate of interest is one at which savings are equal to investment. If both equilibrium rate of interest and market rate of interest are equal, there will be stability in the economy. If equilibrium rate of interest is higher than market rate of interest there will be prosperity and vice versa.

For instance, if the market rate of interest is lower than equilibrium rate of interest due to increase in money supply, investment will go up. The demand for capital goods will increase leading to a rise in price of these goods. As a result, there will be a diversion of resources from consumption goods industries to capital goods industries. Employment and income of the factors of production in capital goods industries will increase.

This will increase the demand for consumption goods. There will be competition for factors of production between capital goods and consumption good industries. Factor prices go up. Cost of production increases. At this time, banks will decide to reduce credit expansion. This will lead to rise in market rate of interest above the equilibrium rate of interest. Investment will fall; production declines leading to depression.

Hayek’s theory has certain weaknesses:-

  • It is not easy to transfer resources from capital goods industries to consumer goods industries and vice versa.
  • This theory does not explain all the phases of trade cycle.
  • It gives too much importance to rate of interest in determining investment. It has neglected other factors determining investment.
  • Hayek has suggested that the volume of money supply should be kept neutral to solve the problem of cyclical fluctuations. But this concept of neutrality of money is based on old quantity theory of money which has lost its validity.

(b) Hawtrey’s Monetary Theory

Prof. Hawtrey considers trade cycle to be a purely monetary phenomenon. According to him non-monetary factors like wars, strike, floods, drought may cause only temporary depression. Hawtrey believes that expansion and contraction of money are the basic causes of trade cycle. Money supply changes due to changes in rates of interest.

When rate of interest is reduced by banks, entrepreneurs will borrow more and invest. This causes an increase in money supply and rise in price leading to expansion. On the other hand, an increase in the rate of interest will lead to reduction in borrowing, investment, prices and business activity and hence depression.

Hawtrey believes that trade cycle is nothing but small scale replica of inflation and deflation. An increase in money supply will lead to boom and vice versa, a decrease in money supply will result in depression.

Banks will give more loans to traders and merchants by lowering the rate of interest. Merchants place more orders which induce the entrepreneurs to increase production by employing more labourers. This results in increase in employment and income leading to an increase in demand for goods. Thus the phase of expansion starts.

Business expands; factors of production are fully employed; price increases further, resulting in boom conditions. At this time, the banks call off loans from the borrowers. In order to repay the loans, the borrowers sell their stocks. This sudden disposal of goods leads to fall in prices and liquidation of marginal firms. Banks will further contract credit.

Thus the period of contraction starts making the producers reduce their output. The process of contraction becomes cumulative leading to depression. When the economy is at the level of depression, banks have excess reserves. Therefore, banks will lend at a low rate of interest which makes the entrepreneurs to borrow more. Thus revival starts, becomes cumulative and leads to boom.

Hawtrey’s theory has been criticised on many grounds

  • Hawtrey’s theory is considered to be an incomplete theory as it does not take into account the non-monetary factors which cause trade cycles.
  • It is wrong to say that banks alone cause business cycle. Credit expansion and contraction do not lead to boom and depression. But they are accentuated by bank credit.
  • The theory exaggerates the importance of bank credit as a means of financing development. In recent years, all firms resort to plough back of profits for expansion.
  • Mere contraction of bank credit will not lead to depression if marginal efficiency of capital is high. Businessmen will undertake investment in-spite of high rate of interest if they feel that the future prospects are bright.
  • Rate of interest does not determine the level of borrowing and investment. A high rate of interest will not prevent the people to borrow. Therefore, it may be stated that banking system cannot originate a trade cycle. Expansion and contraction of credit may be a supplementary cause but not the main and sole cause of trade cycle.

Degrees of Price Discrimination

Price discrimination means charging different prices from different customers or for different units of the same product. In the words of Joan Robinson: “The act of selling the same article, produced under single control at different prices to different buyers is known as price discrimination.” Price discrimination is possible when the monopolist sells in different markets in such a way that it is not possible to transfer any unit of the commodity from the cheap market to the dearer market.

Degrees of price discrimination

Prof. Pigou in his Economics of Welfare describes three degrees of discriminating power which a monopolist may wield. The type of discrimination discussed above is called discrimination of the third degree. We explain below discrimination of the first degree and the second degree.

Discrimination of the First Degree (1st) or Perfect Discrimination

Discrimination of the first degree occurs when a monopolist charges “a different price against all the different units of commodity in. such wise that the price exacted for each was equal to the demand price for it and no consumer’s surplus was left to the buyers.”

Joan Robinson calls it perfect discrimi­nation when the monopolist sells each unit of the product at a separate price. Such discrimination is possible only when consumers are sold the units for which they are prepared to pay the highest price and thus they are not left with any consumer’s surplus.

For perfect price discrimination, two conditions are required

(1) To keep the buyers separate from each other, and

(2) To deal with each buyer on a take-it-or-leave-it basis. When the discriminator of first degree is able to deal with his customers on the above basis, he can transfer the whole of consumers’ surplus to himself. Consider Figure 1. Where DD1 is the demand curve faced by the monopolist. Each buyer is assumed as a price-taker. Suppose the discriminating monopolist sells four units of his product at four different prices:

OQ1 unit at OP1price, Q1Q2 unit at OPprice, Q2Q3 unit at OP3 price and Q3Q4 unit at OP4 price. The total revenue (or price) obtained by him would be OQ4 AD. This area is the maximum expenditure that the consumers are willing to incur to buy all four units of the product under the first-degree discriminator’s all-or-nothing offer. But with no price discrimination under simple monopoly, the monopolist would sell all four units at the uniform price OP4 and thus obtain the total revenue of OQ4AP4.

This area represents the total expenditure that consumers would actually pay for the four units. Thus the difference between what Quantity the consumers were willing to pay (OQ4 AD) under Fig. 1 the take-it-or-leave-it offer of the first degree discrimi­nator and what they actually pay (OQ4AP4) to the simple monopolist, is consumers’ surplus. This is equal to the area of the triangle DAP4.

Thus under the first-degree price discrimination, the entire consumers’ surplus is pocketed by the monopolist when he charges a separate price for each unit of the product. Price discrimination of the first degree is rare and is to be found in such rare products as diamonds, jewels, precious stones, etc. But a monopolist must have full knowledge of the demand curve faced by him and he should know the maximum price that the consumers are willing to pay for each unit of the product he wants to sell.

Discrimination of the Second Degree (2nd) or Multi-part Pricing

In discrimination of the second degree, the monopolist divides the consumers in different slabs or groups or blocks and charges different prices for different slabs of the same product. Since the earlier units of the product have more utility for the consumers than the later ones, the monopolist charges a higher price for the former units and reduces the price for the later units in the respective slabs.

Such discrimination is only possible if the demand of each consumer below a certain maximum price is perfectly inelastic. Electric supply companies in developed countries practice discrimination of the second degree when they charge a high rate for the first slab of kilowatts of electricity consumed. As more electricity is used, the rate falls with subsequent slabs.

Figure 2 illustrates the second degree discrimination, where DD1is the demand curve for electric­ity on the part of domestic consumers in a town. CP3 represents the cost of generating electricity, so that the electricity company charges M1P1 rate per kw. up to OM1 units. For consuming the next M1 to М2 units, the rate is lowered to M2P2. The lowest rate charged is M3P3 for M2 to M3 units. M3P3 is, however, the lowest rate which will be charged even if a con­sumer consumes more than M3 units of electricity.

If the electricity company were to charge only one rate throughout, say M3P3the total revenue would not be maximized. It would be OCP3 M3But by charg­ing different rates for different unit slabs, it gets the total revenue equal to OM3 x P1M1 + OM2 x P2M2 + OM3x P3M3 Thus the second degree discriminator would take away a part of consumers’ surplus covered by the rectangles ABEP1and BCFP2 .The shaded area in three triangles DAP1 Р1ЕР2, and P2FP3 still remains with consumers as their surplus.

The second degree price discrimination is practised by telephone companies, railways, companies supplying water, electricity and gas in developed countries where these services are available in plenty. But it is not found in developing countries like India where such services are scarce.

The differences between the first and second degree price discrimination may be noted. In the first degree discrimination, the monopolist charges a different price for each different unit of the prod­uct. But in second degree discrimination, a number of units in one slab (or group or block) are sold at the lowest price and as the slabs increase, the prices charged by the monopolist are lowered. In the case of the former the monopolist takes away the whole of consumers’ surplus. But in the latter case, the monopolist takes away only a portion of the consumers’ surplus and the other portion is left with the buyer.

Conditions under which Price Discrimination is Possible

Price discrimination is possible under following conditions:

  1. Nature of Commodity

In the first place it is said that price discrimination is possible when the nature of the commodity or service is such that there is no possibility of transference from one market to the other.

That is, the goods sold in the cheaper market cannot be resold in the dearer market; otherwise the monopolist’s purpose will be defeated.

  1. Distance of Two Markets

Price discrimination is possible when the two markets or markets are separated by large distance or tariff barriers, so that it is not possible to transfer goods from a cheaper market to dearer markets. For instance, a monopolist may sell the same product at a higher price in Bombay and lower price in Meerut.

  1. Ignorance of the Consumers

Price discrimination is possible when the consumers are ignorant about price discrimination, they are not aware that in one part of the market prices are lower than in the other part. Thus, he purchases in dearer market, than in cheaper market since he is ignorant of the prices that are prevailing in different markets.

  1. Government Regulation

Price discrimination occurs when the government rules and regulations permit. For instance, according to rules, electricity rates are fixed at higher level for industrial purposes and lower for domestic uses. Similarly, railways charge by law higher fares from first class passengers than from the second class passengers. Hence, price discrimination is possible because of legal sanction.

  1. Geographical Discrimination

Price discrimination may be possible on account of geographical situations. The monopolist may discriminate between home and foreign buyers by selling at lower price in the foreign market than in the domestic market. Geographical discrimination is possible because no unit of the commodity sold in one market can be transferred to another.

  1. Difference in Elasticity of Demand

A commodity may have different elasticity of demand in different markets. Thus, the market of a commodity can be separated on the basis of its elasticity of demand.

Hence, a monopolist can charge different prices in different markets classified on the basis of elasticity of demand, low price is charged where demand is more elastic and high price in the market with the less elastic demand or inelastic demand.

  1. Artificial Difference between Goods

A monopolist may create artificial differences by presenting the same commodity under different names and labels, one for the rich and snobbish buyers and the other for the ordinary customers. For instance, a biscuit manufacturer may wrap small quantity of the biscuits, give it separate name and charge a higher price. Thus, he may charge different price for substantially the same product. He may charge Rs. 2/- for 100 gram wrapped biscuits and Rs. 1.50 for unwrapped biscuits.

error: Content is protected !!