by
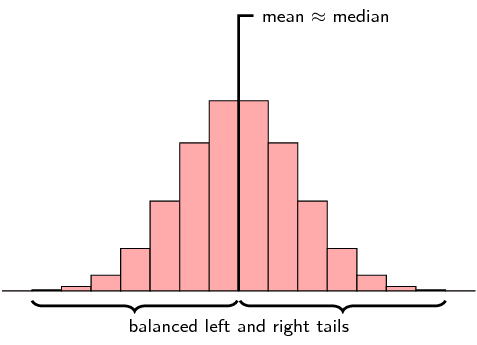
by A symmetric distribution is one where the left and right hand sides of the distribution are roughly equally balanced around the mean. The histogram below shows a typical symmetric distribution.
For symmetric distributions, the mean is approximately equal to the median. The tails of the distribution are the parts to the left and to the right, away from the mean. The tail is the part where the counts in the histogram become smaller. For a symmetric distribution, the left and right tails are equally balanced, meaning that they have about the same length.
Symmetrical distribution occurs when the values of variables occur at regular frequencies and the mean, median and mode occur at the same point. In graph form, symmetrical distribution often appears as a bell curve. If a line were drawn dissecting the middle of the graph, it would show two sides that mirror each other. Symmetrical distribution is a core concept in technical trading as the price action of an asset is assumed to fit a symmetrical distribution curve over time.
Symmetrical distribution is used by traders to establish the value area for a stock, currency or commodity on a set time frame. This time frame is can be intraday, such as 30 minute intervals, or it can be longer-term using sessions or even weeks and months. A bell curve can be drawn around the price points hit during that time period and it is expected that most of the price action – approximately 68% of price points – will fall within one standard deviation of the centre of the curve. The curve is applied to the y-axis (price) as it is the variable whereas time throughout the period is simply linear. So the area within one standard deviation of the mean is the value area where price and the actual value of the asset are most closely matched.
If the price action takes the asset price out of the value area, then it suggests that price and value are out of alignment. If the breach is to the bottom of the curve, the asset is considered to be undervalued. If it is to the top of the curve, the asset is to be overvalued. The assumption is that the asset will revert to the mean over time.
An Example of How Symmetrical Distribution is Used
Symmetrical distribution is most often used to put price action into context. The further the price action wanders from the value area one standard deviation on each side of the mean, the greater the probability that the underlying asset is being under or overvalued by the market. This observation will suggest potential trades to place based on how far the price action has wandered from the mean for the time period being used. On larger time scales, however, there is a much greater risk of missing the actual entry and exit points.
- Symmetrical distribution can refer to a bell curve or any curve where a halving line produces mirror images.
- When traders speak of reversion to the mean, they are referring to the symmetrical distribution of price action overtime.
- The opposite of symmetrical distribution is asymmetrical distribution, which is a curve that exhibits skewness.
Skewed
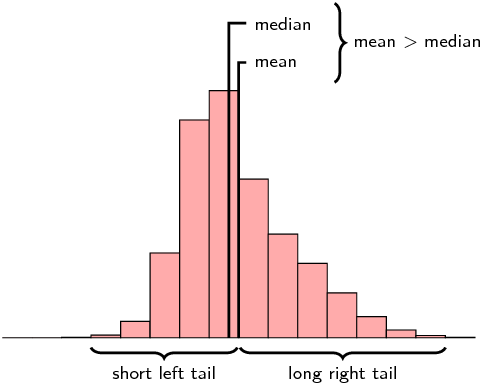
A distribution that is skewed right (also known as positively skewed) is shown below.
Now the picture is not symmetric around the mean anymore. For a right skewed distribution, the mean is typically greater than the median. Also notice that the tail of the distribution on the right hand (positive) side is longer than on the left hand side.
From the box and whisker diagram we can also see that the median is closer to the first quartile than the third quartile. The fact that the right hand side tail of the distribution is longer than the left can also be seen.
A distribution that is skewed left has exactly the opposite characteristics of one that is skewed right:
- The mean is typically less than the median;
- The tail of the distribution is longer on the left hand side than on the right hand side; and
- The median is closer to the third quartile than to the first quartile.