 by
by The AD–AS or aggregate demand–aggregate supply model is a macroeconomic model that explains price level and output through the relationship of aggregate demand and aggregate supply.
It is based on the theory of John Maynard Keynes presented in his work The General Theory of Employment, Interest and Money. It is one of the primary simplified representations in the modern field of macroeconomics, and is used by a broad array of economists, from libertarian, monetarist supporters of laissez-faire, such as Milton Friedman, to post-Keynesian supporters of economic interventionism, such as Joan Robinson.
Aggregate Demand:
Aggregate demand or aggregate demand price is the amount of money or price which all entrepreneurs expect to receive from the sale of output produced by a given number of men employed. Or it refers to the expected revenue from the sale of output at a particular level of employment. Each level of employment is associated with a particular aggregate supply price and there are different aggregate demand prices for different levels of employment.

Like the aggregate supply schedule, aggregate demand schedule shows the aggregate demand price for each possible level of employment. Plotting the aggregate demand schedule, we obtain aggregate demand curve as there is a positive relation between the level of employment and aggregate demand price, i.e., expected sales receipts. This is shown in Fig. It rises from left to right.
Aggregate Supply (AS):
Employers hire and purchase various inputs and raw materials to produce goods. Thus, production involves cost. If sales revenue from the sale of output produced exceeds cost of production at a given level of employment and output, the entrepreneur would be induced to employ more labour and other inputs to produce more.
At any given level of employment of labour, aggregate supply price is the total amount of money that all entrepreneurs in the economy expect to receive from the sale of output produced by given number of labourers employed. For each particular level of employment, there is an aggregate supply price. Here, by ‘price’ we mean the amount of money received from the sale of output, i.e., sales proceeds.
Thus, aggregate supply price refers to the proceeds from the sale of output at each level of employment and there are different aggregate supply prices for different levels of employment. If this information is expressed in a tabular form, we obtain “aggregate supply price schedule” or aggregate supply function. The aggregate supply function is a schedule of the minimum amounts of proceeds required to induce varying quantities of employment. Simply, it shows various aggregate supply prices at different levels of employment. Plotting this information graphically, we obtain aggregate supply curve.
According to Keynes, aggregate supply function is an increasing function of the level of employment. Aggregate supply (AS) curve slopes upward from left to right because volume of employment increases with the increase in sale proceeds. But there is a limit to increase output level. This is called full employment level of output beyond which output cannot be increased, it is because of full employment that AS curve becomes vertical or perfectly inelastic. This means that the level of employment cannot exceed full employment (LF) level even by increasing aggregate supply price. This is shown in Fig.
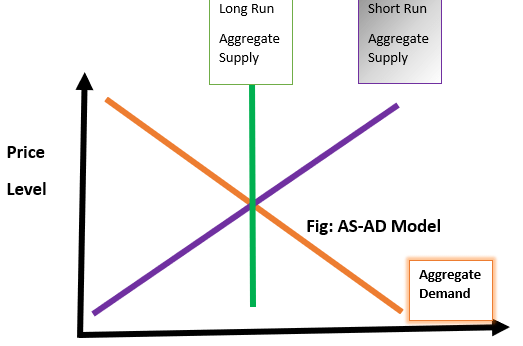
- Aggregate supply is the total quantity of output firms will produce and sell in other words, the real GDP.
- The upward-sloping aggregate supply curve also known as the short run aggregate supply curve shows the positive relationship between price level and real GDP in the short run.
- The aggregate supply curve slopes up because when the price level for outputs increases while the price level of inputs remains fixed, the opportunity for additional profits encourages more production.
- Potential GDP, or full-employment GDP, is the maximum quantity that an economy can produce given full employment of its existing levels of labor, physical capital, technology, and institutions.
- Aggregate demand is the amount of total spending on domestic goods and services in an economy.
- The downward-sloping aggregate demand curve shows the relationship between the price level for outputs and the quantity of total spending in the economy.