Production, Meaning, Factors of Production, Production Function, Features, Types

Production is a fundamental economic activity that involves transforming inputs into outputs to satisfy human wants and needs. It refers to the creation of utility by converting raw materials, natural resources, and various inputs such as labor and capital into finished goods or services. The term “production” is not confined only to manufacturing physical products but also includes the provision of services like healthcare, education, transportation, and banking.

In economics, production is defined as any activity that results in the generation of value. It adds utility in terms of form (changing the shape or structure of goods), place (making goods available where they are needed), and time (making goods available when they are required). For instance, converting cotton into fabric or providing consultancy services both fall under the scope of production.

Production plays a central role in the functioning of any economy. It is the backbone of economic development, as it creates goods and services, generates income, provides employment, and contributes to the GDP. The process involves the effective combination and utilization of the four factors of production—land, labor, capital, and entrepreneurship.

Efficient production ensures cost-effectiveness, quality output, and customer satisfaction. In a competitive business environment, firms continuously seek to improve their production processes through innovation and technology. Thus, production is not merely a technical activity but also a strategic function that directly influences business performance and market success.

Factors of Production:

  • Land

Land refers to all natural resources used in the creation of goods and services. This includes physical land, forests, minerals, water, and other gifts of nature. It is a passive factor but essential, as it provides the base for agriculture, manufacturing, and infrastructure. The availability and productivity of land influence industrial location and output. It is fixed in supply and subject to diminishing returns if overused without improvement or technological intervention.

  • Labour

Labor represents the human effort—both physical and mental—used in production. It includes the work of employees, professionals, and skilled or unskilled workers. The productivity of labor depends on education, health, skills, motivation, and working conditions. Labor is an active factor that contributes directly to the creation of goods and services. Effective labor management and training programs can enhance output, efficiency, and innovation, making labor a critical resource in competitive business environments.

  • Capital

Capital comprises man-made resources such as tools, machinery, buildings, and technology used to produce other goods and services. It differs from money, as capital refers specifically to physical assets that facilitate production. Capital improves labor productivity and production efficiency. It can be categorized into fixed capital (long-term assets) and working capital (short-term inputs). Businesses must invest in and maintain capital assets to scale operations and stay technologically competitive in dynamic markets.

  • Entrepreneurship

Entrepreneurship is the ability to identify opportunities, organize resources, take risks, and innovate. Entrepreneurs combine land, labor, and capital to initiate and manage production activities. They are the decision-makers who determine what, how, and for whom to produce. Successful entrepreneurs drive innovation, generate employment, and stimulate economic growth. Their risk-taking ability and vision are essential for launching new ventures and sustaining businesses in a changing economic landscape.

  • Human Capital

Human capital refers to the knowledge, skills, experience, and competencies possessed by individuals. Unlike labor, which measures effort, human capital emphasizes quality and expertise. Investment in education, training, and healthcare improves human capital, leading to higher productivity and innovation. In knowledge-driven economies, human capital is crucial for sectors like IT, R&D, and services. Businesses that cultivate strong human capital gain a strategic advantage through creativity, efficiency, and decision-making capabilities.

  • Information and Knowledge

Information and knowledge have become key production factors in the digital era. Access to market data, consumer insights, and industry trends enables firms to make informed decisions and respond to changes swiftly. Knowledge fuels innovation, strategy, and process improvement. Companies use data analytics and research to optimize supply chains, target customers, and reduce risks. In the modern economy, intangible assets like intellectual property and brand reputation also derive from valuable information.

  • Time

Time, though often overlooked, is a vital factor of production. It affects productivity, cost-efficiency, and market responsiveness. Timely decision-making, project execution, and delivery influence customer satisfaction and profitability. Time also determines the depreciation of assets and the lifecycle of products. Efficient time management leads to leaner operations and better resource utilization. In fast-moving markets, the ability to act quickly on opportunities is a decisive competitive advantage.

  • Technology

Technology enhances all other factors of production by increasing efficiency, reducing costs, and enabling innovation. It transforms traditional processes into automated, scalable, and intelligent systems. For instance, AI, robotics, and cloud computing streamline manufacturing, logistics, and customer service. Technology reduces reliance on physical labor and optimizes capital usage. In modern business strategy, adopting and upgrading technology is not optional—it is essential for survival, growth, and staying ahead in competitive markets.

Production Function:

Production Function is an economic concept that describes the relationship between the inputs used in production and the resulting output. It shows how different combinations of labor, capital, and other factors of production contribute to the production of goods or services. The production function helps in understanding the efficiency of resource utilization, and how changes in the quantity of inputs affect the level of output. It is often expressed as an equation or graph, representing the technological relationship in production.

Mathematically, such a basic relationship between inputs and outputs may be expressed as:

Q = f( L, C, N )

Where

Q = Quantity of output

L = Labour

C = Capital

N = Land.

Hence, the level of output (Q), depends on the quantities of different inputs (L, C, N) available to the firm. In the simplest case, where there are only two inputs, labour (L) and capital (C) and one output (Q), the production function becomes.

Q = f(L, C)

“The production function is a technical or engineering relation between input and output. As long as the natural laws of technology remain unchanged, the production function remains unchanged.” Prof. L.R. Klein

“Production function is the relationship between inputs of productive services per unit of time and outputs of product per unit of time.” Prof. George J. Stigler

“The relationship between inputs and outputs is summarized in what is called the production function. This is a technological relation showing for a given state of technological knowledge how much can be produced with given amounts of inputs.” Prof. Richard J. Lipsey

Thus, from the above definitions, we can conclude that production function shows for a given state of technological knowledge, the relation between physical quantities of inputs and outputs achieved per period of time.

Features of Production Function:

Following are the main features of production function:

1. Substitutability

The factors of production or inputs are substitutes of one another which make it possible to vary the total output by changing the quantity of one or a few inputs, while the quantities of all other inputs are held constant. It is the substitutability of the factors of production that gives rise to the laws of variable proportions.

2. Complementarity

The factors of production are also complementary to one another, that is, the two or more inputs are to be used together as nothing will be produced if the quantity of either of the inputs used in the production process is zero.

The principles of returns to scale is another manifestation of complementarity of inputs as it reveals that the quantity of all inputs are to be increased simultaneously in order to attain a higher scale of total output.

3. Specificity

It reveals that the inputs are specific to the production of a particular product. Machines and equipment’s, specialized workers and raw materials are a few examples of the specificity of factors of production. The specificity may not be complete as factors may be used for production of other commodities too. This reveals that in the production process none of the factors can be ignored and in some cases ignorance to even slightest extent is not possible if the factors are perfectly specific.

Production involves time; hence, the way the inputs are combined is determined to a large extent by the time period under consideration. The greater the time period, the greater the freedom the producer has to vary the quantities of various inputs used in the production process.

In the production function, variation in total output by varying the quantities of all inputs is possible only in the long run whereas the variation in total output by varying the quantity of single input may be possible even in the short run.

Time Period and Production Functions

The production function is differently defined in the short run and in the long run. This distinction is extremely relevant in microeconomics. The distinction is based on the nature of factor inputs.

Those inputs that vary directly with the output are called variable factors. These are the factors that can be changed. Variable factors exist in both, the short run and the long run. Examples of variable factors include daily-wage labour, raw materials, etc.

On the other hand, those factors that cannot be varied or changed as the output changes are called fixed factors. These factors are normally characteristic of the short run or short period of time only. Fixed factors do not exist in the long run.

Consequently, we can define two production functions: short-run and long-run. The short-run production function defines the relationship between one variable factor (keeping all other factors fixed) and the output. The law of returns to a factor explains such a production function.

For example, consider that a firm has 20 units of labour and 6 acres of land and it initially uses one unit of labour only (variable factor) on its land (fixed factor). So, the land-labour ratio is 6:1. Now, if the firm chooses to employ 2 units of labour, then the land-labour ratio becomes 3:1 (6:2).

The long-run production function is different in concept from the short run production function. Here, all factors are varied in the same proportion. The law that is used to explain this is called the law of returns to scale. It measures by how much proportion the output changes when inputs are changed proportionately.

Types of Production Function:

1. Short-Run Production Function

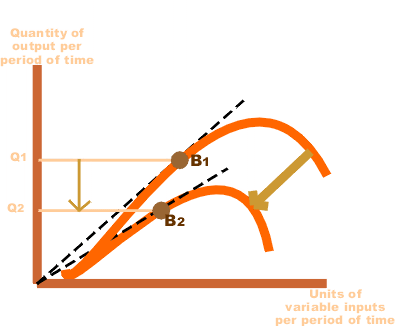
In the short run, at least one input is fixed (usually capital), while other inputs (like labor) are variable. The short-run production function examines how changes in variable inputs affect output, keeping the fixed input constant.

Key Features:

  • Focuses on the law of variable proportions (diminishing marginal returns).
  • Output increases initially at an increasing rate, then at a decreasing rate, and eventually may decline.

Example:

A factory with fixed machinery (capital) adds more workers (labor). Initially, productivity increases, but as workers crowd the factory, additional output diminishes.

2. Long-Run Production Function

In the long run, all inputs are variable, allowing firms to adjust labor, capital, and other resources fully. The long-run production function focuses on the optimal combination of inputs to achieve maximum efficiency and output.

Key Features:

  • Examines returns to scale:
    • Increasing Returns to Scale: Doubling inputs results in more than double the output.
    • Constant Returns to Scale: Doubling inputs results in a proportional doubling of output.
    • Decreasing Returns to Scale: Doubling inputs results in less than double the output.
  • Useful for long-term planning and investment decisions.

3. Cobb-Douglas Production Function

A mathematical representation of the relationship between two or more inputs (e.g., labor and capital) and output. It is commonly expressed as:

Q = A*L^α*K^β*

Where:

  • Q: Total output
  • L: Labor input
  • K: Capital input
  • α,β: Elasticities of output with respect to labor and capital
  • A: Total factor productivity

Key Features:

  • Demonstrates the contribution of labor and capital to output.
  • Widely used in economics for empirical studies and forecasting.

4. Fixed Proportions Production Function (Leontief Production Function)

In this type, inputs are used in fixed proportions to produce output. Increasing one input without proportionately increasing the other does not lead to higher output.

Example:

A car requires one engine and four tires. Adding more engines without increasing the number of tires will not produce more cars.

5. Variable Proportions Production Function

Inputs can be substituted for one another in varying proportions while producing the same level of output.

Example:

A firm can use either more machines and less labor or more labor and fewer machines to produce the same output.

6. Isoquant Production Function

An isoquant represents all possible combinations of two inputs (e.g., labor and capital) that produce the same level of output. The isoquant approach analyzes how inputs can be substituted while maintaining output levels.

Key Features:

  • Focuses on input substitution.
  • Helps determine the least-cost combination of inputs for a given output.

Measuring Elasticity of Demand

A change in the price of a commodity affects its demand. We can find the elasticity of demand, or the degree of responsiveness of demand by comparing the percentage price changes with the quantities demanded. In this article, we will look at the concept of elasticity of demand and take a quick look at its various types.

Elasticity of Demand

To begin with, let’s look at the definition of the elasticity of demand: “Elasticity of demand is the responsiveness of the quantity demanded of a commodity to changes in one of the variables on which demand depends. In other words, it is the percentage change in quantity demanded divided by the percentage in one of the variables on which demand depends.”

The following points highlight the top five methods used for measuring the elasticity of demand. The methods are:

  1. Price Elasticity of Demand
  2. Income Elasticity of Demand
  3. Cross Elasticity of Demand
  4. Advertisement or Promotional Elasticity of Sales
  5. Elasticity of Price Expectations.

Method 1. Price Elasticity of Demand

Price elasticity of demand is a measure of the responsiveness of demand to changes in the commodity’s own price. It is the ratio of the relative change in a dependent variable (quantity demanded) to the relative change in an independent variable (Price). In other words, price elasticity is the ratio of a relative change in quantity demanded to a relative change in price.

Also, elasticity is the percentage change in quantity demanded divided by the percentage in price.

Symbolically, we may rewrite the formula:

If percentages are known, the numerical value of elasticity can be calculated. The coefficient of elasticity of demand is a pure number i.e. it stands by itself, being independent of units of measurement. The coefficient of price elasticity of demand can be calculated with the help of the following formula.

Where,

Q is quantity, P is price, ΔQ/Q relative change in the quantity demanded and ΔP/P Relative change in price.

It should be noted that a minus sign (-) is generally inserted in the formula before the fraction with a view to making the coefficient of elasticity a non-negative value.

The price elasticity can be measured between two finite points on a demand curve (called arc elasticity) or on a point (called point elasticity).

Method 2. Income Elasticity of Demand

The responsiveness of quantity demanded to changes in income is called income elasticity of demand. With income elasticity, consumer incomes vary while tastes, the commodity’s own price, and the other prices are held constant.

The income elasticity of demand for a good or service may be calculated by the formula:

where- ey stands for the coefficient of income elasticity, Y for income.

Whereas price-elasticity of demand is always negative, income-elasticity of demand is always positive (except for inferior goods) as the relationship between income and quantity demanded of a product is positive. For inferior goods the income elasticity of demand is negative because as income increases, consumers switch over to the consumption of superior substitutes.

Method 3. Cross Elasticity of Demand

Demand is also influenced by prices of other goods and services. The cross elasticity measures the responsiveness of quantity demanded to changes in price of other goods and services. Cross elasticity of demand is defined as the percentage change in quantity demanded of one good caused by a 1 percentage change in the price of some other good.

Cross elasticity is used to classify the relationship between goods. If cross elasticity is greater than zero, an increase in the price of y causes an increase in the quantity demanded of x, and the two products are said to be substitutes. When the cross- elasticity is greater than zero, the goods or services involved are classified as complements Increases in the price of y reduces the quantity demanded of that product. Diminished demand for y causes a reduced demand for x. Bread and butter, cars and tires, and computers and computer programs are examples of pairs of goods that are complements.

The coefficient is positive if A and B are substitutes because the price change and the quantity change are in the same direction. The coefficient is negative if A and B are complements, because changes in the price of one commodity cause opposite changes in the quantity demanded of the other. Other things such as consumer taste for both commodities, consumer incomes and the price of the other commodity are held constant.

Method 4. Advertisement or Promotional Elasticity of Sales

The advertisement expenditure helps in promoting sales. The impact of advertisement on sales is not uniform at all level of total sales. The concept of advertising elasticity is significant in determining the optimum level of advertisement outlay particularly in view of competitive advertising by rival firms. An advertising elasticity could be defined as the percentage change in quantity demanded for a percentage change in advertising. Advertising might be measured by expenditure.

Advertising elasticity may be measured by the following formula:

Method 5. Elasticity of Price Expectations

People’s price expectations also play a significant role as a determinant of demand. J.R. Hicks, the English economist, in 1939, devised the concept of elasticity of price expectations. The elasticity of price expectations may be defined as the ratio of the relative change in expected future prices to the relative change in current prices.

Elasticity of Demand, Meaning, Types, Significance and price, income and cross elasticity

Elasticity of demand refers to the responsiveness or sensitivity of the quantity demanded of a good or service to changes in one of its determining factors, primarily its price, income of the consumer, or prices of related goods. In simpler terms, it measures how much the demand for a product changes when its price or other influencing factor changes.

The most common and widely used form is Price Elasticity of Demand (PED), which shows the extent to which the quantity demanded changes in response to a change in the price of the product. If a small change in price leads to a large change in quantity demanded, demand is said to be elastic. If a change in price results in little or no change in demand, it is inelastic.

Besides PED, there are other forms:

  • Income Elasticity of Demand (YED): Measures demand responsiveness to changes in consumer income.
  • Cross Elasticity of Demand (XED): Measures demand changes due to the price change of related goods (substitutes or complements).

Elasticity helps businesses make strategic decisions in pricing, marketing, taxation impact, and forecasting revenue. For instance, if a product is price elastic, lowering the price may increase total revenue. Conversely, if demand is inelastic, a firm can raise prices without a major drop in sales volume.

Understanding elasticity is crucial for firms, policymakers, and economists to predict consumer behavior and optimize resource allocation in response to changing economic variables.

Types of Elasticity:

Distinction may be made between Price Elasticity, Income Elasticity and Cross Elasticity. Price Elasticity is the responsiveness of demand to change in price; income elasticity means a change in demand in response to a change in the consumer’s income; and cross elasticity means a change in the demand for a commodity owing to change in the price of another commodity.

(a) Infinite or Perfect Elasticity of Demand

Let as first take one extreme case of elasticity of demand, viz., when it is infinite or perfect. Elasticity of demand is infinity when even a negligible fall in the price of the commodity leads to an infinite extension in the demand for it. In Fig. 1 the horizontal straight line DD’ shows infinite elasticity of demand. Even when the price remains the same, the demand goes on changing.

(b) Perfectly Inelastic Demand

The other extreme limit is when demand is perfectly inelastic. It means that howsoever great the rise or fall in the price of the commodity in question, its demand remains absolutely unchanged. In Fig. 2, the vertical line DD’ shows a perfectly inelastic demand. In other words, in this case elasticity of demand is zero. No amount of change in price induces a change in demand.

In the real world, there is no commodity the demand for which may be absolutely inelastic, i.e., changes in its price will fail to bring about any change at all in the demand for it. Some extension/contraction is bound to occur that is why economists say that elasticity of demand is a matter of degree only. In the same manner, there are few commodities in whose case the demand is perfectly elastic. Thus, in real life, the elasticity of demand of most goods and services lies between the two limits given above, viz., infinity and zero. Some have highly elastic demand while others have less elastic demand.

(c) Very Elastic Demand

Demand is said to be very elastic when even a small change in the price of a commodity leads to a considerable extension/con­traction of the amount demanded of it. In Fig. 3, DD’ curve illustrates such a demand. As a result of change of T in the price, the quantity demanded extends/contracts by MM’, which clearly is comparatively a large change in demand.

(d) Less Elastic Demand

When even a substantial change in price brings only a small extension/contraction in demand, it is said to be less elastic. In Fig. 4, DD’ shows less elastic demand. A fall of NN’ in price extends demand by MM’ only, which is very small.

Significance of Elasticity of Demand:

  • Determination of Output Level

For making production profitable, it is essential that the quantity of goods and services should be produced corresponding to the demand for that product. Since the changes in demand are due to the change in price, the knowledge of elasticity of demand is necessary for determining the output level.

  • Determination of Price

The elasticity of demand for a product is the basis of its price determination. The ratio in which the demand for a product will fall with the rise in its price and vice versa can be known with the knowledge of elasticity of demand.

If the demand for a product is inelastic, the producer can charge high price for it, whereas for an elastic demand product he will charge low price. Thus, the knowledge of elasticity of demand is essential for management in order to earn maximum profit.

  • Price Discrimination by Monopolist

Under monopoly discrimination the problem of pricing the same commodity in two different markets also depends on the elasticity of demand in each market. In the market with elastic demand for his commodity, the discriminating monopolist fixes a low price and in the market with less elastic demand, he charges a high price.

  • Price Determination of Factors of Production

The concept of elasticity for demand is of great importance for determining prices of various factors of production. Factors of production are paid according to their elasticity of demand. In other words, if the demand of a factor is inelastic, its price will be high and if it is elastic, its price will be low.

  • Demand Forecasting

The elasticity of demand is the basis of demand forecasting. The knowledge of income elasticity is essential for demand forecasting of producible goods in future. Long- term production planning and management depend more on the income elasticity because management can know the effect of changing income levels on the demand for his product.

  • Dumping

A firm enters foreign markets for dumping his product on the basis of elasticity of demand to face foreign competition.

  • Determination of Prices of Joint Products

The concept of the elasticity of demand is of much use in the pricing of joint products, like wool and mutton, wheat and straw, cotton and cotton seeds, etc. In such cases, separate cost of production of each product is not known.

Therefore, the price of each is fixed on the basis of its elasticity of demand. That is why products like wool, wheat and cotton having an inelastic demand are priced very high as compared to their byproducts like mutton, straw and cotton seeds which have an elastic demand.

  • Determination of Government Policies

The knowledge of elasticity of demand is also helpful for the government in determining its policies. Before imposing statutory price control on a product, the government must consider the elasticity of demand for that product.

The government decision to declare public utilities those industries whose products have inelastic demand and are in danger of being controlled by monopolist interests depends upon the elasticity of demand for their products.

  • Helpful in Adopting the Policy of Protection

The government considers the elasticity of demand of the products of those industries which apply for the grant of a subsidy or protection. Subsidy or protection is given to only those industries whose products have an elastic demand. As a consequence, they are unable to face foreign competition unless their prices are lowered through sub­sidy or by raising the prices of imported goods by imposing heavy duties on them.

  • Determination of Gains from International Trade

The gains from international trade depend, among others, on the elasticity of demand. A country will gain from international trade if it exports goods with less elasticity of demand and import those goods for which its demand is elastic.

In the first case, it will be in a position to charge a high price for its products and in the latter case it will be paying less for the goods obtained from the other country. Thus, it gains both ways and shall be able to increase the volume of its exports and imports.

Price Elasticity of Demand (PED):

Price Elasticity of Demand measures how much the quantity demanded of a product changes in response to a change in its price. It is calculated using the formula:

PED=% change in quantity demanded% change in price\text{PED} = \frac{\%\text{ change in quantity demanded}}{\%\text{ change in price}}

If PED > 1, demand is elastic (responsive to price changes). If PED < 1, demand is inelastic (not responsive). If PED = 1, demand is unitary elastic. For example, if the price of a luxury car drops and sales rise significantly, the demand is elastic. However, for necessities like salt or milk, even a big price rise may not reduce demand much, indicating inelastic demand.

Understanding PED helps businesses set pricing strategies. If demand is inelastic, firms can raise prices to increase total revenue. If it’s elastic, they may lower prices to attract more buyers and increase sales volume. Government agencies also consider PED when imposing taxes.

Income Elasticity of Demand (YED):

Income Elasticity of Demand measures how sensitive the quantity demanded of a good is to a change in consumers’ income. The formula is:

YED=% change in quantity demanded% change in income\text{YED} = \frac{\%\text{ change in quantity demanded}}{\%\text{ change in income}}

If YED > 1, the product is a luxury good, and demand increases more than proportionally with income. If 0 < YED < 1, it’s a normal good, and demand rises with income but at a slower rate. If YED < 0, it is an inferior good, and demand falls as income rises.

For example, as income increases, people may shift from public transport (inferior good) to personal vehicles (normal or luxury goods). Firms use YED to predict sales trends during economic growth or recession. High-income elasticity indicates sales will rise rapidly in prosperous times, while a low or negative elasticity means demand could fall during downturns.

Cross Elasticity of Demand (XED):

Cross Elasticity of Demand measures how the quantity demanded of one good responds to a price change of another related good. It is used to understand the relationship between substitute and complementary goods. The formula is:

XED=% change in quantity demanded of Good A% change in price of Good B\text{XED} = \frac{\%\text{ change in quantity demanded of Good A}}{\%\text{ change in price of Good B}}

If XED > 0, the goods are substitutes (e.g., tea and coffee); a price rise in one increases demand for the other. If XED < 0, the goods are complements (e.g., printers and ink cartridges); a price rise in one reduces demand for the other. If XED = 0, the goods are unrelated.

Businesses analyze XED to predict how a competitor’s price change can impact their own sales. For example, a soft drink company may monitor price changes of rival products to anticipate changes in their own demand. It’s also valuable in pricing bundled products or forming strategic alliances with producers of complementary goods.

Demand Forecasting: Meaning, Need, Objectives and Methods

Demand forecasting is the process of estimating the future demand for a product or service over a specific period. It is a critical component of business planning that helps organizations make informed decisions regarding production, inventory management, pricing, marketing, and resource allocation. Accurate demand forecasting enables businesses to anticipate customer needs, avoid overproduction or underproduction, and optimize operational efficiency.

The goal of demand forecasting is to reduce uncertainty and support strategic planning by predicting how much of a product consumers will be willing and able to purchase in the future. Forecasts are based on a combination of historical sales data, market trends, seasonal patterns, consumer behaviour, and external economic indicators. Businesses may use qualitative methods (like expert opinion and market research) or quantitative methods (like time series analysis, regression models, and machine learning algorithms) depending on the context and available data.

There are different types of demand forecasting, such as short-term forecasting (used for inventory and scheduling), medium-term forecasting (for sales and budget planning), and long-term forecasting (for capacity and expansion decisions). Each serves a specific business purpose.

Effective demand forecasting provides several benefits. It helps reduce costs, improves customer satisfaction through better availability of products, and enhances financial planning by aligning supply with anticipated demand. It also minimizes the risks of stockouts or surplus inventory.

In today’s competitive and dynamic market environment, demand forecasting is essential for gaining a competitive edge, ensuring customer satisfaction, and achieving overall business success. It supports data-driven decision-making and enables organizations to respond proactively to market changes.

Need of Demand Forecasting:

Demand plays a crucial role in the management of every business. It helps an organization to reduce risks involved in business activities and make important business decisions. Apart from this, demand forecasting provides an insight into the organization’s capital investment and expansion decisions.

  • Business Planning and Strategy

Demand forecasting is essential for long-term business planning and the formulation of strategies. It helps managers estimate future demand and align their production, investment, and marketing efforts accordingly. Forecasting provides insights into market trends, consumer behavior, and potential changes in demand patterns. This enables firms to develop strategies that minimize risks and capitalize on growth opportunities. Accurate forecasts guide business decisions regarding expansion, diversification, and resource allocation, thereby supporting sustainable growth and competitive advantage in dynamic business environments.

  • Production Planning and Scheduling

Forecasting demand enables businesses to plan production activities efficiently. It helps determine the quantity of raw materials, machinery, and labor required to meet expected demand. Proper production planning ensures timely delivery of goods, minimizes lead times, and avoids production bottlenecks. It also helps in reducing production costs by optimizing resource utilization. With accurate demand projections, companies can avoid overproduction, which leads to excess inventory, or underproduction, which causes stockouts and customer dissatisfaction. Thus, forecasting is crucial for streamlined operations.

  • Financial Planning and Budgeting

Demand forecasting plays a critical role in financial planning. It helps businesses estimate future revenues and costs, which is vital for preparing budgets, managing cash flows, and assessing profitability. Accurate forecasts allow firms to anticipate financial needs, allocate funds appropriately, and plan for future investments. It also aids in obtaining credit and financial support, as lenders often require evidence of projected demand and income. In essence, demand forecasting supports better fiscal discipline and long-term financial health of an organization.

  • Inventory Management

Proper demand forecasting ensures effective inventory management. By predicting the demand accurately, businesses can maintain optimum stock levels — not too high to incur carrying costs, and not too low to miss sales opportunities. It prevents situations of excess inventory that can lead to wastage, especially for perishable goods, and also avoids stockouts that frustrate customers. Forecasting aligns inventory control with market demand, thus ensuring product availability while keeping storage costs and capital investment in inventory at manageable levels.

  • Human Resource Planning

Accurate demand forecasts help determine labor requirements for upcoming production and sales activities. Businesses can estimate the number and types of employees needed during peak and off-peak seasons. For example, retailers hire more staff during festive seasons based on expected demand. This ensures optimal workforce allocation, better scheduling, and reduced employee downtime. Demand forecasting thus supports human resource planning by aligning labor supply with demand, ensuring that operations are smooth, cost-effective, and responsive to customer needs.

  • Marketing and Promotional Strategy

Forecasting demand is crucial for developing effective marketing campaigns and promotional activities. By knowing when and where demand is likely to rise, companies can focus their marketing efforts strategically. It enables them to allocate budgets, select appropriate channels, and time promotions to boost sales. For example, a forecasted surge in demand during holidays helps firms plan discounts or advertising campaigns in advance. In this way, demand forecasting improves marketing ROI and strengthens customer engagement and brand positioning.

  • Pricing Decisions

Demand forecasting provides critical input for pricing decisions. Understanding demand elasticity helps firms decide whether to raise or lower prices to maximize revenue. If forecasts show high future demand, businesses may maintain or increase prices. In contrast, if demand is expected to fall, they may consider promotional pricing or discounts. Accurate forecasting allows for dynamic pricing strategies that align with market conditions and consumer expectations, helping businesses stay competitive while optimizing profit margins.

  • Risk Management and Crisis Preparation

One of the most important needs of demand forecasting is to manage business risks. Forecasts allow firms to anticipate shifts in demand due to economic changes, competitor actions, or consumer preferences. This preparation helps companies develop contingency plans, adjust operations, and adapt their offerings accordingly. For instance, during uncertain periods like pandemics or economic slowdowns, forecasting enables proactive decision-making. It enhances organizational resilience by reducing uncertainty and enabling firms to react swiftly to market disruptions.

Objectives of short term demand forecasting:

  • Inventory Management

Short-term demand forecasting helps businesses maintain optimal inventory levels. By predicting near-future demand, firms avoid understocking or overstocking, which reduces storage costs and prevents stockouts. It ensures that inventory is aligned with expected sales, thereby improving customer satisfaction and operational efficiency. Effective inventory planning also minimizes losses due to obsolescence or spoilage, especially for perishable or seasonal products.

  • Production Planning

Short-term forecasts are crucial for daily or weekly production scheduling. They allow businesses to adjust their production volume based on immediate market demand. This prevents overproduction, reduces idle time, and ensures efficient use of resources. Production planning based on accurate short-term forecasts also helps maintain quality control and timely delivery, which are essential for meeting customer expectations and reducing operational costs.

  • Labor Force Scheduling

Forecasting short-term demand allows businesses to align their workforce requirements with production and service needs. Companies can schedule shifts, plan overtime, or hire temporary workers during peak periods. It ensures optimal manpower utilization and prevents labor shortages or surpluses. This leads to cost-effective operations and maintains employee satisfaction by avoiding overburdening during high-demand periods or underemployment during low-demand phases.

  • Pricing Adjustments

Short-term demand forecasting helps in making timely pricing decisions. If a surge in demand is anticipated, businesses may increase prices to maximize profits. Conversely, during a slowdown, they might offer discounts or promotions to stimulate demand. This flexibility in pricing ensures competitiveness, helps clear inventory, and supports revenue targets. Effective pricing adjustments based on demand help maintain a stable market position.

  • Marketing Campaigns

Forecasting demand over the short term helps businesses time their marketing and promotional activities for maximum impact. If demand is expected to rise, promotional efforts can be intensified to boost brand visibility. During slow periods, targeted campaigns can help stimulate customer interest. Proper timing of promotions improves return on marketing investment and ensures better alignment between marketing strategy and consumer behavior.

  • Financial Planning

Short-term forecasting supports accurate cash flow and budget planning. By estimating near-future sales and expenses, firms can manage working capital, schedule purchases, and plan for short-term financing needs. It reduces the likelihood of liquidity issues and ensures smooth operations. Financial planning based on short-term forecasts allows for timely payment of obligations, better credit management, and informed decision-making regarding short-term investments.

  • Customer Service Management

Short-term demand forecasting ensures products and services are available when customers need them. This helps improve order fulfillment rates, reduce waiting times, and enhance customer satisfaction. Meeting customer demand promptly builds trust and loyalty. It also enables businesses to handle sudden demand spikes efficiently, ensuring they remain responsive and competitive in fast-moving markets.

  • Managing Seasonal and Promotional Demand

Short-term forecasts are essential for anticipating seasonal variations and promotional event impacts. For example, demand often spikes during festivals or clearance sales. Accurate forecasting allows companies to prepare in advance, stocking up on popular products and aligning logistics accordingly. This minimizes disruption, boosts sales, and ensures timely service delivery during high-demand periods.

Objectives of long term demand forecasting:

  • Strategic Business Planning

Long-term demand forecasting provides the foundation for strategic decision-making. It helps businesses plan future goals, set long-term objectives, and align operations with projected market trends. Accurate forecasts enable companies to anticipate industry changes, customer needs, and competitive pressures, helping them maintain a sustainable competitive advantage. It supports decisions related to diversification, globalization, and product innovation over extended time horizons.

  • Capital Investment Decisions

Businesses rely on long-term demand forecasting to plan for capital investments such as new plants, machinery, technology upgrades, or infrastructure development. These decisions require large financial commitments and long gestation periods. Forecasting helps determine whether anticipated demand justifies such investments. It ensures that resources are not wasted on underutilized assets and enables the organization to plan investments that support future capacity needs.

  • Capacity Planning

To meet future demand effectively, firms need to plan their production and operational capacity well in advance. Long-term forecasting helps determine when and how much to expand capacity. It guides decisions about scaling production lines, adding shifts, or establishing new facilities. This ensures businesses are prepared to meet future demand increases without facing operational bottlenecks or sacrificing customer service quality.

  • Research and Development (R&D) Planning

Long-term forecasts inform decisions regarding research and development. Businesses can identify future market needs and begin working on new products or improving existing ones. This planning ensures that companies are not reactive but proactive, launching innovative solutions at the right time. R&D planning based on demand projections helps businesses remain technologically advanced and responsive to evolving consumer preferences.

  • Human Resource Development

Long-term forecasting supports workforce planning and development strategies. It helps organizations estimate future staffing needs, plan recruitment drives, invest in employee training, and develop succession plans. This ensures that the business has the right talent and skills available when needed. Preparing a future-ready workforce reduces the risk of talent shortages and helps organizations stay competitive and productive in the long run.

  • Financial Forecasting and Capital Allocation

Forecasting long-term demand assists in financial forecasting and efficient capital allocation. It helps determine future revenue streams, investment priorities, and funding requirements. Businesses can prepare long-term budgets, secure financing in advance, and allocate capital to areas with the highest expected returns. Long-term financial stability is strengthened when capital planning aligns with realistic demand estimates.

  • Risk Management and Contingency Planning

Long-term demand forecasting allows businesses to identify potential risks, such as market downturns, raw material shortages, or technological disruptions. Companies can then create contingency plans to mitigate these risks in advance. This proactive approach enhances organizational resilience, supports crisis readiness, and enables smoother operations even in uncertain or volatile environments.

  • Expansion and Diversification Strategy

Businesses aiming to grow through market expansion or diversification use long-term demand forecasting to identify viable opportunities. Forecasts indicate potential markets, emerging customer segments, and product demand trends. These insights support decisions on entering new geographic areas, launching new product lines, or acquiring complementary businesses. Long-term planning ensures resources are directed toward sustainable growth areas.

Methods of Demand Forecasting:

There is no easy or simple formula to forecast the demand. Proper judgment along with the scientific formula is needed to correctly predict the future demand for a product or service. Some methods of demand forecasting are discussed below:

1. Survey of Buyer’s Choice

When the demand needs to be forecasted in the short run, say a year, then the most feasible method is to ask the customers directly that what are they intending to buy in the forthcoming time period. Thus, under this method, the potential customers are directly interviewed. This survey can be done in any of the following ways:

  • Complete Enumeration Method: Under this method, nearly all the potential buyers are asked about their future purchase plans.
  • Sample Survey Method: Under this method, a sample of potential buyers is chosen scientifically and only those chosen are interviewed.
  • End-use Method: It is especially used for forecasting the demand of the inputs. Under this method, the final users i.e. the consuming industries and other sectors are identified. The desirable norms of consumption of the product are fixed, the targeted output levels are estimated and these norms are applied to forecast the future demand of the inputs.

Hence, it can be said that under this method the burden of demand forecasting is on the buyer. However, the judgments of the buyers are not completely reliable and so the seller should take decisions in the light of his judgment also.

The customer may misjudge their demands and may also change their decisions in the future which in turn may mislead the survey. This method is suitable when goods are supplied in bulk to industries but not in the case of household customers.

2. Collective Opinion Method

Under this method, the salesperson of a firm predicts the estimated future sales in their region. The individual estimates are aggregated to calculate the total estimated future sales. These estimates are reviewed in the light of factors like future changes in the selling price, product designs, changes in competition, advertisement campaigns, the purchasing power of the consumers, employment opportunities, population, etc.

The principle underlying this method is that as the salesmen are closest to the consumers they are more likely to understand the changes in their needs and demands. They can also easily find out the reasons behind the change in their tastes.

Therefore, a firm having good sales personnel can utilize their experience to predict the demands. Hence, this method is also known as Salesforce opinion or Grassroots approach method. However, this method depends on the personal opinions of the sales personnel and is not purely scientific.

3. Barometric Method

This method is based on the past demands of the product and tries to project the past into the future. The economic indicators are used to predict the future trends of the business. Based on the future trends, the demand for the product is forecasted. An index of economic indicators is formed. There are three types of economic indicators, viz. leading indicators, lagging indicators, and coincidental indicators.

The leading indicators are those that move up or down ahead of some other series. The lagging indicators are those that follow a change after some time lag. The coincidental indicators are those that move up and down simultaneously with the level of economic activities.

4. Market Experiment Method

Another one of the methods of demand forecasting is the market experiment method. Under this method, the demand is forecasted by conducting market studies and experiments on consumer behavior under actual but controlled, market conditions.

Certain determinants of demand that can be varied are changed and the experiments are done keeping other factors constant. However, this method is very expensive and time-consuming.

5. Expert Opinion Method

Usually, the market experts have explicit knowledge about the factors affecting the demand. Their opinion can help in demand forecasting. The Delphi technique, developed by Olaf Helmer is one such method.

Under this method, experts are given a series of carefully designed questionnaires and are asked to forecast the demand. They are also required to give the suitable reasons. The opinions are shared with the experts to arrive at a conclusion. This is a fast and cheap technique.

6. Statistical Methods

The statistical method is one of the important methods of demand forecasting. Statistical methods are scientific, reliable and free from biases. The major statistical methods used for demand forecasting are:

  • Trend Projection Method: This method is useful where the organization has sufficient amount of accumulated past data of the sales. This date is arranged chronologically to obtain a time series. Thus, the time series depicts the past trend and on the basis of it, the future market trend can be predicted. It is assumed that the past trend will continue in future. Thus, on the basis of the predicted future trend, the demand for a product or service is forecasted.
  • Regression Analysis: This method establishes a relationship between the dependent variable and the independent variables. In our case, the quantity demanded is the dependent variable and income, the price of goods, price of related goods, the price of substitute goods, etc. are independent variables. The regression equation is derived assuming the relationship to be linear. Regression Equation: Y = a + bX. Where Y is the forecasted demand for a product or service.

Benefits of Forecasting:

  • Future oriented

It enables managers to visualize and discount future to the present. It, thus, improves the quality of planning. Planning is done for future under certain known conditions and forecasting helps in knowing these conditions. It provides knowledge of planning premises with which managers can analyse their strengths and weaknesses and take action to meet the requirements of the future market.

For example, if the TV manufacturers feel that LCD or Plasma televisions will replace the traditional televisions, they should take action to either change their product mix or start manufacturing LCD/Plasma screens. Forecasting, thus, helps in utilizing resources in the best and most profitable business areas.

In the fast changing technological world, businesses may find it difficult to survive if they do not forecast customers’ needs and competitors’ moves.

  • Identification of critical areas

Forecasting helps in identifying areas that need managerial attention. It saves the company from incurring losses because of bad planning or ill defined objectives. By identifying critical areas of management and forecasting the requirement of different resources like money, men, material etc., managers can formulate better objectives and policies for the organisation. Forecasting, thus, increases organisational and managerial efficiency in terms of framing and implementing organisational plans and policies.

  • Reduces risk

Though forecasting cannot eliminate risk, it reduces it substantially by estimating the direction in which environmental factors are moving. It helps the organisation survive in the uncertain environment by providing clues about what is going to happen in future.

If managers know in advance about changes in consumer preferences, they will bring required modifications in their product design in order to meet the changed expectations of the consumers. Thus, forecasting cannot stop the future changes from happening but it can prepare the organisations to face them when they occur or avoid them, if they can.

  • Coordination

Forecasting involves participation of organisational members of all departments at all levels. It helps in coordinating departmental plans of the organisation at all levels. People in all departments at all levels are actively involved in coordinating business operations with likely future changes predicted as a result of forecasting. Thus, forecasting helps in movement of all the plans in the same direction.

  • Effective management

By identifying the critical areas of functioning, managers can formulate sound objectives and policies for their organisations. This increases organisational efficiency, effectiveness in achieving the plans, better management and effective goal attainment.

  • Development of executives

Forecasting develops the mental, conceptual and analytical abilities of executives to do things in planned, systematic and scientific manner. This helps to develop management executives.

Determinants of Demand

The demand of a product is influenced by a number of factors. An organization should properly understand the relationship between the demand and its each determinant to analyze and estimate the individual and market demand of a product.

The demand for a product is influenced by various factors, such as price, consumer’s income, and growth of population.

For example, the demand for apparel changes with change in fashion and tastes and preferences of consumers. The extent to which these factors influence demand depends on the nature of a product.

An organization, while analyzing the effect of one particular determinant on demand, needs to assume other determinants to be constant. This is due to the fact that if all the determinants are allowed to differ simultaneously, then it would be difficult to estimate the extent of change in demand.

Determinants of demand are the various factors that influence a consumer’s desire and ability to purchase a product or service at a given price and time. While price is a significant factor, demand is not solely dependent on it. In real-world markets, demand is shaped by a range of non-price elements that affect consumer behavior and purchasing decisions. These determinants help explain why the demand for a good might increase or decrease, even if its price remains unchanged.

Key determinants include consumer preferences, income levels, prices of related goods (substitutes and complements), expectations about future prices and income, and the number of buyers in the market. For instance, if consumer incomes rise, demand for normal goods typically increases. Similarly, a change in the price of a complementary good (like petrol for cars) can affect the demand for a related product.

Other important factors influencing demand include advertising, weather conditions, government policies, and demographic changes. For example, a successful marketing campaign can boost consumer interest in a product, while a shift in population demographics may lead to rising demand in specific sectors like housing or healthcare.

Understanding the determinants of demand is essential for businesses, marketers, and policymakers to anticipate market trends, adjust strategies, and make informed decisions about pricing, production, and resource allocation. These determinants form the foundation for demand forecasting and economic analysis.

Determinants of demand:

1. Consumer Preferences

Consumer preferences are among the most critical non-price determinants of demand. These preferences are shaped by various factors such as lifestyle, tastes, social trends, advertising, peer influence, cultural values, product image, and consumer perception of quality.

For instance, if consumers begin preferring plant-based diets due to health or environmental concerns, the demand for meat substitutes and organic vegetables will rise. Advertising plays a major role in shaping consumer tastes and establishing brand loyalty, which directly affects demand. A well-positioned marketing campaign can shift consumer preferences and increase demand for a product even without altering its price.

Moreover, factors like occupation, personality, age, and social status also influence individual preferences. A young professional may prefer a smartphone with advanced features, while an elderly person may prioritize ease of use.

2. Prices of Related Products

The demand for a product is also influenced by the prices of related goods, which are broadly categorized into:

  • Substitute Goods: Substitutes are products that can be used in place of each other. If the price of one increases, the demand for its substitute usually increases as well. Example: If the price of coffee rises significantly, consumers may switch to tea, increasing the demand for tea.
  • Complementary Goods: These are products that are used together, and the demand for one is linked to the price of the other. If the price of a complement rises, the demand for the associated product tends to fall. Example: A rise in the price of petrol may reduce the demand for cars, especially if the cars are not fuel-efficient.

Understanding how goods are related helps businesses determine pricing strategies. For example, reducing the price of razors may increase the demand for razor blades due to their complementary relationship.

3. Consumer Income

Income level is a fundamental determinant of demand. The ability to purchase goods and services increases with income, assuming other factors remain unchanged. The effect of income on demand depends on the type of good:

  • Normal Goods: For these goods, demand rises with an increase in income. For example, as income increases, consumers may purchase more branded clothing or dine out more often.
  • Inferior Goods: For these goods, demand decreases when income rises, as consumers switch to superior alternatives. For instance, people may stop buying budget instant noodles and shift to healthier or gourmet options when their income improves.

Thus, a firm must understand whether its product is a normal or inferior good to forecast demand appropriately based on economic conditions.

4. Consumer Expectations

Expectations regarding future income, prices, and product availability can affect current demand. Consumers tend to make anticipatory decisions:

  • If they expect prices to rise in the future, they may purchase more now, thereby increasing current demand.
  • If they expect a fall in income due to a recession or job loss, they may reduce present consumption and postpone non-essential purchases.

Example: Before the launch of a new iPhone model, people may delay purchasing the current model, anticipating new features or price drops, which affects the demand for the existing version.

Businesses use insights into consumer expectations to time their promotions, discount cycles, and inventory stocking.

5. Number of Buyers in the Market

The size and composition of the population directly impact the total market demand. An increase in the number of consumers raises the quantity demanded, even if individual demand remains constant.

Example: A growing urban population increases demand for housing, transportation, and utility services. Similarly, a rise in the number of school-aged children boosts demand for school supplies and uniforms.

Businesses consider demographic trends—such as aging populations, rising birth rates, or increased urban migration—to develop products that meet the evolving needs of a growing or changing customer base

6. Weather and Seasonal Factors

Weather conditions and seasonal variations often have a direct influence on the demand for specific products. Certain goods experience high demand only during specific times of the year.

Examples:

  • Winter increases demand for heaters, woolen clothing, and hot beverages.
  • Summer leads to a rise in the consumption of ice cream, air conditioners, and cold beverages.

Weather also affects agricultural demand and production. A drought may reduce the demand for lawn care services, while heavy rains can spike umbrella and raincoat sales. Businesses use seasonal demand patterns to manage inventory, plan promotions, and optimize logistics.

7. Government Policies and Regulations

Government decisions significantly affect demand through taxes, subsidies, trade regulations, or public service announcements.

Examples:

  • Subsidy on electric vehicles can increase their demand by lowering effective consumer prices.
  • Ban or tax on sugary drinks may reduce their demand and shift consumption to healthier alternatives.
  • Mandatory health regulations (like banning plastic) may boost the demand for eco-friendly alternatives.

Such policies can either expand or restrict consumer choice and purchasing ability, and companies must adapt their product offerings in response.

8. Technological Changes

Technological innovation influences demand by introducing new products, improving existing ones, or making older products obsolete.

Example: The introduction of smartphones drastically reduced the demand for MP3 players and digital cameras. Similarly, rapid internet connectivity increased demand for streaming services over traditional cable TV.

Technological developments also impact production and distribution, enabling better customization, lower costs, and faster delivery—further shaping consumer demand.

The Determinants of demand for a product:

1. Price of a Product or Service

Affects the demand of a product to a large extent. There is an inverse relationship between the price of a product and quantity demanded. The demand for a product decreases with increase in its price, while other factors are constant, and vice versa.

For example, consumers prefer to purchase a product in a large quantity when the price of the product is less. The price-demand relationship marks a significant contribution in oligopolistic market where the success of an organization depends on the result of price war between the organization and its competitors.

2. Income

Constitutes one of the important determinants of demand. The income of a consumer affects his/her purchasing power, which, in turn, influences the demand for a product. Increase in the income of a consumer would automatically increase the demand for products by him/her, while other factors are at constant, and vice versa.

For example, if the salary of Mr. X increases, then he may increase the pocket money of his children and buy luxury items for his family. This would increase the demand of different products from a single family. The income-demand relationship can be analyzed by grouping goods into four categories, namely, essential consumer goods, inferior goods, normal goods, and luxury goods.

3. Tastes and Preferences of Consumers

Play a major role in influencing the individual and market demand of a product. The tastes and preferences of consumers are affected due to various factors, such as life styles, customs, common habits, and change in fashion, standard of living, religious values, age, and sex.

A change in any of these factors leads to change in the tastes and preferences of consumers. Consequently, consumers reduce the consumption of old products and add new products for their consumption. For example, if there is change in fashion, consumers would prefer new and advanced products over old- fashioned products, provided differences in prices are proportionate to their income.

Apart from this, demand is also influenced by the habits of consumers. For instance, most of the South Indians are non-vegetarian; therefore, the demand for non- vegetarian products is higher in Southern India. In addition, sex ratio has a relative impact on the demand for many products.

For instance, if females are large in number as compared to males in a particular area, then the demand for feminine products, such as make-up kits and cosmetics, would be high in that area.

4. Price of Related Goods

Refer to the fact that the demand for a specific product is influenced by the price of related goods to a greater extent.

Related goods can be of two types, namely, substitutes and complementary goods, which are explained as follows:

  • Substitutes: Refer to goods that satisfy the same need of consumers but at a different price. For example, tea and coffee, jowar and bajra, and groundnut oil and sunflower oil are substitute to each other. The increase in the price of a good results in increase in the demand of its substitute with low price. Therefore, consumers usually prefer to purchase a substitute, if the price of a particular good gets increased.
  • Complementary Goods: Refer to goods that are consumed simultaneously or in combination. In other words, complementary goods are consumed together. For example, pen and ink, car and petrol, and tea and sugar are used together. Therefore, the demand for complementary goods changes simultaneously. The complementary goods are inversely related to each other. For example, increase in the prices of petrol would decrease the demand of cars.

5. Expectations of Consumers

Imply that expectations of consumers about future changes in the price of a product affect the demand for that product in the short run. For example, if consumers expect that the prices of petrol would rise in the next week, then the demand of petrol would increase in the present.

On the other hand, consumers would delay the purchase of products whose prices are expected to be decreased in future, especially in case of non-essential products. Apart from this, if consumers anticipate an increase in their income, this would result in increase in demand for certain products. Moreover, the scarcity of specific products in future would also lead to increase in their demand in present.

6. Effect of Advertisements

Refers to one of the important factors of determining the demand for a product. Effective advertisements are helpful in many ways, such as catching the attention of consumers, informing them about the availability of a product, demonstrating the features of the product to potential consumers, and persuading them to purchase the product. Consumers are highly sensitive about advertisements as sometimes they get attached to advertisements endorsed by their favorite celebrities. This results in the increase demand for a product.

7. Distribution of Income in the Society

Influences the demand for a product in the market to a large extent. If income is equally distributed among people in the society, the demand for products would be higher than in case of unequal distribution of income. However, the distribution of income in the society varies widely.

This leads to the high or low consumption of a product by different segments of the society. For example, the high income segment of the society would prefer luxury goods, while the low income segment would prefer necessary goods. In such a scenario, demand for luxury goods would increase in the high income segment, whereas demand for necessity goods would increase in the low income segment.

8. Growth of Population

Acts as a crucial factor that affect the market demand of a product. If the number of consumers increases in the market, the consumption capacity of consumers would also increase. Therefore, high growth of population would result in the increase in the demand for different products.

Law of Demand: Schedule, Curve

The demand curve is a graphical representation of the relationship between the price of a good or service and the quantity demanded for a given period of time. In a typical representation, the price will appear on the left vertical axis, the quantity demanded on the horizontal axis.

Understanding the Demand Curve

The demand curve will move downward from the left to the right, which expresses the law of demand — as the price of a given commodity increases, the quantity demanded decreases, all else being equal.

Note that this formulation implies that price is the independent variable, and quantity the dependent variable. In most disciplines, the independent variable appears on the horizontal or x-axis, but economics is an exception to this rule.

For example, if the price of corn rises, consumers will have an incentive to buy less corn and substitute it for other foods, so the total quantity of corn consumers demand will fall.

Types of Demand Curves

Elastic demand is when a price decrease causes a significant increase in the quantities bought. Like a stretchy rubber band, the quantity demanded moves a lot with just a little change in prices. An example of this would be ground beef; if prices drop just 25%, you might buy three times as much as you usually would because you know you’ll use it eventually and can put the extras in the freezer. If demand is perfectly elastic, the curve looks like a horizontal flat line.

Inelastic demand is when a price decrease won’t increase the quantities purchased. An example of this is bananas. No matter how cheap they are, there’s only so many you can eat before they spoil. You won’t buy three bunches even if the price falls 25%. If demand is perfectly inelastic, the curve looks like a vertical straight line.

The reason you react more to a sale on ground beef than a sale on bananas is because of the marginal utility of each additional unit. Marginal utility refers to the usefulness (utility) of each additional unit the further out on the margin you go. Because you can freeze ground beef, the third package is just as good to you as the first. The marginal utility of ground beef is high. Bananas lose their consistency in the freezer, so their marginal utility is low.

Shifting the Curve

If any determinants of demand other than the price change, the demand curve shifts. If demand increases, the entire curve will move to the right. That means larger quantities will be demanded at every price. If the entire curve shifts to the left, it means total demand has dropped for all price levels. For instance, if you just lost your job, you might not buy that third package of ground beef, even if it is on sale. You might just buy one package and be glad it’s 25% off.

Aggregate or Market Demand Curve

The market demand curve describes the quantity demanded by the entire market for a category of goods or services, like gasoline prices. When the price of oil goes up, all gas stations must raise their prices to cover their costs. Oil prices comprise 71% of gas prices; even if the price drops 50%, drivers don’t generally stock up on extra gas. That’s why when the price skyrockets by $0.50–$1 per gallon, people get upset. They can’t cut back their driving to work, school, or the grocery store, and are forced to pay more for gas. That’s an inelastic aggregate demand curve.

High gas prices lower people’s incomes for things other than gas, and that means the demand curve for those other things will drop. This is called a demand shift, and in this case, the entire demand curve shifts to the left. Since buyers have less income, they will purchase a lower quantity of a product even if its price doesn’t rise.

Demand Schedule

In economics, a demand schedule is a table that shows the quantity demanded of a good or service at different price levels. A demand schedule can be graphed as a continuous demand curve on a chart where the Y-axis represents price and the X-axis represents quantity.

A demand schedule most commonly consists of two columns. The first column lists a price for a product in ascending or descending order. The second column lists the quantity of the product desired or demanded at that price. The price is determined based on research of the market.

When the data in the demand schedule is graphed to create the demand curve, it supplies a visual demonstration of the relationship between price and demand, allowing easy estimation of the demand for a product or service at any point along the curve.

Demand Schedules vs. Supply Schedules

A demand schedule is typically used in conjunction with a supply schedule, which shows the quantity of a good that would be supplied to the market by producers at given price levels. By graphing both schedules on a chart with the axes described above, it is possible to obtain a graphical representation of the supply and demand dynamics of a particular market.

In a typical supply and demand relationship, as the price of a good or service rises, the quantity demanded tends to fall. If all other factors are equal, the market reaches an equilibrium where the supply and demand schedules intersect. At this point, the corresponding price is the equilibrium market price, and the corresponding quantity is the equilibrium quantity exchanged in the market.

Demand, Meaning, Objectives, Types

Demand refers to the desire for a good or service backed by the ability and willingness to pay for it at a given price over a specific period of time. It is not merely the desire to own a product, but also the capacity and readiness to actually purchase it. Therefore, effective demand requires both intent and purchasing power.

For instance, if a person wants a car but cannot afford it, that desire does not count as demand in economic terms. Only when the individual is both willing and able to buy the car does it become a part of market demand.

Demand is influenced by several factors, including the price of the good, consumer income, tastes and preferences, prices of related goods (substitutes and complements), future expectations, and population size. All these elements determine how much of a product consumers are ready to buy at various price levels.

The relationship between the price of a good and the quantity demanded is expressed through the Law of Demand, which states that, other things being equal, as the price of a good falls, the quantity demanded rises, and vice versa. This negative relationship is typically represented by a downward-sloping demand curve.

Objectives of Demand:

  • Understanding Consumer Behavior

One primary objective of demand is to understand how consumers behave in response to changes in price, income, and preferences. It helps businesses and economists analyze why, when, and how much consumers are willing to buy at various price points. This insight assists in crafting products and services that align with consumer needs and expectations. By studying demand patterns, firms can predict purchasing trends, identify target segments, and better understand customer decision-making processes in a dynamic market environment.

  • Price Determination

Demand plays a crucial role in determining the price of goods and services in the market. Prices are influenced by the interaction of demand with supply. When demand increases and supply remains constant, prices tend to rise, and when demand falls, prices generally decrease. Understanding demand elasticity helps firms set optimal pricing strategies to maximize revenue and market share. Accurate demand estimation allows businesses to strike the right balance between cost, price, and profitability.

  • Planning Production Levels

A key objective of analyzing demand is to help plan the level of production required to meet market needs. Businesses rely on demand forecasts to avoid overproduction or underproduction. Producing more than demanded leads to surplus and waste, while underproduction results in lost sales and dissatisfied customers. By estimating future demand accurately, firms can allocate resources efficiently, optimize inventory levels, and ensure smooth production cycles aligned with customer expectations.

  • Efficient Resource Allocation

Demand analysis enables optimal allocation of scarce resources. Knowing where demand is high allows businesses and policymakers to direct resources toward the most profitable and essential areas. In an economy, understanding demand helps determine what goods and services should be produced and in what quantity. This minimizes wastage and ensures that limited resources like labor, capital, and raw materials are used efficiently to satisfy the most pressing consumer needs.

  • Forecasting Market Trends

Demand helps in forecasting future market trends, enabling businesses to anticipate shifts in consumer preferences, seasonal variations, and market fluctuations. This foresight is essential for strategic planning, inventory management, and investment decisions. Accurate demand forecasts help companies prepare for peak periods and manage downturns effectively. In addition, understanding long-term demand trends supports innovation and the development of new products to meet changing customer demands and technological advancements.

  • Policy Formulation

For governments and public agencies, analyzing demand is crucial in formulating economic policies. It helps in understanding public needs for goods like food, housing, healthcare, and education. Demand studies guide decisions related to taxation, subsidies, and welfare schemes. For example, if the demand for affordable housing rises, the government may allocate more funds to housing projects. Understanding demand also aids in controlling inflation and planning macroeconomic goals such as employment and growth.

  • Facilitating Marketing Strategies

An objective of demand analysis is to support effective marketing strategies. Marketers use demand data to decide pricing, product positioning, promotional offers, and target markets. It helps identify customer segments with the highest potential and adjust marketing tactics based on demand sensitivity. Demand elasticity helps firms decide whether to use skimming, penetration, or competitive pricing. By aligning marketing efforts with demand behavior, businesses can boost customer satisfaction, loyalty, and profitability.

  • Investment and Expansion Decisions

Businesses use demand analysis to guide investment and expansion plans. High or increasing demand signals potential growth, prompting firms to invest in new plants, infrastructure, or markets. Conversely, declining demand warns firms to cut back or innovate. Investors and entrepreneurs analyze demand trends to evaluate the viability of launching new products or entering new markets. Thus, demand plays a foundational role in shaping strategic decisions that impact long-term business sustainability.

Types of Demand:

  • Price Demand

Price demand refers to the relationship between the price of a product and the quantity demanded by consumers. It follows the law of demand, which states that, all other things being equal, as the price of a good or service decreases, the quantity demanded increases, and vice versa. This inverse relationship is represented by a downward-sloping demand curve. Price demand is influenced by consumer preferences, income, and the availability of substitutes. For example, if the price of smartphones drops, more consumers are likely to buy them, increasing demand. Businesses analyze price demand to determine optimal pricing strategies that maximize revenue and market share. It helps firms understand how sensitive consumers are to price changes, also known as price elasticity of demand. Understanding price demand is essential for product pricing, discount planning, and sales forecasting. It provides a foundation for setting competitive prices and making supply decisions in both short and long terms.

  • Income Demand

Income demand represents the relationship between a consumer’s income level and the quantity of goods or services demanded. As a consumer’s income increases, demand for most goods also increases. These are called normal goods. However, for some goods, known as inferior goods, demand may decrease as income rises—consumers may shift to better-quality alternatives. For example, as income increases, demand for public transport may fall while car purchases rise. Income demand plays a significant role in determining market size and consumption patterns. Businesses monitor income trends to predict changes in consumer buying behavior and tailor their products accordingly. This type of demand is especially important during economic expansions and recessions, where fluctuations in disposable income affect overall sales. Understanding income demand helps businesses segment markets, price goods appropriately, and develop marketing strategies based on income groups. It also assists policymakers in assessing the effects of income distribution on consumption and economic growth.

  • Cross Demand

Cross demand refers to the demand for a product in response to the change in price of a related product—either a substitute or a complementary good. If two goods are substitutes (e.g., tea and coffee), an increase in the price of one (say, coffee) will increase the demand for the other (tea), as consumers switch preferences. Conversely, if two goods are complements (e.g., cars and petrol), a rise in the price of petrol may reduce the demand for cars. Cross demand is vital for businesses operating in competitive or interdependent markets, where pricing decisions for one product can impact others. This type of demand helps businesses anticipate market behavior and adapt their marketing, pricing, and production strategies accordingly. It is especially important in bundled product strategies and industries with high cross-product dependencies. Understanding cross demand allows firms to avoid pricing errors, forecast demand fluctuations more accurately, and remain competitive by aligning their offerings with market relationships.

  • Joint Demand

Joint demand occurs when two or more goods are used together to satisfy a particular need, meaning the demand for one is linked directly to the demand for another. These goods are known as complementary goods. For example, printers and ink cartridges, cars and tires, or smartphones and mobile apps are products that exhibit joint demand. When the demand for a car rises, so does the demand for related accessories or components. Joint demand is essential for businesses involved in product ecosystems or bundled services, as the sale of one item often drives the demand for another. Companies must ensure that complementary products are available and competitively priced to avoid disruptions in sales. Understanding joint demand is helpful for bundling strategies, cross-promotions, and inventory planning. It enables businesses to increase customer value, encourage repeat purchases, and build integrated product offerings that enhance user experience. Effective joint demand management improves customer satisfaction and boosts overall profitability.

Levels of Demand:

  • Individual Demand

Individual demand refers to the quantity of a good or service that a single consumer is willing and able to purchase at a given price over a specific period. It reflects personal preferences, income, and needs. For instance, if a person buys 2 litres of milk daily, that becomes their individual demand. This level of demand is useful for understanding consumer behavior and tailoring marketing strategies to target individuals through personalized pricing or offers. Factors influencing individual demand include the product’s price, the consumer’s income level, tastes, preferences, and the prices of related goods. Businesses study individual demand to forecast personal buying patterns and adapt their offerings to meet specific consumer expectations.

  • Market Demand

Market demand is the total quantity of a product or service that all consumers in a specific market are willing to buy at a given price over a certain period. It is the aggregate of all individual demands for a particular product. For example, if 1,000 individuals each demand 2 litres of milk daily, the market demand would be 2,000 litres per day. This level of demand is critical for businesses as it helps in estimating the overall demand in the industry and aids in production planning, marketing strategies, and pricing decisions. Factors affecting market demand include average income levels, population size, cultural trends, and overall economic conditions.

  • Organization/Industrial Demand

Organizational or industrial demand refers to the demand for goods and services by businesses, industries, and institutions, not for direct consumption, but for further production or operations. For example, a car manufacturer’s demand for steel, rubber, or machinery. This demand is typically derived demand, meaning it depends on the demand for the final consumer product. It is more sensitive to changes in economic activity, interest rates, and production costs. Understanding this level of demand is crucial for B2B firms, as it helps in supply chain management, inventory planning, and strategic investment decisions.

  • Short-Run Demand

Short-run demand is the demand for a product over a brief period, during which consumers and businesses have limited ability to adjust to price or income changes. In this period, demand is relatively inelastic, as buyers may not immediately change their consumption patterns. For example, demand for electricity may not drop significantly even if prices rise suddenly, as consumers can’t quickly reduce usage. Businesses analyze short-run demand to manage immediate production and distribution needs, respond to market shocks, and apply short-term pricing strategies. It is highly useful during festivals, seasons, or emergency conditions.

  • Long-Run Demand

Long-run demand represents the demand for a product over a longer time horizon, where consumers and producers have sufficient time to adjust to price, income, or preference changes. In the long run, demand is generally more elastic, as buyers can find substitutes or alter consumption habits. For example, if petrol prices rise continuously, consumers may shift to electric vehicles over time. Studying long-run demand is vital for strategic planning, R&D investments, and capacity expansion. It reflects structural changes in consumer behavior, technology, and macroeconomic trends, helping businesses to forecast future trends and build sustainable strategies.

Demand Analysis: Introduction to Law of Demand

Demand analysis is a research done to estimate or find out the customer demand for a product or service in a particular market. Demand analysis is one of the important consideration for a variety of business decisions like determining sales forecasting, pricing products/services, marketing and advertisement spending, manufacturing decisions, expansion planning etc. Demand analysis covers both future and retrospective analysis so that they can analyze the demand better and understand the product/service’s past success and failure too.

For a new company, the demand analysis can tell whether a substantial demand exists for the product/service and given the other information like number of competitors, size of competitors, industry growth etc it helps to decide if the company could enter the market and generate enough returns to sustain and advance its business.

The Demand Analysis is a process whereby the management makes decisions with respect to the production, cost allocation, advertising, inventory holding, pricing, etc. Although, how much a firm produces depends on its production capacity but how much it must endeavor to produce depends on the potential demand for its product.

Thus, the marketer is required to analyze properly the demand for its product in the market and must hold inventory accordingly. Such as if there is a potential demand in the future, then the firm should hold more inventories and in case there is no demand, then the production remains unwarranted, and hence, lesser inventories are held.

There is a possibility that production might exceed the demand, then the marketer must use alternative ways such as better advertisements to create a new demand.

The demand shows the relationship between two economic variables, the price of the product and the quantity of product that a consumer is willing to buy for a given period of time, other things being equal.

Features/Characteristics of Demand

The following are the main features or characteristics of demand that the marketer must keep in mind while analyzing the demand for its product:

  • The demand is the specific quantity that a consumer is willing to purchase. Thus, it is expressed in numbers.
  • The demand must mean the demand per unit of time, per month, per week, per day.
  • The demand is always at a price, e. any change in the price of a commodity will bring about a certain change in its quantity demanded.
  • The demand is always in a market, a place where a set of buyers and sellers meet. The market needs not to be a geographical area.

Thus, demand plays a crucial role in the success of any business enterprise. And it must be remembered that demand is always at a price and a particular time period in which it is created. Such as demand for woolen clothes will be more in winters than in any other season. Hence, demand analysis is always done in terms of the price and the relevant time period.

LAW OF DEMAND

The law of demand is one of the most fundamental concepts in economics. It works with the law of supply to explain how market economies allocate resources and determine the prices of goods and services that we observe in everyday transactions. The law of demand states that quantity purchased varies inversely with price. In other words, the higher the price, the lower the quantity demanded. This occurs because of diminishing marginal utility. That is, consumers use the first units of an economic good they purchase to serve their most urgent needs first, and use each additional unit of the good to serve successively lower valued ends.

Understanding the Law of Demand

Economics involves the study of how people use limited means to satisfy unlimited wants. The law of demand focuses on those unlimited wants. Naturally, people prioritize more urgent wants and needs over less urgent ones in their economic behavior, and this carries over into how people choose among the limited means available to them. For any economic good, the first unit of that good that a consumer gets their hands on will tend to be put to use to satisfy the most urgent need the consumer has that that good can satisfy.

For example, consider a castaway on a desert island who obtains a six pack of bottled, fresh water washed up on shore. The first bottle will be used to satisfy the castaway’s most urgently felt need, most likely drinking water to avoid dying of thirst. The second bottle might be used for bathing to stave off disease, an urgent but less immediate need. The third bottle could be used for a less urgent need such as boiling some fish to have a hot meal, and on down to the last bottle, which the castaway uses for a relatively low priority like watering a small potted plant to keep him company on the island.

In our example, because each additional bottle of water is used for a successively less highly valued want or need by our castaway, we can say that the castaway values each additional bottle less than the one before. Similarly, when consumers purchase goods on the market each additional unit of any given good or service that they buy will be put to a less valued use than the one before, so we can say that they value each additional unit less and less. Because they value each additional unit of the good less, they are willing to pay less for it. So the more units of a good consumers buy, the less they are willing to pay in terms of the price.

By adding up all the units of a good that consumers are willing to buy at any given price we can describe a market demand curve, which is always downward-sloping, like the one shown in the chart below. Each point on the curve (A, B, C) reflects the quantity demanded (Q) at a given price (P). At point A, for example, the quantity demanded is low (Q1) and the price is high (P1). At higher prices, consumers demand less of the good, and at lower prices, they demand more.

Demand vs Quantity Demanded

In economic thinking, it is important to understand the difference between the phenomenon of demand and the quantity demanded. In the chart, the term “demand” refers to the green line plotted through A, B, and C. It expresses the relationship between the urgency of consumer wants and the number of units of the economic good at hand. A change in demand means a shift of the position or shape of this curve; it reflects a change in the underlying pattern of consumer wants and needs vis-a-vis the means available to satisfy them. On the other hand, the term “quantity demanded” refers to a point along with horizontal axis. Changes in the quantity demanded strictly reflect changes in the price, without implying any change in the pattern of consumer preferences. Changes in quantity demanded just mean movement along the demand curve itself because of a change in price. These two ideas are often conflated, but this is a common error; rising (or falling) in prices do not decrease (or increase) demand, they change the quantity demanded.

Factors Affecting Demand

The shape and position of the demand curve can be impacted by several factors. Rising incomes tend to increase demand for normal economic goods, as people are willing to spend more. The availability of close substitute products that compete with a given economic good will tend to reduce demand for that good, since they can satisfy the same kinds of consumer wants and needs. Conversely, the availability of closely complementary goods will tend to increase demand for an economic good, because the use of two goods together can be even more valuable to consumers than using them separately, like peanut butter and jelly. Other factors such as future expectations, changes in background environmental conditions, or change in the actual or perceived quality of a good can change the demand curve, because they alter the pattern of consumer preferences for how the good can be used and how urgently it is needed.

  • The law of demand is a fundamental principle of economics which states that at a higher price consumers will demand a lower quantity of a good.
  • Demand is derived from the law of diminishing marginal utility, the fact that consumers use economic goods to satisfy their most urgent needs first.
  • A market demand curve expresses the sum of quantity demanded at each price across all consumers in the market.
  • Changes in price can be reflected in movement along a demand curve, but do not by themselves increase or decrease demand.
  • The shape and magnitude of demand shifts in response to changes in consumer preferences, incomes, or related economic goods, NOT to changes in price.

Fundamental Principles of Managerial Economics

Managerial Economics is both conceptual and metrical. Before the substantive decision problems which fall within the purview of managerial economics are discussed, it is useful to identify and under­stand some of the basic concepts underlying the subject.

Economic theory provides a number of con­cepts and analytical tools which can be of considerable and immense help to a manager in taking many decisions and business planning. This is not to say that economics has all the solutions. In fact, actual problem solving in business has found that there exists a wide disparity between economic theory of the firm and actual observed practice.

Therefore, it would be useful to examine the basic tools of managerial economics and the nature and extent of gap between the economic theory of the firm and the managerial theory of the firm. The contribution of economics to managerial economics lies in certain principles which are basic to managerial economics. There are six basic principles of managerial economics. They are:-

  1. The Incremental Principle

The incremental concept is probably the most important concept in economics and is certainly the most frequently used in Managerial Economics. Incremental concept is closely related to the mar­ginal cost and marginal revenues of economic theory.

The two major concepts in this analysis are incremental cost and incremental revenue. Incremental cost denotes change in total cost, whereas incremental revenue means change in total revenue resulting from a decision of the firm.

The incremental principle may be stated as follows:

A decision is clearly a profitable one if

(i) It increases revenue more than costs.

(ii) It decreases some cost to a greater extent than it increases others.

(iii) It increases some revenues more than it decreases others.

(iv) It reduces costs more than revenues.

  1. Marginal Principle

Marginal analysis implies judging the impact of a unit change in one variable on the other. Marginal generally refers to small changes. Marginal revenue is change in total revenue per unit change in output sold. Marginal cost refers to change in total costs per unit change in output produced (While incremental cost refers to change in total costs due to change in total output). The decision of a firm to change the price would depend upon the resulting impact/change in marginal revenue and marginal cost. If the marginal revenue is greater than the marginal cost, then the firm should bring about the change in price.

  1. The Opportunity Cost Principle

Both micro and macro economics make abundant use of the fundamental concept of opportunity cost. In everyday life, we apply the notion of opportunity cost even if we are unable to articulate its significance. In Managerial Economics, the opportunity cost concept is useful in decision involving a choice between different alternative courses of action.

Resources are scarce, we cannot produce all the commodities. For the production of one com­modity, we have to forego the production of another commodity. We cannot have everything we want. We are, therefore, forced to make a choice.

Opportunity cost of a decision is the sacrifice of alternatives required by that decision. Sacrifice of alternatives is involved when carrying out a decision requires using a resource that is limited in supply with the firm. Opportunity cost, therefore, represents the benefits or revenue forgone by pursuing one course of action rather than another.

The concept of opportunity cost implies three things:

(i) The calculation of opportunity cost involves the measurement of sacrifices.

(ii) Sacrifices may be monetary or real.

(iii) The opportunity cost is termed as the cost of sacrificed alternatives.

Opportunity cost is just a notional idea which does not appear in the books of account of the company. If resource has no alternative use, then its opportunity cost is nil.

In managerial decision making, the concept of opportunity cost occupies an important place. The economic significance of opportunity cost is as follows:

(i) It helps in determining relative prices of different goods.

(ii) It helps in determining normal remuneration to a factor of production.

(iii) It helps in proper allocation of factor resources.

  1. Discounting Principle

This concept is an extension of the concept of time perspective. Since future is unknown and incalculable, there is lot of risk and uncertainty in future. Everyone knows that a rupee today is worth more than a rupee will be two years from now. This appears similar to the saying that “a bird in hand is more worth than two in the bush.” This judgment is made not on account of the uncertainty surround­ing the future or the risk of inflation.

It is simply that in the intervening period a sum of money can earn a return which is ruled out if the same sum is available only at the end of the period. In technical parlance, it is said that the present value of one rupee available at the end of two years is the present value of one rupee available today. The mathematical technique for adjusting for the time value of money and computing present value is called ‘discounting’.

  1. Concept of Time Perspective Principle

The time perspective concept states that the decision maker must give due consideration both to the short run and long run effects of his decisions. He must give due emphasis to the various time periods. It was Marshall who introduced time element in economic theory.

The economic concepts of the long run and the short run have become part of everyday language. Managerial economists are also concerned with the short run and long run effects of decisions on revenues as well as costs. The main problem in decision making is to establish the right balance between long run and short run.

In the short period, the firm can change its output without changing its size. In the long period, the firm can change its output by changing its size. In the short period, the output of the industry is fixed because the firms cannot change their size of operation and they can vary only variable factors. In the long period, the output of the industry is likely to be more because the firms have enough time to increase their sizes and also use both variable and fixed factors.

In the short period, the average cost of a firm may be either more or less than its average revenue. In the long period, the average cost of the firm will be equal to its average revenue. A decision may be made on the basis of short run considerations, but may as time elapses have long run repercussions which make it more or less profitable than it at first appeared.

  1. Equi-Marginal Principle

One of the widest known principles of economics is the equi-marginal principle. The principle states that an input should be allocated so that value added by the last unit is the same in all cases. This generalization is popularly called the equi-marginal.

Let us assume a case in which the firm has 100 unit of labour at its disposal. And the firm is involved in five activities viz., А, В, C, D and E. The firm can increase any one of these activities by employing more labour but only at the cost i.e., sacrifice of other activities.

An optimum allocation cannot be achieved if the value of the marginal product is greater in one activity than in another. It would be, therefore, profitable to shift labour from low marginal value activity to high marginal value activity, thus increasing the total value of all products taken together.

Significance in Decision Making

Business firms are a combination of manpower, financial, and physical resources which help in making managerial decisions. Societies can be classified into two main categories production and consumption. Firms are the economic entities and are on the production side, whereas consumers are on the consumption side.

The performances of firms get analyzed in the framework of an economic model. The economic model of a firm is called the theory of the firm. Business decisions include many vital decisions like whether a firm should undertake research and development program, should a company launch a new product, etc.

Business decisions made by the managers are very important for the success and failure of a firm. Complexity in the business world continuously grows making the role of a manager or a decision maker of an organization more challenging! The impact of goods production, marketing, and technological changes highly contribute to the complexity of the business environment.

Steps for Decision Making

The steps for decision making like problem description, objective determination, discovering alternatives, forecasting cnsequences are described below:

Business Decision Making Steps

(i) Define the Problem

What is the problem and how does it influence managerial objectives are the main questions. Decisions are usually made in the firm’s planning process. Managerial decisions are at times not very well defined and thus are sometimes source of a problem.

(ii) Determine the Objective

The goal of an organization or decision maker is very important. In practice, there may be many problems while setting the objectives of a firm related to profit maximization and benefit cost analysis. Are the future benefits worth the present capital? Should a firm make an investment for higher profits for over 8 to 10 years? These are the questions asked before determining the objectives of a firm.

(iii) Discover the Alternatives

For a sound decision framework, there are many questions which are needed to be answered such as − What are the alternatives? What factors are under the decision maker’s control? What variables constrain the choice of options? The manager needs to carefully formulate all such questions in order to weigh the attractive alternatives.

(iv) Forecast the Consequences

Forecasting or predicting the consequences of each alternative should be considered. Conditions could change by applying each alternative action so it is crucial to decide which alternative action to use when outcomes are uncertain.

(v) Make a Choice

Once all the analysis and scrutinizing is completed, the preferred course of action is selected. This step of the process is said to occupy the lion’s share in analysis. In this step, the objectives and outcomes are directly quantifiable. It all depends on how the decision maker puts the problem, how he formalizes the objectives, considers the appropriate alternatives, and finds out the most preferable course of action.

Sensitivity Analysis

Sensitivity analysis helps us in determining the strong features of the optimal choice of action. It helps us to know how the optimal decision changes, if conditions related to the solution are altered. Thus, it proves that the optimal solution chosen should be based on the objective and well structured. Sensitivity analysis reflects how an optimal solution is affected, if the important factors vary or are altered.

Managerial economics is competent enough for serving the purposes in decision making. It focuses on the theory of the firm which considers profit maximization as the main objective. The theory of the firm was developed in the nineteenth century by French and English economists. Theory of the firm emphasizes on optimum utilization of resources, cost control, and profits in a single time period. Theory of the firm approach, with its focus on optimization, is relevant for small farms and producers.

error: Content is protected !!