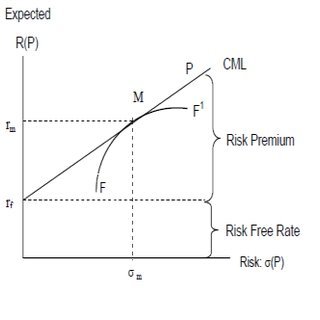
The capital market line (CML) represents portfolios that optimally combine risk and return. Capital asset pricing model (CAPM), depicts the trade-off between risk and return for efficient portfolios. It is a theoretical concept that represents all the portfolios that optimally combine the risk-free rate of return and the market portfolio of risky assets. Under CAPM, all investors will choose a position on the capital market line, in equilibrium, by borrowing or lending at the risk-free rate, since this maximizes return for a given level of risk.
Portfolios that fall on the capital market line (CML), in theory, optimize the risk/return relationship, thereby maximizing performance. The capital allocation line (CAL) makes up the allotment of risk-free assets and risky portfolio for an investor. CML is a special case of the CAL where the risk portfolio is the market portfolio. Thus, the slope of the CML is the sharpe ratio of the market portfolio. As a generalization, buy assets if the sharpe ratio is above the CML and sell if the sharpe ratio is below the CML.
CML differs from the more popular efficient frontier in that it includes risk-free investments. The intercept point of CML and efficient frontier would result in the most efficient portfolio, called the tangency portfolio.
The CAPM, is the line that connects the risk-free rate of return with the tangency point on the efficient frontier of optimal portfolios that offer the highest expected return for a defined level of risk, or the lowest risk for a given level of expected return. The portfolios with the best trade-off between expected returns and variance (risk) lie on this line. The tangency point is the optimal portfolio of risky assets, known as the market portfolio. Under the assumptions of mean-variance analysis that investors seek to maximize their expected return for a given amount of variance risk, and that there is a risk-free rate of return all investors will select portfolios which lie on the CML.
According to Tobin’s separation theorem, finding the market portfolio and the best combination of that market portfolio and the risk-free asset are separate problems. Individual investors will either hold just the risk-free asset or some combination of the risk-free asset and the market portfolio, depending on their risk-aversion. As an investor moves up the CML, the overall portfolio risk and return increases. Risk averse investors will select portfolios close to the risk-free asset, preferring low variance to higher returns. Less risk averse investors will prefer portfolios higher up on the CML, with a higher expected return, but more variance. By borrowing funds at the risk-free rate, they can also invest more than 100% of their investable funds in the risky market portfolio, increasing both the expected return and the risk beyond that offered by the market portfolio.
- The capital market line (CML) represents portfolios that optimally combine risk and return.
- CML is a special case of the CAL where the risk portfolio is the market portfolio. Thus, the slope of the CML is the sharpe ratio of the market portfolio.
- The intercept point of CML and efficient frontier would result in the most efficient portfolio called the tangency portfolio.
As a generalization, buy assets if sharpe ratio is above CML and sell if sharpe ratio is below CML.
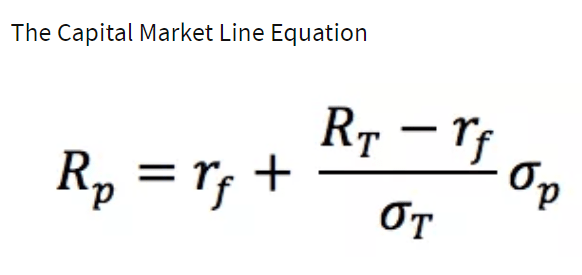
The Capital Market Line Equation:

Where:
Rp = Portfolio return
rf = Risk free rate
RT = Market return
σp = Standard deviation of portfolio returns
σT = Standard deviation of market returns
The Capital Market Line and the Security Market Line

The CML is sometimes confused with the security market line (SML). The SML is derived from the CML. While the CML shows the rates of return for a specific portfolio, the SML represents the market’s risk and return at a given time, and shows the expected returns of individual assets. And while the measure of risk in the CML is the standard deviation of returns (total risk), the risk measure in the SML is systematic risk, or beta. Securities that are fairly priced will plot on the CML and the SML. Securities that plot above the CML or the SML are generating returns that are too high for the given risk and are underpriced. Securities that plot below CML or the SML are generating returns that are too low for the given risk and are overpriced.
History of the Capital Market Line
Mean-variance analysis was pioneered by Harry Markowitz and James Tobin. The efficient frontier of optimal portfolios was identified by Markowitz in 1952, and James Tobin included the risk-free rate to modern portfolio theory in 1958. William Sharpe then developed the CAPM in the 1960s, and won a Nobel prize for his work in 1990, along with Markowitz and Merton Miller.