 by
by Normal distribution, or the Gaussian distribution, is a fundamental probability distribution that describes how data values are distributed symmetrically around a mean. Its graph forms a bell-shaped curve, with most data points clustering near the mean and fewer occurring as they deviate further. The curve is defined by two parameters: the mean (μ) and the standard deviation (σ), which determine its center and spread. Normal distribution is widely used in statistics, natural sciences, and social sciences for analysis and inference.
The general form of its probability density function is:

The parameter μ is the mean or expectation of the distribution (and also its median and mode), while the parameter σ is its standard deviation. The variance of the distribution is σ^2. A random variable with a Gaussian distribution is said to be normally distributed, and is called a normal deviate.
Normal distributions are important in statistics and are often used in the natural and social sciences to represent real-valued random variables whose distributions are not known. Their importance is partly due to the central limit theorem. It states that, under some conditions, the average of many samples (observations) of a random variable with finite mean and variance is itself a random variable whose distribution converges to a normal distribution as the number of samples increases. Therefore, physical quantities that are expected to be the sum of many independent processes, such as measurement errors, often have distributions that are nearly normal.
A normal distribution is sometimes informally called a bell curve. However, many other distributions are bell-shaped (such as the Cauchy, Student’s t, and logistic distributions).
Importance of Normal Distribution:
-
Foundation of Statistical Inference
The normal distribution is central to statistical inference. Many parametric tests, such as t-tests and ANOVA, are based on the assumption that the data follows a normal distribution. This simplifies hypothesis testing, confidence interval estimation, and other analytical procedures.
-
Real-Life Data Approximation
Many natural phenomena and datasets, such as heights, weights, IQ scores, and measurement errors, tend to follow a normal distribution. This makes it a practical and realistic model for analyzing real-world data, simplifying interpretation and analysis.
-
Basis for Central Limit Theorem (CLT)
The normal distribution is critical in understanding the Central Limit Theorem, which states that the sampling distribution of the sample mean approaches a normal distribution as the sample size increases, regardless of the population’s actual distribution. This enables statisticians to make predictions and draw conclusions from sample data.
-
Application in Quality Control
In industries, normal distribution is widely used in quality control and process optimization. Control charts and Six Sigma methodologies assume normality to monitor processes and identify deviations or defects effectively.
-
Probability Calculations
The normal distribution allows for the easy calculation of probabilities for different scenarios. Its standardized form, the z-score, simplifies these calculations, making it easier to determine how data points relate to the overall distribution.
-
Modeling Financial and Economic Data
In finance and economics, normal distribution is used to model returns, risks, and forecasts. Although real-world data often exhibit deviations, normal distribution serves as a baseline for constructing more complex models.
Central limit theorem
In probability theory, the central limit theorem (CLT) establishes that, in many situations, when independent random variables are added, their properly normalized sum tends toward a normal distribution (informally a bell curve) even if the original variables themselves are not normally distributed. The theorem is a key concept in probability theory because it implies that probabilistic and statistical methods that work for normal distributions can be applicable to many problems involving other types of distributions. This theorem has seen many changes during the formal development of probability theory. Previous versions of the theorem date back to 1810, but in its modern general form, this fundamental result in probability theory was precisely stated as late as 1920, thereby serving as a bridge between classical and modern probability theory.

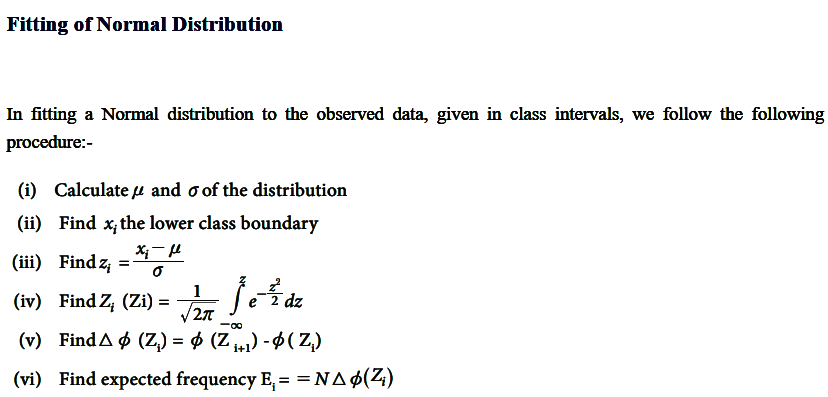
Characteristics Fitting a Normal Distribution
2 thoughts on “Normal Distribution: Importance, Central Limit Theorem”