 by
by The demand function is a mathematical representation that shows the relationship between the quantity of a good or service demanded and the factors influencing it, such as its price, consumer income, tastes, and the prices of related goods.
It is typically expressed as Qd = f(P, I, Pr, T, etc.),
where
Qd is the quantity demanded,
P is the price of the good,
I represents income,
Pr is the price of related goods (substitutes or complements),
T stands for consumer preferences.
The demand function helps in analyzing how changes in these factors impact the demand for a product.
|
Market Demand Schedule |
|
| Quantity demanded (Units) | Price per Unit (Rupees) Rs. |
| 2,000 | 6 |
| 3,000 | 5 |
| 4,000 | 4 |
| 5,000 | 3 |
| 5,500 | 2 |
| 6,000 | 1 |
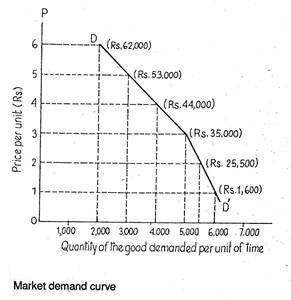
Quite often it is more convenient to work with the graph of a demand schedule, called a demand curve, rather than with the schedule itself. Figure shows the demand curve which is a graphical representation of the demand schedule presented in Table. Each price-quantity combination (Rs. 6, 2,000), (Rs. 5, 3,000), and so on is plotted. The locus of such points (each one showing a particular combination of p and q) DD’ is the demand curve.
The demand curve indicates the quantity of the good consumers are willing and able to buy at a fixed point of time at alternative prices, i.e., at every price from Rs. 6 to Rs. 1. Since price and quantity demanded are inversely related, the curve slopes downward.
Indeed, all market demand curves (which are arrived at by adding up demand curves of individual consumers) are downward sloping because of the law of demand. Individuals purchase less when price rises. Furthermore, as price increases, some individuals do not purchase anything at all, again causing the quantity demanded at each price to fall.
Alternatively, we can express demand as a function
Qx = ƒ(Px)
In this function, the other variables (income, and so on) are held constant. The quantity demanded of a commodity is a function of the price of the good, holding constant the other (proximate) determinants of demand.
2 thoughts on “Demand Function”