 by
by Value at risk (VAR or sometimes VaR) has been called the “new science of risk management,” but you don’t need to be a scientist to use VAR.
Here, in part 1 of this short series on the topic, we look at the idea behind VAR and the three basic methods of calculating it.
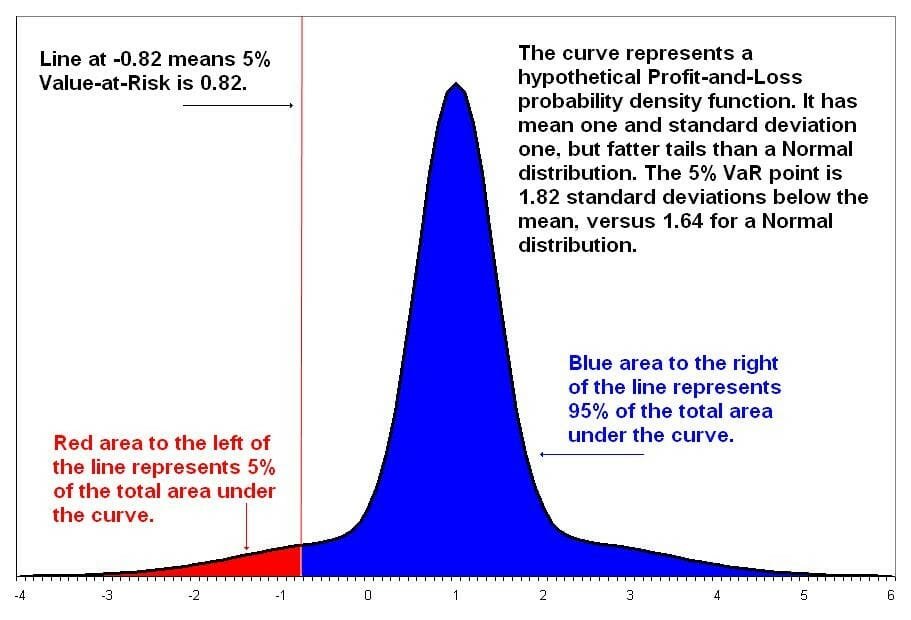
alue at risk (VaR) is a measure of the risk of loss for investments. It estimates how much a set of investments might lose (with a given probability), given normal market conditions, in a set time period such as a day. VaR is typically used by firms and regulators in the financial industry to gauge the amount of assets needed to cover possible losses.
For a given portfolio, time horizon, and probability p, the p VaR can be defined informally as the maximum possible loss during that time after we exclude all worse outcomes whose combined probability is at most p. This assumes mark-to-market pricing, and no trading in the portfolio.
For example, if a portfolio of stocks has a one-day 5% VaR of $1 million, that means that there is a 0.05 probability that the portfolio will fall in value by more than $1 million over a one-day period if there is no trading. Informally, a loss of $1 million or more on this portfolio is expected on 1 day out of 20 days (because of 5% probability).
More formally, p VaR is defined such that the probability of a loss greater than VaR is (at most) p while the probability of a loss less than VaR is (at least) 1−p. A loss which exceeds the VaR threshold is termed a “VaR breach”.
The Idea Behind VAR
The most popular and traditional measure of risk is volatility. The main problem with volatility, however, is that it does not care about the direction of an investment’s movement: stock can be volatile because it suddenly jumps higher. Of course, investors aren’t distressed by gains.
For investors, the risk is about the odds of losing money, and VAR is based on that common-sense fact. By assuming investors care about the odds of a really big loss, VAR answers the question, “What is my worst-case scenario?” or “How much could I lose in a really bad month?”
Now let’s get specific. A VAR statistic has three components: a time period, a confidence level and a loss amount (or loss percentage). Keep these three parts in mind as we give some examples of variations of the question that VAR answers:
- What is the most I can – with a 95% or 99% level of confidence – expect to lose in dollars over the next month?
- What is the maximum percentage I can – with 95% or 99% confidence – expect to lose over the next year?
You can see how the “VAR question” has three elements: a relatively high level of confidence (typically either 95% or 99%), a time period (a day, a month or a year) and an estimate of investment loss (expressed either in dollar or percentage terms).
Methods of Calculating VAR
Institutional investors use VAR to evaluate portfolio risk, but in this introduction, we will use it to evaluate the risk of a single index that trades like a stock: the Nasdaq 100 Index, which is traded through the Invesco QQQ Trust. The QQQ is a very popular index of the largest non-financial stocks that trade on the Nasdaq exchange.
There are three methods of calculating VAR: the historical method, the variance-covariance method, and the Monte Carlo simulation.
1. Historical Method
The historical method is the simplest method for calculating Value at Risk. Market data for the last 250 days is taken to calculate the percentage change for each risk factor on each day. Each percentage change is then calculated with current market values to present 250 scenarios for future value. For each of the scenarios, the portfolio is valued using full, non-linear pricing models. The third worst day selected is assumed to be 99% VaR.
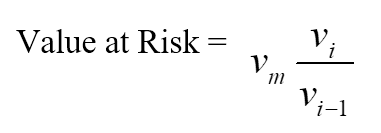
Where:
- vi is number of variables on day i
- m is the number of days from which historical data is taken
2. Parametric Method
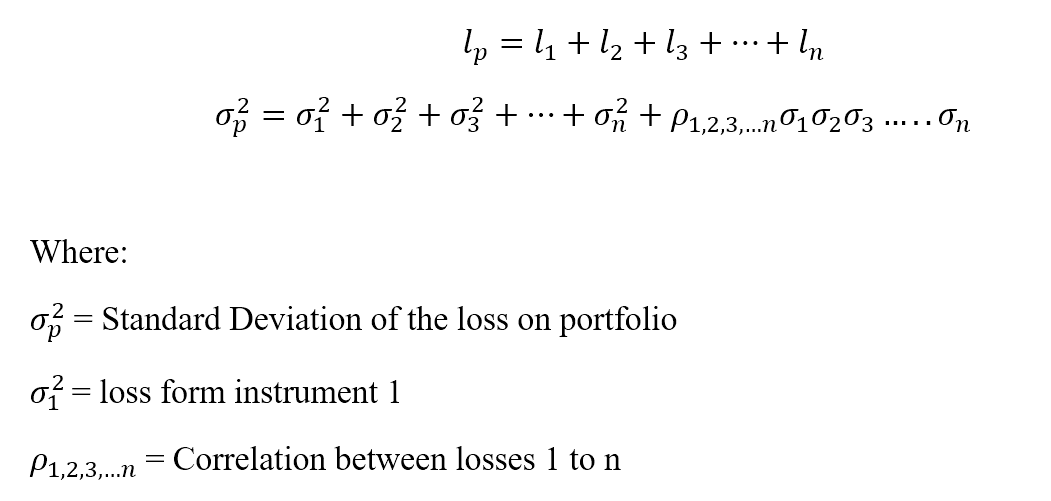
The parametric method is also known as the variance-covariance method. This method assumes a normal distribution in returns. Two factors are to be estimated – an expected return and a standard deviation. This method is best suited to risk measurement problems where the distributions are known and reliably estimated. The method is unreliable when the sample size is very small.
Let loss be ‘l’ for a portfolio ‘p’ with ‘n’ number of instruments.
-
Monte Carlo Method
Under the Monte Carlo method, Value at Risk is calculated by randomly creating a number of scenarios for future rates using non-linear pricing models to estimate the change in value for each scenario, and then calculating the VaR according to the worst losses. This method is suitable for a great range of risk measurement problems, especially when dealing with complicated factors. It assumes that there is a known probability distribution for risk factors.
Advantages of Value at Risk (VaR)
-
Easy to understand
Value at Risk is a single number that indicates the extent of risk in a given portfolio. Value at Risk is measured in either price units or as a percentage. This makes the interpretation and understanding of VaR relatively simple.
- Applicability
Value at Risk is applicable to all types of assets bonds, shares, derivatives, currencies, etc. Thus, VaR can be easily used by different banks and financial institutions to assess the profitability and risk of different investments, and allocate risk based on VaR.
- Universal
The Value at Risk figure is widely used, so it is an accepted standard in buying, selling, or recommending assets.
Limitations of Value at Risk
- Large portfolios
Calculation of Value at Risk for a portfolio not only requires one to calculate the risk and return of each asset but also the correlations between them. Thus, the greater the number or diversity of assets in a portfolio, the more difficult it is to calculate VaR.
- Difference in methods
Different approaches to calculating VaR can lead to different results for the same portfolio. 3. Assumptions
Calculation of VaR requires one to make some assumptions and use them as inputs. If the assumptions are not valid, then neither is the VaR figure.
Key Elements of Value at Risk
- Specified amount of loss in value or percentage
- Time period over which the risk is assessed
- Confidence interval