 by
by The two important components of any activity are the cost and time. Cost is directly proportional to time and vice versa. For example, in constructing a shopping complex, the expected time of completion can be calculated using be time estimates of various activities. But if the construction has to the finished earlier, it requires additional cost to complete the project. We need to arrive at a time / cost trade-off between total cost of project and total time required to complete it.
Normal time: Normal time is the time required to complete the activity at normal conditions and cost.
Crash time: Crash time is the shortest possible activity time; crashing more than the normal time will increase the direct cost.
Cost Slope in Network Analysis
Cost Slope
Cost slope is the increase in cost per unit of time saved by crashing. A linear cost curve is shown in Figure.
Linear Cost Curve
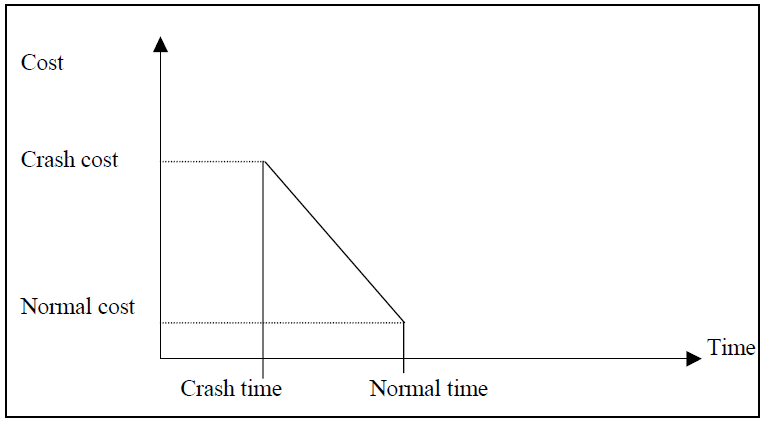
Cost slope=Crash cost Cc– Normal cost Nc/Normal time Ntt
Example : An activity takes 4 days to complete at a normal cost of Rs. 500.00. If it is possible to complete the activity in 2 days with an additional cost of Rs. 700.00, what is the incremental cost of the activity?
Solution:
Incremental Cost or Cost Slope = Cc– Nc / Ntt
= 700-500/4-2 = Rs. 100.00
It means if one day is reduced we have to spend Rs. 100/- extra per day.
Project Crashing
Procedure for crashing
Step1: Draw the network diagram and mark the Normal time and Crash time.
Step2: Calculate TE and TL for all the activities.
Step3: Find the critical path and other paths.
Step 4: Find the slope for all activities and rank them in ascending order.
Step 5: Establish a tabular column with required field.
Step 6: Select the lowest ranked activity; check whether it is a critical activity. If so, crash the activity, else go to the next highest ranked activity.
Note: The critical path must remain critical while crashing.
Step 7: Calculate the total cost of project for each crashing.
Step 8: Repeat Step 6 until all the activities in the critical path are fully crashed.
Example: The following Table 8.13 gives the activities of a construction project and other data.
Construction Project Data
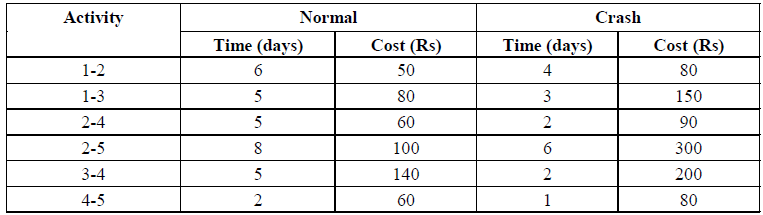
If the indirect cost is Rs. 20 per day, crash the activities to find the minimum duration of the project and the project cost associated.
Solution: From the data provided in the table, draw the network diagram and find the critical path.
Network Diagram

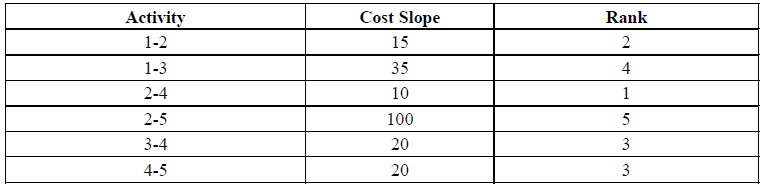
From the diagram, we observe that the critical path is 1-2-5 with project duration of 14 days The cost slope for all activities and their rank is calculated as shown in table below
Cost slope=Crash cost Cc– Normal cost Nc/Normal time Ntt
Cost Slope for activity 1– 2 = 80 – 50/6 – 4 = 30/2 = 15.
Cost Slope and Rank Calculated
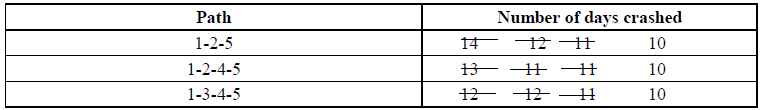
The available paths of the network are listed down in Table indicating the sequence of crashing.
Sequence of Crashing
Network Diagram Indicating Sequence of Crashing
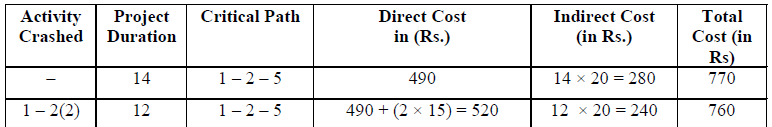
The sequence of crashing and the total cost involved is given in the following table
Initial direct cost = sum of all normal costs given
= Rs. 490.00
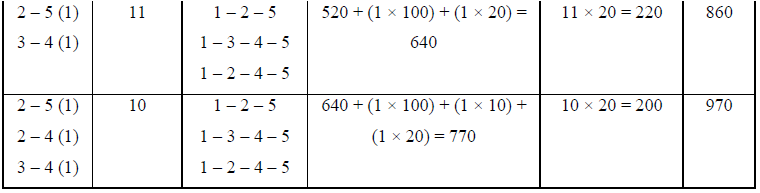
Sequence of Crashing & Total Cost
It is not possible to crash more than 10 days, as all the activities in the critical path are fully crashed. Hence the minimum project duration is 10 days with the total cost of Rs. 970.00.