 by
by Mode is the value which occurs most frequently in a set of observations. Simply put, it is the number which is repeated most, i.e. the number with the highest frequency. In the field of statistics, it is an important tool to interpret data in a relevant manner. Now it is possible for the data set to be multimodal (have more than one mode) which means more than one observation has the same number of frequencies.
Example: Let us find the Mode of the following data
4, 89, 65, 11, 54, 11, 90, 56
Here in these varied observations the most occurring number is 11, hence the Mode = 11

Mode of Grouped Data
As we know that Mode is the most frequently occurring number of a data set. This is easily recognizable in an ungrouped dataset, but if the data set is presented in class intervals, this can get a bit tricky. So how can we calculate Mode of grouped data?
Steps to be followed to calculate the Mode are,
- Create a table with two columns
- In column 1 write your class intervals
- In column 2 write the corresponding frequencies
- Locate the maximum frequency denoted by fm
- Determine the class corresponding to fm , this will be your Modal class
- Calculate the Mode using given formula
Mode = L +fm−f1(2fm−f1−f2) × h
Where,
L = lower limit of Modal Class
fm = frequency of modal class
h = width of modal class
f1 = frequency of pre modal class
f2 = frequency of post modal class
Relation between Mean, Median, and Mode
There is an inter-relation between the measures of central tendency. Professor Karl Pearson has suggested an empirical relationship between Mean, Median, and Mode. Via this equation, if the values of two measures are known we can find the third measure. The equation is as follows
Mean – Mode = 3 [Mean – Median]
Finding Mode Graphically
| Marks inclusive series |
Conversions into exclusive series |
No. of students (frequency) |
| (x) | (f) | |
| 10-19 | 9.5-19.5 | 10 |
| 20-29 | 19.5-29.5 | 12 |
| 30-39 | 29.5-39.5 | 18 |
| 40-49 | 39.5-49.5 | 30 |
| 50-59 | 49.5-59.5 | 16 |
| 60-69 | 59.5-69.5 | 6 |
| 70-79 | 69.5-79.5 | 8 |
The following steps must be followed to find the mode graphically.
- Represent the given data in the form of a Histogram.The hight of the rectangles in the histogram is marked by the frequencies of the class interval as shown in the graph .Identify the highest rectangle. This corresponds to the modal class of the series.
- Join the top corners of the modal rectangle with the immediately next corners of the adjacent rectangles. The two lines must be cutting each other.This might be difficult to visualise so look at the graph given below.
- Let the point where the joining lines cut each other be ‘A’. Draw a perpendicular line from point A onto the x-axis. The point ‘P’ where the perpendicular will meet the x-axis will give the mode.
The Histogram
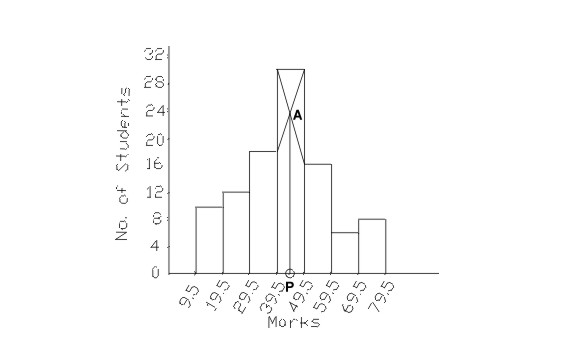
In this case the value of point P turns out to be 44.12