Lines of Regression; Co-efficient of regression
09/02/2020Lines of Regression
The Regression Line is the line that best fits the data, such that the overall distance from the line to the points (variable values) plotted on a graph is the smallest. In other words, a line used to minimize the squared deviations of predictions is called as the regression line.
There are as many numbers of regression lines as variables. Suppose we take two variables, say X and Y, then there will be two regression lines:
- Regression line of Y on X:This gives the most probable values of Y from the given values of X.
- Regression line of X on Y:This gives the most probable values of X from the given values of Y.
The algebraic expression of these regression lines is called as Regression Equations. There will be two regression equations for the two regression lines.
The correlation between the variables depend on the distance between these two regression lines, such as the nearer the regression lines to each other the higher is the degree of correlation, and the farther the regression lines to each other the lesser is the degree of correlation.
The correlation is said to be either perfect positive or perfect negative when the two regression lines coincide, i.e. only one line exists. In case, the variables are independent; then the correlation will be zero, and the lines of regression will be at right angles, i.e. parallel to the X axis and Y axis.
The regression lines cut each other at the point of average of X and Y. This means, from the point where the lines intersect each other the perpendicular is drawn on the X axis we will get the mean value of X. Similarly, if the horizontal line is drawn on the Y axis we will get the mean value of Y.
Co-efficient of regression
The Regression Coefficient is the constant ‘b’ in the regression equation that tells about the change in the value of dependent variable corresponding to the unit change in the independent variable.
If there are two regression equations, then there will be two regression coefficients:
Regression Coefficient of X on Y: The regression coefficient of X on Y is represented by the symbol bxy that measures the change in X for the unit change in Y. Symbolically, it can be represented as:
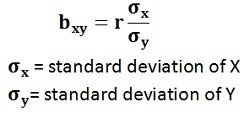
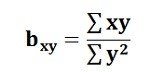
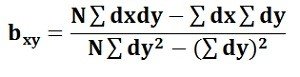
The bxy can be obtained by using the following formula when the deviations are taken from the actual means of X and Y:When the deviations are obtained from the assumed mean, the following formula is used:
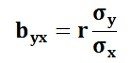
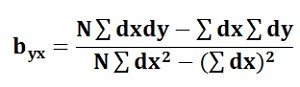
Regression Coefficient of Y on X: The symbol byx is used that measures the change in Y corresponding to the unit change in X. Symbolically, it can be represented as:
In case, the deviations are taken from the actual means; the following formula is used:
The byx can be calculated by using the following formula when the deviations are taken from the assumed means:

The Regression Coefficient is also called as a slope coefficient because it determines the slope of the line i.e. the change in the independent variable for the unit change in the independent variable