 by
by The Elliott Wave Theory was developed by Ralph Nelson Elliott to describe price movements in financial markets, in which he observed and identified recurring, fractal wave patterns.
How Elliott Waves Work
The Elliott Wave principle consists of impulse and corrective waves at its core:
Impulse Waves: Impulse waves consist of five sub-waves that make net movement in the same direction as the trend of the next-largest degree.
Corrective Waves: Corrective waves consist of three, or a combination of three, sub-waves that make net movement in the direction opposite to the trend of the next-largest degree.
These impulse and corrective waves are nested in a self-similar fractal to create larger patterns. For example, a one-year chart may be in the midst of a corrective wave, but a 30-day chart may show a developing impulse wave. A trader with this Elliott wave interpretation might therefore have a long-term bearish outlook with a short-term bullish outlook.
Elliott recognized that the Fibonacci sequence denotes the number of waves in impulses and corrections. Wave relationships in price and time also commonly exhibit Fibonacci ratios, such as ~38% and 62%.
Other analysts have developed indicators inspired by the Elliott Wave principle, including the Elliott Wave Oscillator, which is pictured in the image above. The oscillator provides a computerized method of predicting future price direction based on the difference between a five-period and 34-period moving average. Elliott Wave International’s artificial intelligence system, EWAVES, applies all Elliott wave rules and guidelines to data to generate automated Elliott wave analysis.
Elliott’s waves
Elliott saw that there is typically an impulsive wave which moves with the trend, followed by a corrective wave which is counter-trend. He saw that there is typically five waves that make up one larger impulsive wave, before a three-wave corrective phase. The ability to see the first five waves as one impulsive move highlights the fractal nature, given that you are expected to see the same patterns on a smaller and larger timeframe.
The theory
Elliott believed that every action is followed by a reaction. Thus, for every impulsive move, there will be a corrective one.
The first five waves form the impulsive move, moving in the direction of the main trend. The subsequent three waves provide the corrective waves. In total we will have seen one five-wave impulse move, followed by a three-wave corrective move (a 5-3 move). We label the waves within the impulsive wave as 1-5, while the three corrective waves are titled A, B and C.
Once the 5-3 move is complete, we have completed a single cycle.
However, those two moves (5 and 3) can then be taken to form the part of a wider 5-3 wave.

Taking the moves in isolation, the first impulsive move includes 5 waves: 3 with the trend and 2 against it. Meanwhile, the corrective move includes three waves: 2 against the trend and 1 with the trend.
Interestingly, the fact that the corrective wave has three legs can have implications for the wider use of highs and lows for the perception of trends. Thus, while the creation of higher highs and higher lows will typically signal an uptrend, Elliott Wave theory highlights that you can often see the creation of a lower high and lower low as a short-term correction from that trend. This does not necessarily negate the trend, but instead highlights a period of retracement that is stronger than the previous corrections seen within the impulsive move.
Rules
Wave 2 never retraces more than 100% of wave 1.
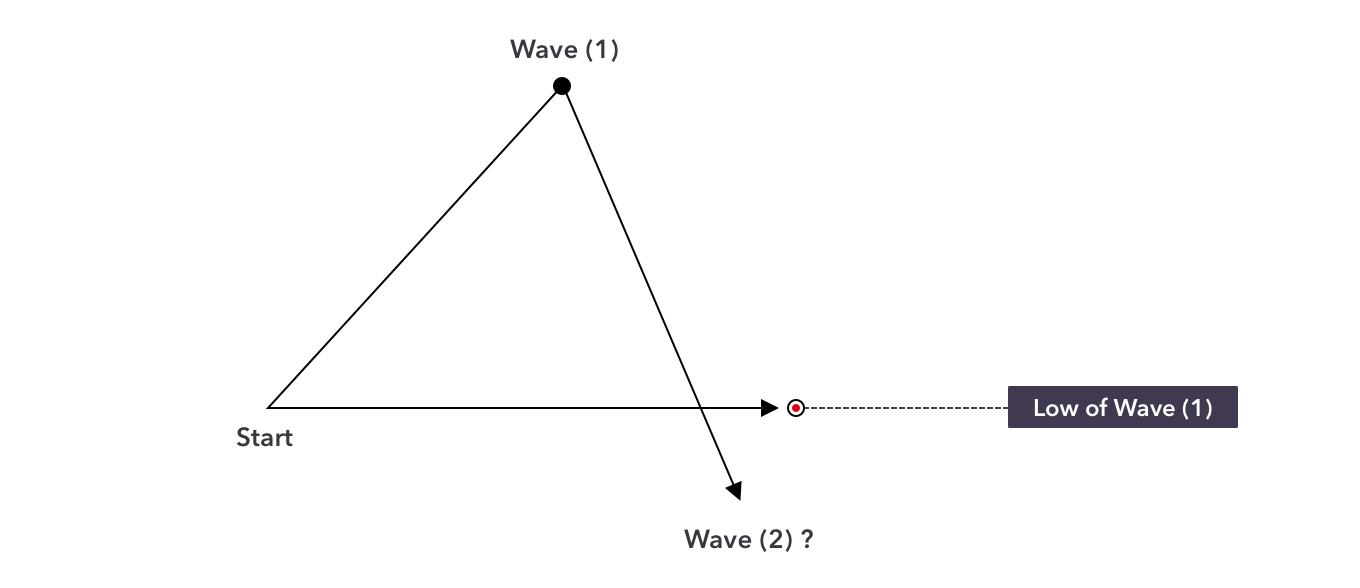
The image above shows a break below the start point of the wave sequence, thus negating the notion that it is wave1.
Wave 3 cannot be the shortest of the three impulse waves.

The image above highlights the instance when we see a third wave that is too short, thus negating the possibility that this is a correct wave count. Therefore, the subsequent waves remain part of the third wave rather than forming 4 and 5.
Wave 4 does not cross the final point of wave 1.
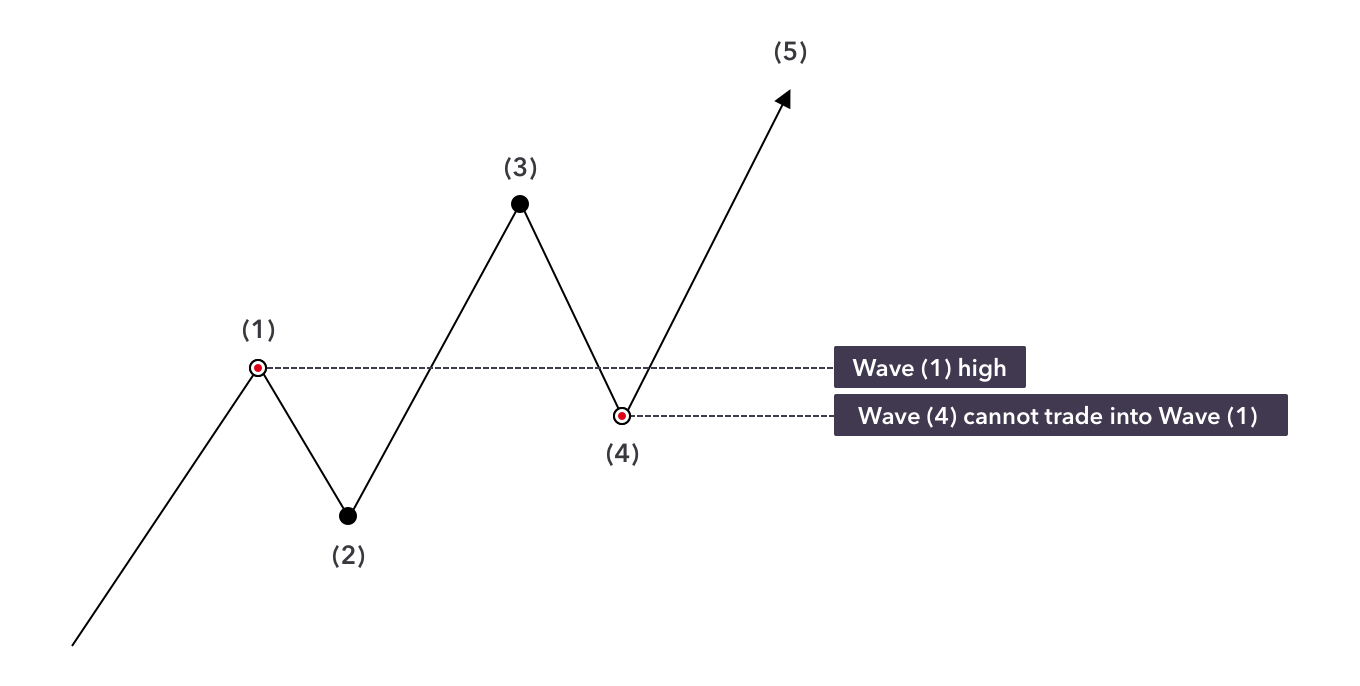
The break below the wave 1 point clearly negates the classification of the fourth wave, instead remaining within wave 3.
Cycles
Elliott assigned a series of categories to the waves, which highlight the fact that you will see the same patterns within both long-term and shorter-term charts. The categories are as follows.
- Grand supercycle: multi-century
• Supercycle: multi-decade (about 40 to 70 years)
• Cycle: one year to several years (or even several decades under an Elliott Extension)
• Primary: a few months to a couple of years
• Intermediate: weeks to months
• Minor: weeks
• Minute: days
• Minuette: hours
• Sub-minuette: minutes