 by
by Perceptual mapping / Market mapping is a diagrammatic technique used by asset marketers that attempts to visually display the perceptions of customers or potential customers. The positioning of a brand is influenced by customer perceptions rather than by those of businesses. For example, a business may feel it sells upmarket products of high quality, but if customers view the products as low quality, it is their views which will influence sales. Typically the position of a company’s product, product line, or brand is displayed relative to their competition. Perceptual maps, also known as market maps, usually have two dimensions but can be multi-dimensional or use multiple colours to add an extra variable. They can be used to identify gaps in the market and potential partners or merger targets as well as to clarify perceptual problems with a company’s product. So, if a business wants to find out where its brand is positioned in the market, it might carry out market research. This will help them to find out how the customers see their brand in relation to others in the market.
Perceptual mapping enables companies to better understand their customers: the who, why, where, how and what of their behaviour. If a business is perceived in a manner they find unsatisfactory, further research then identifies what can be done to change that. Perceptual mapping also allows businesses to see what consumers think of other brands, particularly their competitors. Regular uses of the maps can help track preferences, and see changes as they happen. Perceptual mapping can help define market segments, showing clusters of businesses differentiated by key aspects (such as higher class or number of restaurants). Within the clusters found in perceptual maps of entire industries, a business can classify potential partners or possible businesses to merge with, since the clustering of brands signifies the similarity in businesses, meaning they have corresponding attributes. It can also help identify gaps in a market where a new product or service could be introduced.
Perceptual maps can also be used to help keep track of how a new product, such as a recently introduced smartphone, is being viewed in a specific market. It is important to see that the way a business is marketing its product is not only successful, but successful in a manner that aligns with the business’s overarching goal for positioning.
Some companies seem to have fallen out of favour with the public, such as Quicken Loans and VW. Perceptual mapping can help elicit the extent of the damage.
Perceptual maps can have any number of dimensions but the most common is two dimensions. The first perceptual map below shows consumer perceptions of various automobiles on the two dimensions of sportiness/conservative and classy/affordable. This sample of consumers felt Porsche was the sportiest and classiest of the cars in the study (top right corner). They felt Plymouth was most practical and conservative (bottom left corner).

Cars that are positioned close to each other are seen as similar on the relevant dimensions by the consumer. For example, consumers see Buick, Chrysler, and Oldsmobile as similar. They are close competitors and form a competitive grouping. A company considering the introduction of a new model will look for an area on the map free from competitors. Some perceptual maps use different-sized circles to indicate the sales volume or market share of the various competing products.
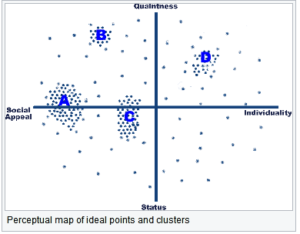
Displaying consumers’ perceptions of related products is only half the story. Many perceptual maps also display consumers’ ideal points. These points reflect ideal combinations of the two dimensions as seen by a consumer. The next diagram shows a study of consumers’ ideal points in the alcohol/spirits product space. Each dot represents one respondent’s ideal combination of the two dimensions. Areas where there is a cluster of ideal points (such as A) indicate a market segment. Areas without ideal points are sometimes referred to as demand voids.
A company considering introducing a new product will look for areas with a high density of ideal points. They will also look for areas without competitive rivals. This is best done by placing both the ideal points and the competing products on the same map.
Some maps plot ideal vectors instead of ideal points. The map below displays various aspirin products as seen on the dimensions of effectiveness and gentleness. It also shows two ideal vectors. The slope of the ideal vector indicates the ratio of the two dimensions preferred by those consumers within that segment. This study indicates that there is one segment that is more concerned with effectiveness than harshness, and another segment that is more interested in gentleness than strength.

Advantages of Perceptual Maps:
- To help us better understand market segments
- To see how the target market really perceives the brands in the marketplace
- To evaluate the performance of recent marketing campaigns and other marketing mix changes
- To confirm whether how consumers perceive us fits with our positioning goals.
- To track how successfully our new products have been positioned into the market.
- To check that our brand has a clear positioning space in the market.
- To monitor competitive brands and their changing market position.
- To monitor changes in consumer preferences over time.
- To help our organization identify gaps in the market.
Limitations of Perceptual Maps
- Perceptual maps often simplify the consumer’s purchase decision down to two product attributes.
- They tend to be more beneficial for low-involvement purchase decisions.
- They are more relevant for individual brands, and less helpful for corporate brand image.
- The data is often difficult or expensive to obtain (via marketing research).
- There is a often difference between consumer’s perception of the brand’s benefits versus reality.